GBPJPY LONG FORECAST Q2 W16 D14 Y25GBPJPY LONG FORECAST Q2 W16 D14 Y25
Good morning Monday!
Positive weekly rejection via weekly order block.
Let's await a break of structure!
FRGNT X
GBPJPY.100.CSM trade ideas

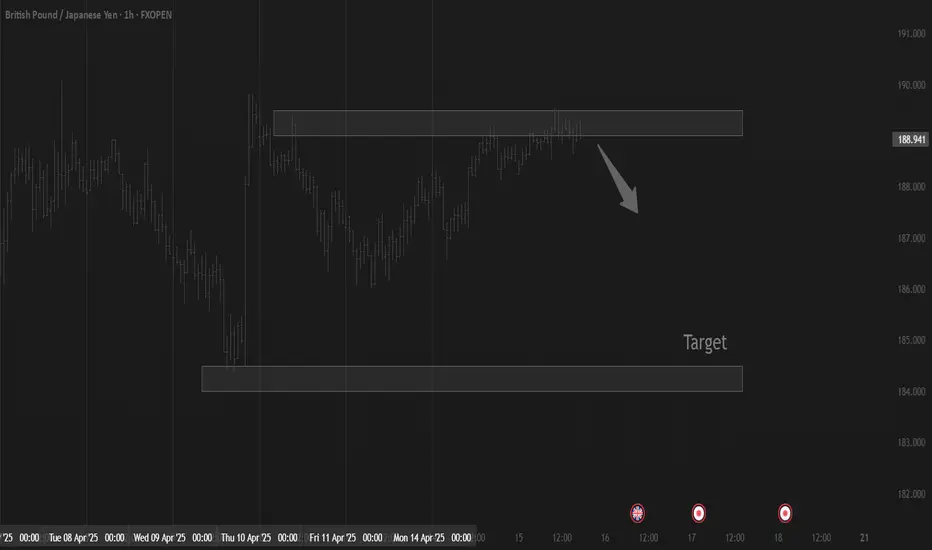
GBPJPY Is Going Down! Sell!
Please, check our technical outlook for GBPJPY.
Time Frame: 45m
Current Trend: Bearish
Sentiment: Overbought (based on 7-period RSI)
Forecast: Bearish
The price is testing a key resistance 188.674.
Taking into consideration the current market trend & overbought RSI, chances will be high to see a bearish movement to the downside at least to 187.917 level.
P.S
Overbought describes a period of time where there has been a significant and consistent upward move in price over a period of time without much pullback.
Disclosure: I am part of Trade Nation's Influencer program and receive a monthly fee for using their TradingView charts in my analysis.
Like and subscribe and comment my ideas if you enjoy them!

GBP/JPY: Poised for Gains Above 189.15GBP/JPY gained slightly after forming a minor bottom around 187.46. It hits an intraday high of 189.03 and is currently trading around 188.94. Intraday trend is bullish as long as support 186.50 holds.
The GBP/JPY pair is trading above 34 and 55 EMA (Short-term) and below 200 EMA (long term on the 15-min chart, confirms a bullish trend. Immediate resistance is at 190,a breach above this level targets of 191/191.75/192.30/193. Downside support is at 188 with additional levels a 188.45/188/187.46/187.10/186.45.
Market Indicators
CCI (50)- Bullish
Directional movement index - Bullish
Trading Strategy: Buy on dips
It is good to buy above 189.15 with SL around 188.40 for a TP of 192.

GJ-Thu-17/04/25 TDA-More consolidation, easier breakouts!Analysis done directly on the chart
Sometimes all you need to do is to be patient
Nothing more, nothing less. Not everyday is
a good trading day. Learn to step back is part
of a good trading skill of every good trader.
Do you know when to really step back? Think
about it.
Not financial advice, DYOR.
Market Flow Strategy
Mister Y

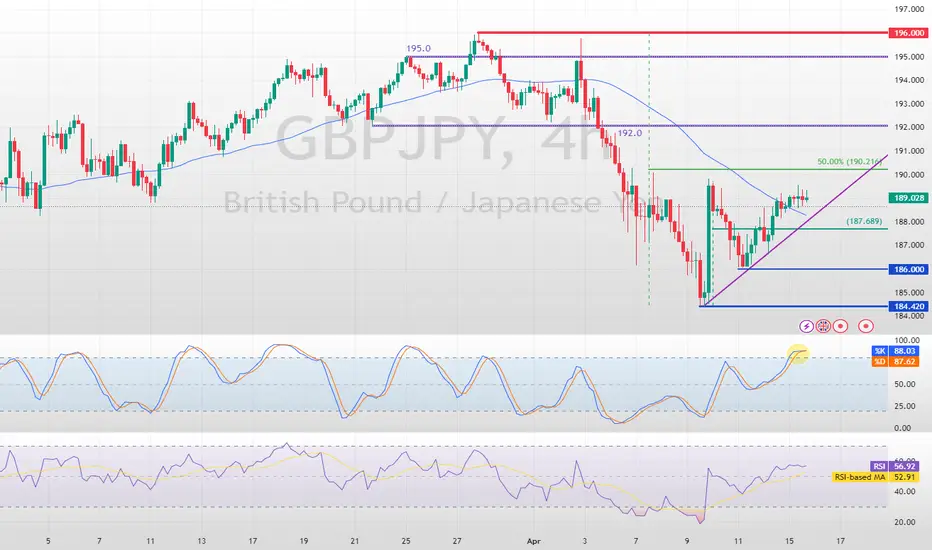
GBP/JPY Awaits a Bearish BreakoutFenzoFx—GBP/JPY trades slightly above the 50-period SMA at 188.4, but the trend remains bearish below the 50.0% Fibonacci resistance level. The Stochastic Oscillator signals an overbought state, suggesting short-term pressure.
A downtrend may resume if GBP/JPY closes below 187.6, targeting 186.0. Conversely, a break above 190.2 resistance could extend momentum to 192.0.
>>> No Deposit Bonus
>>> %100 Deposit Bonus
>>> Forex Analysis Contest
All at F enzo F x Decentralized Forex Broker
GBP/JPY Structure Analysis (H4)Let’s break this GBP/JPY chart down and walk through it step by step, based on price action and structure. 👇
🧠 1. Current Structure Analysis (H4)
• Support zone (blue box): Very clean and respected. You’ve marked that demand zone well—from around 185.20 to 186.50, and price has already reacted multiple times.
• Rejection wicks: Recent candles show strong wicks rejecting from that zone—classic accumulation behavior.
• Double bottom / fakeout: There’s also a fakeout below the zone that immediately got bought back up. That’s a bullish signal—liquidity sweep followed by aggressive buying.
🔍 2. What’s Happening Now?
• Price bounced from demand and is now retesting that breakout region around 188.00.
• But we’re not seeing a higher high yet, just some consolidation.
✅ Is There a Buy Entry?
Yes—but not right this second. You want to wait for confirmation, unless you’re playing a deep swing from the bottom.
🔹 Buy Scenarios:
1. Safer Buy:
• Wait for a bullish break above 188.80–189.00, then catch the retest of that broken resistance.
• That’s your confirmation of a shift in structure.
2. Aggressive Buy (if you’re a sniper):
• You can buy on a retest of 186.80–187.00, only if:
• Price prints a bullish engulfing or strong rejection candle there.
• RSI divergence or volume spike confirms strength.
🎯 Targets:
• First: 189.20
• Second: 191.20 (previous structure highs)
• Stop loss: below 185.00
❌ Is There a Sell Entry?
Right now, selling is riskier because:
• You’re in a bullish reaction zone.
• Bears had their chance with the drop, but bulls defended the zone hard.
Only consider selling if price fails at 188.80–189.00 with strong bearish rejections and returns back inside the range. Then it might target 186.50 again.
✍️ My Take
No rush. Let the structure guide you. If we break 188.80 cleanly, I’m buying the retest.
Your zone is gold. Let price come to you.

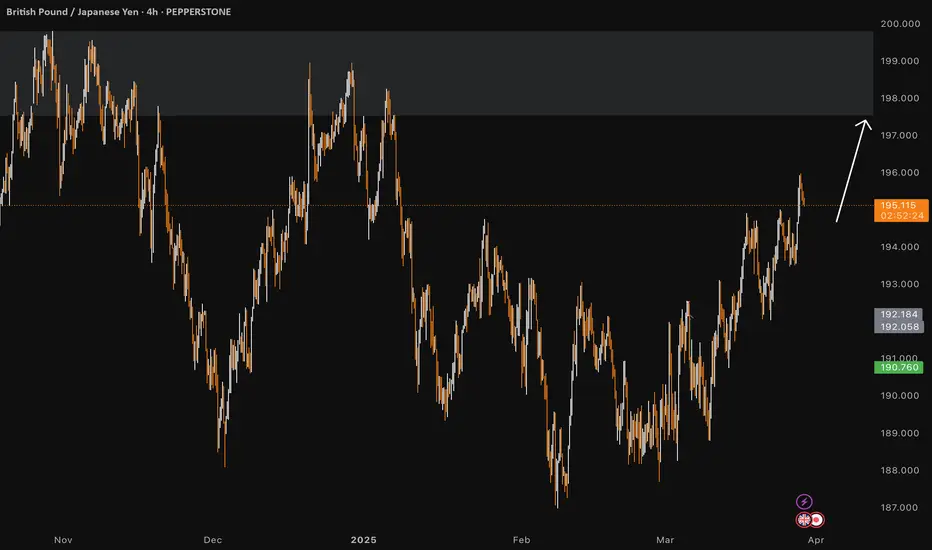
GBP/JPY testing critical zoneThe GBP/JPY is testing a critical resistance area between 189.20 to 190.00. For as long as this area holds as resistance, the path of least resistance remains to the downside.
Should the selling resume from here, we could see the Guppy trade down to test the key support range between 185.00 to 186.00 again.
However, if the GBP/JPY breaks decisively above the 189.20 to 190.00 range, then that could potentially pave the way for a short-squeeze rally towards the next major resistance in the 193.00 to 194.20 range, where we also have the 200 day MA converging.
By Fawad Razaqzada, market analyst with FOREX.com

GBPJPY Buy Continuation | OB + Trendline ConfluenceIdea:
After a strong bullish rally earlier this week, GBPJPY has now pulled back to a key ascending trendline, which has acted as dynamic support over time. This retest is signaling a potential continuation of the bullish momentum.
Zooming into the lower timeframe (1-minute), a strong Order Block (OB) has formed right at the intersection of the trendline support, offering high confluence for a long setup. This OB also aligns perfectly with the 4H trendline, adding more weight to the bias.
Confluences supporting the bullish continuation:
Retest of the 4H ascending trendline (higher timeframe support)
Fresh 1-minute bullish Order Block at the zone
Price showing signs of reaction/rejection at the OB zone
Bullish market structure still intact
No major resistance until previous swing high
Entry Idea:
Monitor price reaction within the OB zone (1-minute) for confirmation (e.g., bullish engulfing, BOS on LTF). A clean break and retest within this zone can trigger a low-risk, high-reward long position.
Short-Term Target: Previous intraday high
Mid-Term Target: Next key resistance level or supply zone
Invalidation: Clean break below the 4H trendline and OB zone

Wed 16th Apr 2025 GBP/JPY Daily Forex Chart Buy SetupGood morning fellow traders. On my Daily Forex charts using the High Probability & Divergence trading methods from my books, I have identified a new trade setup this morning. As usual, you can read my notes on the chart for my thoughts on this setup. The trade being a GBP/JPY Buy. Enjoy the day all. Cheers. Jim

GBPJPY Sell Trade Analysis & Position SizingGBPJPY Sell Trade Analysis & Position Sizing*
*1. Trade Overview:*
- *Entry:* 191.050
- *Stop Loss (SL):* 191.800 (55 pips above entry)
- *Take Profit Targets:*
- *TP1:* 188.850 (180 pips)
- *TP2:* 187.250 (340 pips)
*2. Risk-Reward Ratios:*
- *TP1:* 180 pips / 55 pips = *3.27:1* (strong).
- *TP2:* 340 pips / 55 pips = *6.18:1* (very aggressive).
*3. Key Levels & Context:*
- *SL Placement:* Above the recent high (191.20), invalidating the bearish setup if breached.
- *TP Logic:* TP1 and TP2 likely align with historical support levels or Fibonacci retracement zones.
*4. Position Sizing Example:*
Assume you risk *1% of a $10,000 account* ($100):
- *Pip Value (approx):* $6.56 per standard lot (GBPJPY at 190.65, GBPUSD at 1.25).
- *Risk per Trade:* $100 = (55 pips × $6.56 × Lots).
- *Lots Size:* $100 / (55 × $6.56) ≈ *0.28 lots* (28,000 units).
*5. Execution Tips:*
- *Partial Profit-Taking:* Close 50-70% at TP1, trail SL to breakeven.
- *Fundamental Watch:* Monitor BoJ interventions, UK data, or risk sentiment shifts (JPY is a safe haven).
*6. Visual Guide:*
- Price rejected at 191.20 resistance.
- Entry at 190.650, SL above the high.
- TP1 near a swing low (188.85), TP2 at a stronger support (187.25).
*Need a position size calculator or further chart details? Let me know!* 📉💡

Is GBPJPY Set to Rise?GBPJPY has been catching attention this week—and for good reason. With price action pushing toward significant psychological zones, traders are asking: is the Dragon set to breathe fire once again?
Here’s the setup I’m watching closely:
Entry: 188.813
Stop Loss: 186.814
Target: 195.170
This trade idea is built on strong bullish structure and confluence across the higher timeframes. Price has respected key support zones and appears to be forming a base for a potential breakout. If momentum holds, we could see GBPJPY retest and possibly surpass recent highs.
What makes this setup compelling isn’t just the technicals—it’s also the fundamentals. With the Bank of Japan sticking to ultra-dovish policy and the UK showing relative economic resilience, the interest rate differential continues to favor GBP strength.
What do you see on your chart? Would you take this trade—or sit on the sidelines? Drop your bias in the comments.

GBPJPY Discretionary Analysis: Aiming for the Sky I’m not entirely sure, but my gut says it’ll go up. If not, I lose some money and my gut clearly needs more back testing. Profit if I’m right, lesson if I’m wrong! 👌
Just my opinion, not financial advice.
GBPJPY Bullish Continuation Case StudyTo share the GBPJPY case study, where I only took +1RR from +2RR possible return.
Reason:
1. Price moved from downtrend to uptrend
2. Demand with huge bullish candle after it (imbalance above demand) not yet re-test
3. Multiple supports above demand zone
4. Price tapped to demand zone, looks aggressive but demand was strong enough to hold and price bounces from it
This is textbook setup, targeting 2RR from this setup is achievable. Please do not trust me! I do not have big capital to support my statement.
One thing is certain is that, if you trade one setup or strategy, and collect data and watch how it work, you can achieve a profitable trading journey.

GBPJPY LONG FORECAST Q2 W16 D16 Y25GBPJPY LONG FORECAST Q2 W16 D16 Y25
Key- to await price to show its play.
The longer term retrace is of course the set that FRGNT would potentially call an A - set up, higher time frame order block long, lower time frame breaks, you know the drill. BUT what if price action does not match your forecast. We must adapt if the position makes sense.
Let's see if GBP has the legs to break 15' structure in London.
We are interested.
One thing is for sure, GJ moves and we endeavour to be part of those dances!
-15' break of structure first prior immediate long.
Trade well!
FRGNT X

GBP/JPY Long 16/04Price formed inverse head and shoulders pattern on 4hr tf. Previous days have been bullish. Broke above 4hr resistance. Currently testing the support and anticipating a bullish move higher toward 190.000

GJ BULLISH?GBPJPY is getting ready for a bull run. 4hr timefram has already given us a shift in market structure. Now watch price on lower timeframes to get your entry

Trading balanceTrading balance The price of the asset has rebounded from the balance zone. With the prospect of growth into the resistance zone.
GBPJPY BUY NOW!!!!!!!!GBPJPY completed +170pips from my yesterdays analysis today we have price made a strong rejections off the sell side liquidity we are still on a buy to fill the target on the falling wedge breakouts remember
JOIN AND ENJOY

GJ-Tue-15/04/25 TDA-Tight tp scalps ahead of tomorrow's GBP CPIAnalysis done directly on the chart
Timing is crucial. Good trade ideas, but if
timing is not right, you can get stopped out
before price hits your tp.
Not financial advice, DYOR.
Market Flow Strategy
Mister Y

A sell on GBPJPY From 188.716 Price will drop form 188.716 to 187.829 on the GBPJPY .... This will make a remarkable correction for the GBP for a continuation pattern for the bulls to step in...

LONG THEN SHORTRisk Management
Proper risk management is at the core of this trade idea. I’m risking no more than 1-2% of account capital on this position to protect against outsized losses. The stop-loss is strategically placed based on recent support/resistance levels and market structure—not just arbitrary percentages. This allows room for normal market volatility without compromising capital unnecessarily.
Position sizing is calculated to align with this risk threshold. If the trade moves against the setup and hits the stop, the loss is controlled and acceptable within my overall trading plan.
As always, no single trade is worth overexposing your portfolio, so I recommend adjusting position size based on your personal risk tolerance and account size. Stick to your plan, protect your capital, and trade smart.

GBPJPY:SIGNALHello dears
Considering the heavy decline we had, you can see that buyers entered with a strong bullish spike, which is a good sign...
Now we can buy in steps on the price pullback and move with it to the specified targets, of course with capital and risk management.
*Trade safely with us*

GBP JPY SHORTWAITING FOR A BOS CONFIRMATION ON LOWER TIME FRAME
📉 GBP/JPY SHORT SETUP 🔥
Smart Money Confluences Lined Up
🔍 Key Confluences:
✅ Premium Supply Zone
Price is reacting to a 2H Order Block + 1H Fair Value Gap — a stacked area of supply where institutions typically sell from.
✅ Liquidity Sweep Confirmed
Price swept above recent highs before entering the OB. Classic stop hunt / inducement move before a potential reversal.
✅ Bearish Rejection Forming
Price is stalling in the OB. Watching for a bearish engulfing or break of structure on 15M/1H for entry confirmation.
🎯 Target Zones:
🟦 TP1: 4H Fair Value Gap — ideal for partials
📉 TP2: Structure support zone
🟩 TP3: Equal lows/liquidity pool — full target
📊 Bias: Bearish
⏱ Timeframes: 1H / 2H / 4H
🔐 Risk: Above OB EQ (0.5)
