GBPJPY BUY NOW!!!!!!!!!GBPJPY took out the buyside liquidity with a retest price have already made a retest we have price today made a spike down to sweep liquidity and now heading back up am in again on buy holding to see price create new highs
JOIN AND ENJOY
GBPJPY.100.CSM trade ideas

GBPJPYdaily swing is bearish.
Daily fractal is bearish as well.
fractals now after grabbing liquidity shifted to bearish in 2hr.
currenlty price is at supply in 2hr .
entered in trade and let's see...

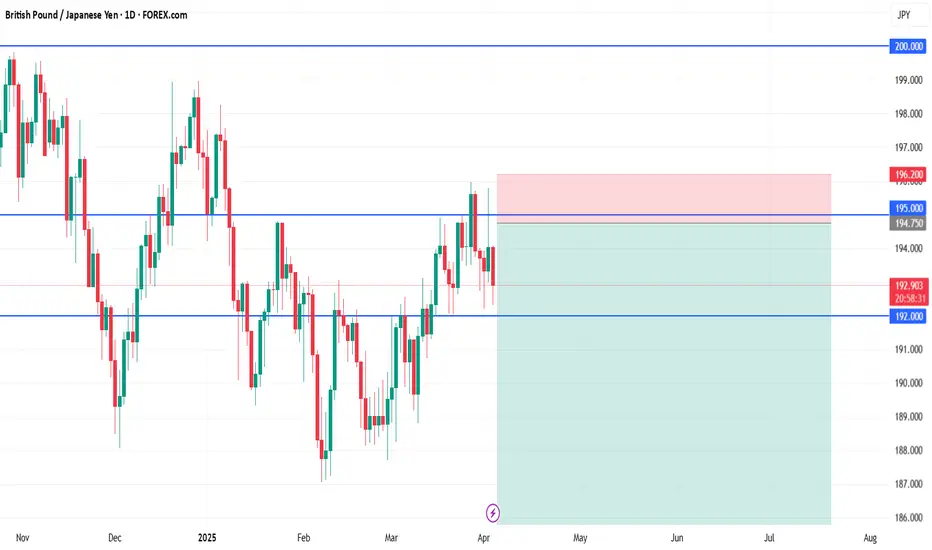
GBP/JPY short🧩 GBP/JPY Swing Short Setup
📍 Entry:
Sell Limit: 194.75
🛡️ Stop Loss (Above Resistance Wick):
SL: 196.20
→ Covers minor breakout/fakeout above 195 zone while protecting against invalidation
🎯 Take Profits:
TP1: 190.00
(Structure floor + first major reaction zone)
TP2: 185.00
(Clean horizontal support and demand zone)
TP3 (Swing Target): 180.00
(Large macro target — monthly structure retest)
🧠 Rationale Recap:
Price is consolidating just under multi-year resistance (195–200)
Fundamentals align: GBP weakening, JPY strengthening in risk-off environment
Strong R:R, clean rejection zone, and macro pressure potential
gbpjpy buy setupentry : 187,054
stop loss : 185,650
take profit : 194,747
I'll appreciate the boost!

NEXT WEEK GBPJPY ANALYSIS SIGNAL UPDATE > GO AND READ THECAPTAINBaddy dears friends ✅
(GPBJPY) trading signals technical analysis satup👇🏼
I think now (GBPJPY) ready for( SELL )trade ( GBPJPY ) SELL zone
( TRADE SATUP) 👇🏼
ENTRY POINT (191.300) to (191.200) 📊
FIRST TP (190.900)📊
2ND TARGET (190.400) 📊
LAST TARGET (189.800) 📊
STOP LOOS (190.800)❌
Tachincal analysis satup
Fallow risk management

GBPJPY Trading Strategy | Follow Liquidity Breakouts and Seize EOver the past two months, GBPJPY has consistently broken through two key liquidity zones before continuing along its main direction.
For example, after the upward channel breaks the liquidity at points 1 and 2, the price retraces and then continues in the main direction. When the price breaks through liquidity at points 3 and 4, the market goes into another liquidity accumulation phase.
🔑 Based on this logic:
This time, the price is rising to the SELLER IMB zone, which is a liquidity accumulation area. When the price breaks and then retraces again, that's our entry point.
We can go short at this level and wait for the price to retrace further towards the low liquidity point 8.
🎯 Precise Entry:
To optimize the risk-to-reward ratio, we will use a smaller time frame for entry, allowing us to capture the pullback more precisely.
💡 The market is like a butterfly—light and difficult to catch. But as long as you have a clear plan and base your trades on sound logic, every trade will progress steadily. No matter how the market moves, you will be able to seize every opportunity.
If you want to learn how to apply logic and strategy in the market to improve your consistency, feel free to join the APL Learning Community, and let's take the path to successful trading together! 🚀

GJ Potential to the Upside On the daily chart GJ is is in a overall downtrend and we have seen the formation of the lower low formed i am targetting the possible next Lower High i will be entering based on Buystop order with small volume once trade starts to play out will enter with larger postion size
also noted Sl is quite large for now with volume size as we know this pair has quite a large range it can play before moving

GBPJPY Massive Short! SELL!
My dear friends,
Please, find my technical outlook for GBPJPY below:
The instrument tests an important psychological level 191.57
Bias - Bearish
Technical Indicators: Supper Trend gives a precise Bearish signal, while Pivot Point HL predicts price changes and potential reversals in the market.
Target - 189.14
Recommended Stop Loss - 192.84
About Used Indicators:
Super-trend indicator is more useful in trending markets where there are clear uptrends and downtrends in price.
Disclosure: I am part of Trade Nation's Influencer program and receive a monthly fee for using their TradingView charts in my analysis.
———————————
WISH YOU ALL LUCK

GBP/JPY TRADE ALERT!
GBP/JPY TRADE ALERT!
Potential Trend Reversal Ahead!
Current External Trend: BULLISH
Do you agree with our Daily Time Frame Forecast?
Market has given a CIDS (Candlestick Inside Day Setup), we'll enter after retesting CIDS.
Get ready to trade!
Potential Trend Reversal Ahead!
Current External Trend: BULLISH
Do you agree with our Daily Time Frame Forecast?
Market has given a CIDS (Candlestick Inside Day Setup), we'll enter after retesting CIDS.
Get ready to trade!

GBPJPY...SHORT OANDA:GBPJPY
This is a technical scenario, not a guaranteed prediction. The zone is becoming a key area of interest. No confirmation, no trade.
If confirmed breakout and retest occur, I’ll look to trade in alignment with the new structure.

CHECK GBPJPY ANALYSIS SIGNAL UPDATE > GO AND READ THE CAPTAINBaddy dears friends ✅
(GPBJPY) trading signals technical analysis satup👇🏼
I think now (GBPJPY) ready for( BUY )trade ( GBPJPY ) BUY zone
( TRADE SATUP) 👇🏼
ENTRY POINT (190.900) to (190.850) 📊
FIRST TP (191.150)📊
2ND TARGET (191.500) 📊
LAST TARGET (191.800) 📊
STOP LOOS (190.400)❌
Tachincal analysis satup
Fallow risk management

CHECK GBPJPY ANALYSIS SIGNAL UPDATE > GO AND READ THE CAPTAINEntry Zone: Around 190.900✅
Stop Loss: 190.550❌
Take Profit 1: Around 191.300✅
Take Profit 2: Around 191.500✅
Last Target: Around 192.000✅
TECHNICALLY ANALYSIS SATUP ✅
FALLOW RISK MANAGEMENT ✅

possibility of correctionIf the price breaks the resistance range and consolidates above this range, the upward trend will likely continue.
Otherwise, a downward trend to the specified support levels will be possible.

GJ-Fri-25/04/25 TDA-Great pump, patience paid off!Analysis done directly on the chart
Treat trading as business. We all start from
losing money (I like to think it as a tuition fees),
but if in exchange you'll earn the skill, the experience,
will likely to pay off in the long term. Same as if you
want to study to become doctor, engineer or whatever.
From somewhere we have to start, nothing is gained
miraculously.
Not financial advice, DYOR.
Market Flow Strategy
Mister Y

GBPJPY on the Launchpad – Retrace Before the Blast?
Description:
GBPJPY has broken structure and is respecting the ascending trendline with strong bullish momentum. Price is currently pushing higher but may retest the demand zone around 189.800 – 190.100 before launching toward the 195.000+ supply area.
Volume profile shows heavy accumulation below, adding confluence to the potential bullish continuation.
Trade Idea:
Entry: On a pullback to the green demand zone
SL: Below 189.500
TP: 195.000+
Bias: Bullish continuation following trendline support + demand reaction
Eyes on the retest — buying the dip could be golden.

GBPJPY: Break, Retest, Boom ?Eyes on GBPJPY, Bulls Loading Up?
Price is respecting a clear ascending trendline on the 4H timeframe. After breaking through a minor Resistance Level, it looks set to pull back for a retest before continuing higher. The next target lies in the higher supply zone around the 192.500 193.000 area. As long as the trendline holds, the bullish bias remains intact.
⚠️ Not a financial advice
#GBPJPY #Forex #PriceAction #SmartMoney #TrendlineTrading #SupplyAndDemand #TechnicalAnalysis #BullishSetup #SwingTrading #MarketStructure

GBPJPY LONGThis is a follow up on the long bias I had posted yesterday. It is panning out nicely.
The BUY DIPS is confirmed.
Next significant level is 195.

GBP/JPY Hourly Analysis & Scalping Perspective 10:30pm 4/24Looking at the GBP/JPY 1-hour chart, I see price currently hovering around 190.164, showing mild bullish momentum but still respecting key resistance levels. Here’s my breakdown:
Market Structure & Key Zones:
Price has been bouncing between 190.00 and 190.40, suggesting a short-term consolidation phase.
190.30-190.40 is acting as a liquidity zone—if buyers can push through this level, we could see upside toward 190.60-190.75.
On the flip side, 190.00 remains a psychological support level, and a break below it could lead to a sweep toward 189.70-189.50, where previous demand has existed.
Momentum Indicators:
RSI (1-hour): 45.09 → Momentum is neutral, meaning price isn’t aggressively overbought or oversold.
CCI (1-hour): 81.05 → Mild bullish strength, but nothing parabolic yet.
Stochastic RSI (1-hour): 100.0 → This is overbought, which signals a possible pullback before further upside.
Directional Strength:
ADX (1-hour): 13.28 → Weak trend strength, confirming the possibility of range-bound movement.
DX (1-hour): 3.67 → Not an explosive directional move yet, meaning a breakout needs confirmation.
Scalping Plan:
Bullish Play: If price breaks 190.40, my next upside targets are 190.60-190.75.
Bearish Play: A rejection from 190.30-190.40 could drive price back toward 190.00 or lower.
Liquidity Grab Scenario: If price sweeps below 190.00, institutional absorption might trigger a strong reversal, making 189.70-189.50 a potential buying zone.
At this point, I’m watching price action closely—especially around 190.30—for signs of buyer exhaustion or a sudden momentum shift. Would I enter a trade right now? Not just yet. I’d want further confirmation, possibly volume profile analysis, to see if institutions are positioned for continuation or a reversal.

GBPJPY buy set upHere's a look at a potential long entry on the GBP/JPY 30-minute chart. Price should react to some unmitigated price levels at 189.145 - 188.918. Let's see how it plays out.
#TradingSetup #PriceAction #GBPJPYtrading

GBP/JPY For Bearish as pull-Backyou can go short now
or
wait for pull-back near by entry point and go short
general trend is up trend
current phase is pull-back
have fun :)

CHECK GBPJPY ANALYSIS SIGNAL UPDATE > GO AND READ THE CAPTAINBaddy dears friends ✅
(GPBJPY) trading signals technical analysis satup👇🏼
I think now (GBPJPY) ready for( SELL )trade ( GBPJPY ) SELL zone
( TRADE SATUP) 👇🏼
ENTRY POINT (189.700) to (189.600) 📊
FIRST TP (189.200)📊
2ND TARGET (188.700) 📊
LAST TARGET (188.300) 📊
STOP LOOS (190.200)❌
Tachincal analysis satup
Fallow risk management

GBPJPY 24.04.2025+Seasonality (until the end of April)
+COT
~- Latest bad UK PMIs (although JP CPI Miss as well)

GJ-Thu-24/04/25 TDA-Potential GJ buy!Analysis done directly on the chart
If you want to scalp, at least for me just
stick to one or max two pairs. You get familiar
with the pair, understanding its moves and
focusing on qualitative trades than quantitative.
Not financial advice, DYOR.
Market Flow Strategy
Mister Y
