GJ-Fri-18/04/25 TDA-GJ testing your patience, watch out!Analysis done directly on the chart
Don't force trade in the middle of range,
in a bad market position. It's way to harder
to manage and most of the time price will
just take up and down liquidity.
Yes, you might get lucky to get some wins
But can you be consistently good at taking
wins or was it just luck? What do you think?
Keep it simple!
Not financial advice, DYOR.
Market Flow Strategy
Mister Y
GBPJPY.100.CSM trade ideas

Pound-yen consolidates above ¥187The latest British job report on 15 April was generally quite positive with growth in earnings remaining high and claimants increasing less than expected. The focus for the yen remains on upcoming trade talks between Japan and the USA while monetary policy still seems somewhat uncertain. The Bank of Japan is likely to continue with ‘wait and see’ although some participants expect a hike in September.
¥186 seems to be the main short-term support based on the fairly strong reaction on 9 April. However, that hasn’t been clearly sustained since then although that day’s upward engulfing candlestick would have suggested possible ongoing gains. Japanese balance of trade late on 16 April GMT is unlikely to have a significant influence on the chart unless it’s particularly surprising. The 20 and 50 SMAs just below ¥191 probably mean resistance in that area. Upcoming British data like PMIs and retail sales could usher in a clearer direction.
This is my personal opinion, not the opinion of Exness. This is not a recommendation to trade.

GJ-Wed-16/04/25 TDA-Messy zone, wide range. Be patient with GJ!!Analysis done directly on the chart
Even after the fiercest storm, life finds a way to bloom again.
If you know, you know. (IYKYK)
Not financial advice, DYOR.
Market Flow Strategy
Mister Y

Golden Pattern Alert! Inverse Head & Shoulders Spotted on GBP/JPHi traders! Analyzing GBP/JPY on the 1H timeframe, price is showing signs of a potential bullish reversal with the formation of an Inverse Head and Shoulders pattern:
🔹 Entry: 189.25
🔹 Take Profit (TP): 190.85
🔹 Stop Loss (SL): 188.25
After a strong downtrend, price formed an inverse H&S pattern with the right shoulder completing near the ascending trendline support. A breakout above the neckline around the 189.20 level confirms bullish intent, with momentum supported by a close above both the neckline and the 200 EMA.
RSI is also turning up, showing strengthening bullish momentum. The breakout candle is clean, with volume picking up slightly adding confidence to the setup.
If the pattern plays out fully, the projected target aligns with the upper boundary of the ascending channel around 190.85, which also acts as a confluence zone from previous structure.
⚠️ DISCLAIMER: This is not financial advice. Every trader is responsible for managing their own risk and strategy.

GJ shortmarket way too choppy, likely not able to break previous highs unless some news, i'll look for first 15m rejection, then looking to short it to tp, i may sell early, or if some random news pops out, i'll close it, likely i'll trail on every 1hr resistance candles or 15m resistance.

GBP/JPY - Long Term SellHere in this chart starting in the higher TF we can notice lots of selling pressure. Every time price hit this key level we can notice a significant sell off.
From previous new in the past few weeks we can notice a strong Supply zone to look to sell from. This supply zone has a clean Mitigation Block within it.
If we sell this Supply zone it will be a strong possibility that we break out of this parallel channel giving us a break out.
Dropping down into the 6H we can notice a first target being the sell side liquidity. Im targeting here as the demand zone has been invalidated from this previous price movement giving me good conditions to sell into
Please do feel free to follow me or dm me about this read

GBP-JPY DAILY ANALYSIS 14/04/2025GBP-JPY Is still Moring in the up triangle and expected to break it and visit the levels of 190.00, but breaking 187.40 will takes us again to lower levels,,, good luck for all traders

GBP-JPY DAILY UPDATE 14/04/2025 GBP-JPY Is still Moring in the up triangle and expected to break it and visit the levels of 190.00, but breaking 187.40 will takes us again to lower levels,,, good luck for all traders

GJ respecting zones and fibonacci After recent drop due to fundamental news. GJ touched daily demand zone and. currently respecting fibonacci retracement.
Any thoughts please comment.

Bullish flag:A Classic bullish reversal flag on the weekly.
✅ Risk Entry Zone :
Price has just wicked below support and rejected hard near 183.725, signaling a potential 1,2,3 pattern
A Bullish engulfing daily candle confirms a solid longS entry.

Buy GBPJPYBuy GBPJPY and exploit this bullish flag pattern. This is the last trade of the day, may we close the day well. I am targeting 190.00 and above


Limit GJ 1h fractal entryLimit GJ 1h fractal entry - i will show my friend what i have for today what for trades i am gonna get.

GJ-Mon-14/04/25 TDA-GJ wide consolidation now!Analysis done directly on the chart
The market is testing your patience today,
don't let it fool you. With this price action
and market positioning and structure it's not
very good to scalp either!
Not financial advice, DYOR.
Market Flow Strategy
Mister Y

GBPJPYMonthly Key Level 205 rejected, with a weekly candle.
What's gonna allow the price to take out the 180 KEY Level, but it will take time.
Be patient

GBP/JPY Trade SetupTechnical Breakdown (4H chart):
Price action is currently consolidating between two key zones following a strong bullish move. We're now watching for a breakout from this wedge pattern.
🔴 Downtrend line acting as resistance.
🟢 Uptrend line forming a rising wedge.
🔵 Key Levels:
Buys Above: 187.346 – Bullish breakout potential if price breaks above this resistance with strong volume.
Sells Below: 186.106 – Bearish continuation likely if price closes below this support zone.
Trade Idea:
Buy Scenario: If price breaks and holds above 187.346, I'm looking for long opportunities targeting the 189.50 region in line with the green ascending trendline.
Sell Scenario: If price rejects the resistance and breaks below 186.106, I’ll look for short setups toward 184.78 or lower.

GBPJPY Channel Down bottom reached. Rebound expected.Last time we looked into the GBPJPY pair (March 20, see chart below) we had a sell signal which dully delivered our 188.550 Target:
This time we have the price at the bottom (Lower Lows trend-line) of the extended Channel Down, with the 1D RSI almost reaching the 30.00 oversold limit. All such bottoms were followed by a rebound that hit at least the 1D MA50 (blue trend-line) before a new Channel Down Lower Low.
As a result, we are going for a short-term buy here, targeting a potential contact with the 1D MA50 at 190.250.
-------------------------------------------------------------------------------
** Please LIKE 👍, FOLLOW ✅, SHARE 🙌 and COMMENT ✍ if you enjoy this idea! Also share your ideas and charts in the comments section below! This is best way to keep it relevant, support us, keep the content here free and allow the idea to reach as many people as possible. **
-------------------------------------------------------------------------------
Disclosure: I am part of Trade Nation's Influencer program and receive a monthly fee for using their TradingView charts in my analysis.
💸💸💸💸💸💸
👇 👇 👇 👇 👇 👇

GBPJPY BUY NOW!!!!!!!GBPJPY formed a bullish pennant and price have already made a retest off the previous lower highs and already made a strong rejections am in on buy holding till price gets to 195.000

check the trendIt is expected that the upward trend will form up to the specified resistance levels. Then, considering the price behavior in this range, possible scenarios have been identified.

GJ-Fri-11/04/25 TDA-HTF tp tapped, no clear direction atmAnalysis done directly on the chart
One step at a time, consistency, patience.
Create a solid foundation if you want things to
last longer. Shortcuts will not be useful long
term. The sooner you realize it, the better it is.
Not financial advice, DYOR.
Market Flow Strategy
Mister Y

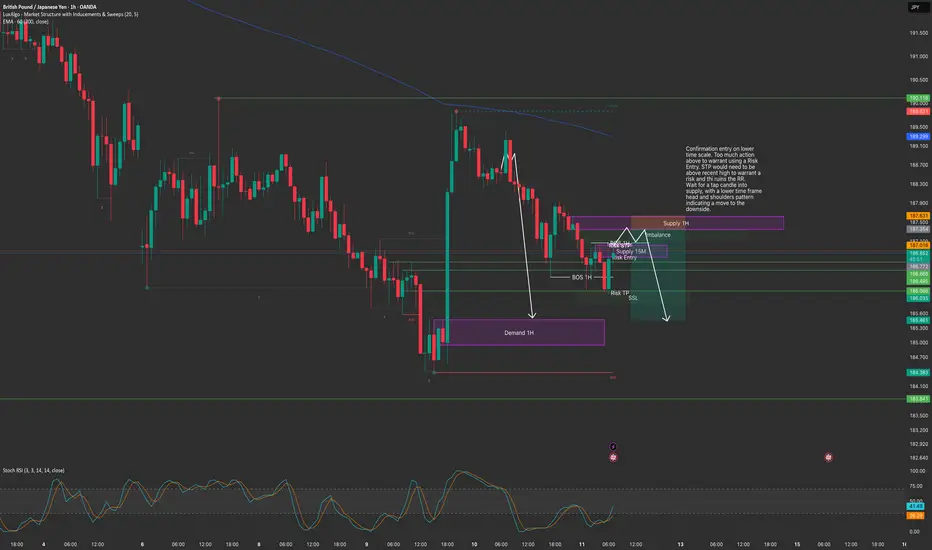
SHORT GBPJPY from 1H supplyThere was a risk entry on the 15M chart which may yet play out but if it breaks to the upside I expect it to return to the 1H supply zone marked ready to take out the remaining imbalance below with the news candle from Weds evening.
We're still in a downtrend but I suspect with the news of tariffs being paused for the next 90 days there may be a rally, would only confirm an uptrend once its broken that upward move from the weds evening.
GBP/JPY 1H/4H H&SI think words are not needed here. Closed fvg gap so have potential to go up. H&S formed. Rejection from exactly from previous shoulder so I see potential for it to go and collect 4H fvgs left on top.
Entry 186.1
SL 184.8
TP 190.0

GBP/JPY M30 Analysis – Potential Short SetupThe GBP/JPY pair on the M30 timeframe is showing a potential selling opportunity, following a triangle breakout pattern. This pattern indicates a possible shift in momentum towards the downside in the coming hours.
Possible Short Trade Idea:
Entry: Look for short entries around the trendline of the breakout pattern.
Target Levels:
1st Support: 184.40 TARGET 1
2nd Support: 182.60 TARGET 2 PLease hit the like button leave a comment to support for my post
Your likes and comments are incredibly motivating and will encourage me to share more analysis with you.
If you found this analysis helpful, please hit the like button and leave a comment to show your support!
Your engagement motivates me to continue sharing more valuable insights.
Best Regards,
James_gold_MASTER_MQL5
Thank you!
