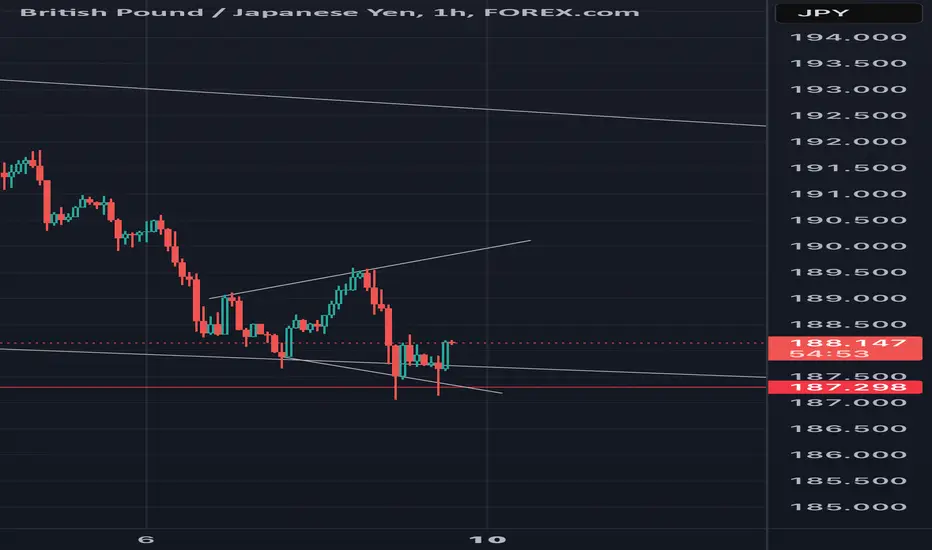
GBPJPY MONDAY TRADE SIGNAL📊 GBP/JPY 30-Minute Chart Analysis
🔹 Current Trend: The market has been in a strong downtrend, respecting the 20-period WMA (Weighted Moving Average) as dynamic resistance.
🔹 Key Levels:
✅ Support Zone: 187.500 - 187.334 (Marked in Green)
✅ Resistance Zones: 188.414 & 190.021 - 190.313 (Marked in Red)
🔹 Trade Setup:
📈 Possible Buy Opportunity:
Price is holding at a key support zone, showing potential for a short-term retracement towards the resistance level at 188.414 or even 190.021 before continuing lower.
A break & retest of the small resistance zone (marked in brown) could confirm a bullish move.
📉 Overall Bearish Bias:
If price reaches the higher resistance zone (190.021 - 190.313), it may create a strong selling opportunity.
A rejection from resistance could trigger a continuation of the downtrend, targeting new lows below 187.000.
🔹 Trading Plan:
Short-term traders can look for buy scalps towards resistance.
Swing traders should wait for a liquidity grab near resistance before entering a sell position targeting 186.500.
📌 Watch for confirmations like:
✅ Bullish rejection candles at support
✅ Break & retest of the marked zones
✅ Price action signals at resistance
⚡ What’s your bias on GBP/JPY? Bullish or Bearish? Drop your thoughts in the comments! ⬇️🔥
#GBPJPY #ForexTrading #MarketAnalysis #PriceAction #TradeSetup
GBPJPY trade ideas

gbpjpyhello everyone, the price drop today further down with ism news, the price is currently at the support, the price may reverse from current or the main support level... wait for BOS regardless whenever it reverse for best results.. this is swing trade setup not scalp or intraday... good luck

GBP/JPY "The Guppy" Forex Market Bullish Heist Plan🌟Hi! Hola! Ola! Bonjour! Hallo!🌟
Dear Money Makers & Thieves, 🤑 💰🐱👤
Based on 🔥Thief Trading style technical and fundamental analysis🔥, here is our master plan to heist the GBP/JPY "The Guppy" Forex market. Please adhere to the strategy I've outlined in the chart, which emphasizes long entry. Our aim is the high-risk Red Zone. Risky level, overbought market, consolidation, trend reversal, trap at the level where traders and bearish robbers are stronger. 🏆💸Be wealthy and safe trade.💪🏆🎉
Entry 📈 : "The heist is on! Wait for the breakout (193.400) then make your move - Bullish profits await!"
however I advise placing Buy limit orders within a 15 or 30 minute timeframe. Entry from the most recent or closest low or high level should be in retest.
Stop Loss 🛑: Thief SL placed at 191.600 (swing Trade) Using the 2H period, the recent / nearest low level.
SL is based on your risk of the trade, lot size and how many multiple orders you have to take.
Target 🎯: 199.000 (or) Escape Before the Target
Scalpers, take note 👀 : only scalp on the Long side. If you have a lot of money, you can go straight away; if not, you can join swing traders and carry out the robbery plan. Use trailing SL to safeguard your money 💰.
📰🗞️Fundamental, Macro, COT, Sentimental Outlook:
GBP/JPY "The Guppy" Forex Market market is currently experiencing a bullish trend,., driven by several key factors.
🎆 Fundamental Analysis
1. Economic Growth: The UK's economic growth is expected to slow down due to Brexit uncertainty, while Japan's economy is expected to grow at a moderate pace.
2. Inflation: The UK's inflation rate is expected to remain above the Bank of England's target, while Japan's inflation rate is expected to remain low.
3. Interest Rates: The Bank of England is expected to keep interest rates steady, while the Bank of Japan is expected to maintain its accommodative monetary policy.
🎆 Macroeconomic Analysis
1. Trade Balance: The UK's trade balance is expected to remain in deficit, while Japan's trade balance is expected to remain in surplus.
2. GDP Growth: The UK's GDP growth rate is expected to slow down to 1.2% in 2023, while Japan's GDP growth rate is expected to remain at 1.1%.
3. Fiscal Policy: The UK's fiscal policy is expected to remain expansionary, while Japan's fiscal policy is expected to remain neutral.
🎆 COT Analysis
1. Non-Commercial Traders: Net long 20,019 contracts (increase of 5,011 contracts from last week)
2. Commercial Traders: Net short 15,011 contracts (decrease of 2,011 contracts from last week)
3. Non-Reportable Positions: Net long 8,011 contracts (increase of 1,011 contracts from last week)
🎆 Sentimental Analysis
1. Trader Sentiment: 52% of traders are bullish on GBP/JPY, while 40% are bearish and 8% are neutral.
2. Investor Sentiment: The GBP/JPY sentiment index shows that 48% of investors are bullish, while 32% are bearish.
3. Hedge Fund Sentiment: Hedge funds have increased their long positions in GBP/JPY, with a net long exposure of 15%.
🎆 Institutional Trader Sentiment
1. Goldman Sachs: Net long 12,011 contracts
2. Morgan Stanley: Net long 8,011 contracts
3. JPMorgan Chase: Net long 6,011 contracts
🎆 Hedge Fund Sentiment
1. Bridgewater Associates: Net long 15,011 contracts
2. BlackRock: Net long 10,011 contracts
3. Vanguard: Net long 8,011 contracts
🎆 Retail Trader Sentiment
1. Interactive Brokers: Net long 6,011 contracts
2. TD Ameritrade: Net long 4,011 contracts
3. E*TRADE: Net long 3,011 contracts
🎆 Overall Outlook
Based on the analysis, GBP/JPY is expected to move in a bullish trend, with a 55% chance of an uptrend and a 35% chance of a downtrend. The remaining 10% chance is for a neutral trend.
⚠️Trading Alert : News Releases and Position Management 📰 🗞️ 🚫🚏
As a reminder, news releases can have a significant impact on market prices and volatility. To minimize potential losses and protect your running positions,
we recommend the following:
Avoid taking new trades during news releases
Use trailing stop-loss orders to protect your running positions and lock in profits
📌Please note that this is a general analysis and not personalized investment advice. It's essential to consider your own risk tolerance and market analysis before making any investment decisions.
📌Keep in mind that these factors can change rapidly, and it's essential to stay up-to-date with market developments and adjust your analysis accordingly.
💖Supporting our robbery plan will enable us to effortlessly make and steal money 💰💵 Tell your friends, Colleagues and family to follow, like, and share. Boost the strength of our robbery team. Every day in this market make money with ease by using the Thief Trading Style.🏆💪🤝❤️🎉🚀
I'll see you soon with another heist plan, so stay tuned 🤑🐱👤🤗🤩

GBPJPY Is Nearing An Important Resistance With The Trend!!Hey Traders, in today's trading session we are monitoring GBPJPY for a selling opportunity around 192.500 zone, GBPJPY is trading in a downtrend and currently is in a correction phase in which it is approaching the trend at 192.500 support and resistance area.
Trade safe, Joe.

GBPJPY BEST INTRADAY SETUPThis analysis focuses on the GBP/JPY 1-hour chart, highlighting key supply and demand zones.
Resistance Zone (191.600 - 192.000): If price retraces to this level, a rejection could lead to a further drop.
Support Zone (190.200 - 190.400): Price is currently reacting to this area. A break below could trigger a deeper move.
Major Demand Zone (189.500 - 189.700): If the current support fails, price may head toward this strong demand area, potentially providing a long opportunity.
Possible Scenarios:
Bullish Case : If price holds above 190.400 and breaks the 191.600 resistance, we could see an upward push.
Bearish Case : A rejection from 191.600 or a break below 190.200 may lead to a drop toward 189.600.
Stay cautious and watch price action confirmations before entering trades! 🚀


gbpjpy sell 1.2h
2. bearish
3.resist
4.bearish pannent bos/
5rsi34/sto10/vol bearish signs
6
7fibextdone
8fibretrace done
9
10
11
12bearish divergence
13tweezer top/bearish engulfing/shooting star/
14descending triangle
1.1h
2.dwn
3.resist
4.headand shoulder bos/new down trend forms/bearish exp triangle/bearish pannent
5.rsi35/sto4/volposible reversal ,but stil bearish
6.
7.fibextdone
8.fibretrdone
9.
10
11
12exp triangle
13
We wait the upward reversal and sell at the resistance zone
Buyers are in the market but we exp more sellers at new or on Tuesday close

GBPJPY Sell IdeaThis is 15m chart... look into 3m chart for the price action spotted for the set up. Soon i will be discussing my setup model...

LONG ON GBP/JPYNice Double Bottom at a Key Demand Level
Jpy index is also Falling from a major resistance area.
I am taking GJ long

GBP_JPY WILL FALL|SHORT|
✅GBP_JPY keps falling
In a downtrend and the
Pair made a bearish breakout
Of the 188.500 key level
So we are bearish biased
And we will be expecting
A further bearish continuation
SHORT🔥
✅Like and subscribe to never miss a new idea!✅

Gbpjpy 1h BullishThis is a breakdown from my last analysis for D1. This 1h broadening triangle is set to breakout on the 5th wave. Good trading!!
ShortBe patient and wait for pullback to last level of support broken which is purple lines above and sell down to next level of support Which is green lines on bottom
How 🤔 ever if price breaks thru last level of support Which is now resistance (purple lines) wait for pullback to those same purple lines and buy this pair up to next level of resistance

GBPJPY 4HWaited a while for this one but I closed 90% of my trade, left a runner and moved my Stop Loss to break even.

Sell Structure UPDATE!! Keeping the sell side momentum valid, GJ is showing the rejection with in the local range of 30mins timeframe with the doji candle. Certainly can be high probability trade.

GBPJPY H8 - Long SignalGBPJPY H8
Leading on from yesterdays analysis too, we came into that 190.000 support price before catching bid again, not entirely sure how much mileage this may have, but there is certainly scope for this setup to start filling this void like we mentioned yesterday.
A large 300 point range which offers 5R from support to resistance and 5R from resistance to support.

GBPJPY Bullish Pennant on 1D /W1 timeframeJust wait for JPY wearing out / firm rejection at the support trendline. Worth to enter Long with minimal stopout level near previous higher low. Keep eyes further at breakout above resistance trendline for absolute bull run this year!!

GBPJPY is Holding above the Support , All Eyes on BuyingHello Traders
In This Chart GBPJPY HOURLY Forex Forecast By FOREX PLANET
today GBPJPY analysis 👆
🟢This Chart includes_ (GBPJPY market update)
🟢What is The Next Opportunity on GBPJPY Market
🟢how to Enter to the Valid Entry With Assurance Profit
This CHART is For Trader's that Want to Improve Their Technical Analysis Skills and Their Trading By Understanding How To Analyze The Market Using Multiple Timeframes and Understanding The Bigger Picture on the Charts

GBP/JPY SENDS CLEAR BULLISH SIGNALS|LONG
Hello, Friends!
It makes sense for us to go long on GBP/JPY right now from the support line below with the target of 193.736 because of the confluence of the two strong factors which are the general uptrend on the previous 1W candle and the oversold situation on the lower TF determined by it’s proximity to the lower BB band.
✅LIKE AND COMMENT MY IDEAS✅

Bearish drop off pullback resistance?GBP/JPY is rising towards the pivot which acts as a pullback resistance and could drop to the 1st support.
Pivot: 189.58
1st Support: 183.14
1st Resistance: 194.56
Risk Warning:
Trading Forex and CFDs carries a high level of risk to your capital and you should only trade with money you can afford to lose. Trading Forex and CFDs may not be suitable for all investors, so please ensure that you fully understand the risks involved and seek independent advice if necessary.
Disclaimer:
The above opinions given constitute general market commentary, and do not constitute the opinion or advice of IC Markets or any form of personal or investment advice.
Any opinions, news, research, analyses, prices, other information, or links to third-party sites contained on this website are provided on an "as-is" basis, are intended only to be informative, is not an advice nor a recommendation, nor research, or a record of our trading prices, or an offer of, or solicitation for a transaction in any financial instrument and thus should not be treated as such. The information provided does not involve any specific investment objectives, financial situation and needs of any specific person who may receive it. Please be aware, that past performance is not a reliable indicator of future performance and/or results. Past Performance or Forward-looking scenarios based upon the reasonable beliefs of the third-party provider are not a guarantee of future performance. Actual results may differ materially from those anticipated in forward-looking or past performance statements. IC Markets makes no representation or warranty and assumes no liability as to the accuracy or completeness of the information provided, nor any loss arising from any investment based on a recommendation, forecast or any information supplied by any third-party.

Massive GJ sellAfter support trend line breakout it's the time to sell after price pullback and show weakness bullish


GBPJPY Price ActionHello Traders,
Last week, we observed significant supply, which has nearly been exhausted as we move into this week. Now, the focus shifts to demand—provided there’s no hidden supply left. You can also see the breakout happening, and I took an early entry, which I plan to hold throughout this week.
If the price breaks through key levels, wait for a pullback before entering. However, the best time to enter the market is now. I hope this makes sense to everyone.
Remember, risk management is everything. Always use a stop loss and avoid being greedy. Market structures tend to repeat themselves over time.
Wishing you all the best and happy trading! Thank you.

