#GBPJPY:Three Positions Currently Opened, What about the next? Our three positions are currently open based on our last three ideas on GJ. We’re witnessing a strong bullish movement at the moment. Our next big target is 197, and then we aim for 200. Remember, trading involves risk, so take your own decisions.
Good luck and trade safely!
Thank you for your unwavering support! 😊
If you’d like to contribute, here are a few ways you can help us:
- Like our ideas
- Comment on our ideas
- Share our ideas
Team Setupsfx_
❤️🚀
GBPJPY trade ideas

GBPJPY Signal : 1H / 4H Beautiful buy !!!Hello Traders! 👋
What are your thoughts on GBPJPY ?
GBPJPY
Market price : 192.40
Buy Limit: 191.20 - 191.00
Tp1 : 192.10
Tp2 : 193.10
Tp3 : 194.50
Tp4 : 195.90
Sl : 190.10 ( 100 pip )
Don’t forget to like and share your thoughts in the comments! ❤️
Remember this is a position that was found by me and it is a personal idea not a financial advice, you are responsible for your loss and gain.

GBPJPY - Crazy Bullish!Hello TradingView Family / Fellow Traders. This is Richard, also known as theSignalyst.
📈GBPJPY has been overall bullish trading within the rising channel marked in blue.
Moreover, it is retesting a strong demand zone marked in green.
🏹 Thus, the highlighted blue circle is a strong area to look for buy setups as it is the intersection of demand and lower blue trendline acting as a non-horizontal support.
📚 As per my trading style:
As #GBPJPY approaches the blue circle zone, I will be looking for bullish reversal setups (like a double bottom pattern, trendline break , and so on...)
📚 Always follow your trading plan regarding entry, risk management, and trade management.
Good luck!
All Strategies Are Good; If Managed Properly!
~Rich
Disclosure: I am part of Trade Nation's Influencer program and receive a monthly fee for using their TradingView charts in my analysis.

DeGRAM | GBPJPY Formed a Falling Wedge📊 Technical Analysis
● Clean breakout above the 190.3 –191.3 demand zone and retest of the grey downtrend line sets a bullish base.
● The small falling wedge points to horizontal resistance at 193.5.
💡 Fundamental Analysis
● BoE minutes reveal a hawkish tilt, cementing a wide UK–Japan yield gap as markets push back rate-cut bets .
● BoJ stays ultra-dovish: April CPI slowed to 2.3 % YoY, keeping the yen soft against higher-yielding currencies .
✨ Summary
Demand-zone hold + hawkish BoE/dovish BoJ underline a short-term long bias: targets 193.5 → 196; invalidation on a close below 190.
-------------------
Share your opinion in the comments and support the idea with like. Thanks for your support!

GBP/JPY Bullish Flag (29.04.2025)The GBP/JPY pair on the M30 timeframe presents a Potential Buying Opportunity due to a recent Formation of a Breakout Pattern. This suggests a shift in momentum towards the upside and a higher likelihood of further advances in the coming hours.
Possible Long Trade:
Entry: Consider Entering A Long Position around Trendline Of The Pattern.
Target Levels:
1st Resistance – 192.18
2nd Resistance – 192.70
🎁 Please hit the like button and
🎁 Leave a comment to support for My Post !
Your likes and comments are incredibly motivating and will encourage me to share more analysis with you.
Best Regards, KABHI_TA_TRADING
Thank you.

GBPJPY: Consolidation Phase Targeting the Main TrendHey Traders, in today's trading session we are monitoring GBPJPY for a buying opportunity around 189.600 zone, GBPJPY is trading in an uptrend and currently is in a correction phase in which it is approaching the trend at 189.600 support and resistance area.
Trade safe, Joe.

GBPJPY | Trendline Breakout & Retest Zones Identified (4H Chart)GBPJPY broke out of a well-respected upward trendline, followed by a retest of previous support levels now acting as resistance.
• Breakout Confirmation: Sharp drop after trendline violation.
• Key Zones Marked:
• Support #1 flipped to resistance.
• Previous Low acting as resistance.
• Multiple support zones at 188.60, 186.78, and 185.88.
This setup could present short opportunities if price rejects from resistance, targeting the lower support levels. A break above resistance may invalidate the bearish setup.
Watching price action around these levels for confirmation.

GBP/JPY LONG GBP/JPY LONG " break of a resistance area and retest it + 61.8% fib retracement + 50 ema dynamic support "

GBPJPY's Confusing Mess: Can You Read the Chaos?GBPJPY is stuck in a nasty range, bouncing from channel to channel with no clear direction—yet patterns are forming. As price rejects the weekly gap near the inner channel high, we may see a second push up before a possible trendline break. Here's how to make sense of the madness.

“GBPJPY Surges 200+ Pips After Breakout – More Gains Coming?”GBPJPY Hits +200 Pips After Classic Breakout – More Upside Ahead?
Description:
In a recent analysis shared here, GBPJPY followed through perfectly after breaking out of a bullish triangle pattern. The pair surged over +200 pips, breaching the key resistance zone around 191.00 and now trading near 193.20.
This breakout aligns with strong bullish momentum on the daily chart. While a minor pullback may occur, the next potential upside targets are 195.00, followed by the major 200.00 psychological level, where historical resistance lies.
As long as price holds above the 190.00 support zone, the bullish scenario remains valid. Traders may watch for intraday corrections to rejoin the uptrend.
Follow for more updates and trade setups across major FX pairs.

#GBPJPY: +916 Pips Swing Buy Opportunity! Comment Down Your ViewThe FX:GBPJPY price has moved nicely from 187 to 191, almost +400 pips. I expect a small correction, but then the bullish move should continue towards the 200 region. You can set a target based on your analysis or set it at 200, whichever works for you. Good luck and trade safely.
Good luck and trade safely!
Thank you for your unwavering support! 😊
If you’d like to contribute, here are a few ways you can help us:
- Like our ideas
- Comment on our ideas
- Share our ideas
Team Setupsfx_
❤️🚀

GBPJPY Bullish Outlook After Sideways BreakoutOANDA:GBPJPY bullish after breakout from sideways range, expecting continued rise towards resistance. Rejection at 0.618 with stochastic oversold supports upward bias.

GBPJPY PLAnpossible whipsaw today to continue the move up,il be keeping close eye not to trade against the bullish trend too long

GBP/JPY Want To Give Us A Second Chance With Extra 200 Pips !here is my GBP/JPY Chart , the price follow the arrows 100% and the price closed below and then back to retest it and then moved to downside and gave us 100 pips , now if we have a good 4h closure below my new supp , we can enter a new sell trade and targeting 250 pips .

GBPJPY LONG FORECAST Q2 W19 D6 Y25GBPJPY LONG FORECAST Q2 W19 D6 Y25
Professional Risk Managers👋
Welcome back to another FRGNT chart update📈
Diving into some Forex setups using predominantly higher time frame order blocks alongside confirmation breaks of structure.
Let’s see what price action is telling us today!
💡Here are some trade confluences📝
✅Weekly 50 EMA
✅Daily 50 EMA
✅Intraday 15' order block
✅Tokyo ranges to be filled
✅Intraday bullish breaks of structure to be confirmed
🔑 Remember, to participate in trading comes always with a degree of risk, therefore as professional risk managers it remains vital that we stick to our risk management plan as well as our trading strategies.
📈The rest, we leave to the balance of probabilities.
💡Fail to plan. Plan to fail.
🏆It has always been that simple.
❤️Good luck with your trading journey, I shall see you at the very top.
🎯Trade consistent, FRGNT X
GBPJPY SIGNAL UPDATE READ THE CAPTIANgbpjpy signal techincal analysis satup ENTRY POINT 192.200 TO 192.300 TAKE PROFIT 1 (192.000) TAKE PROFIT 2 (191.600) LAST TARGET (191.000) STOP LOSS (192.750) FALLOW RISK MANAGMENT

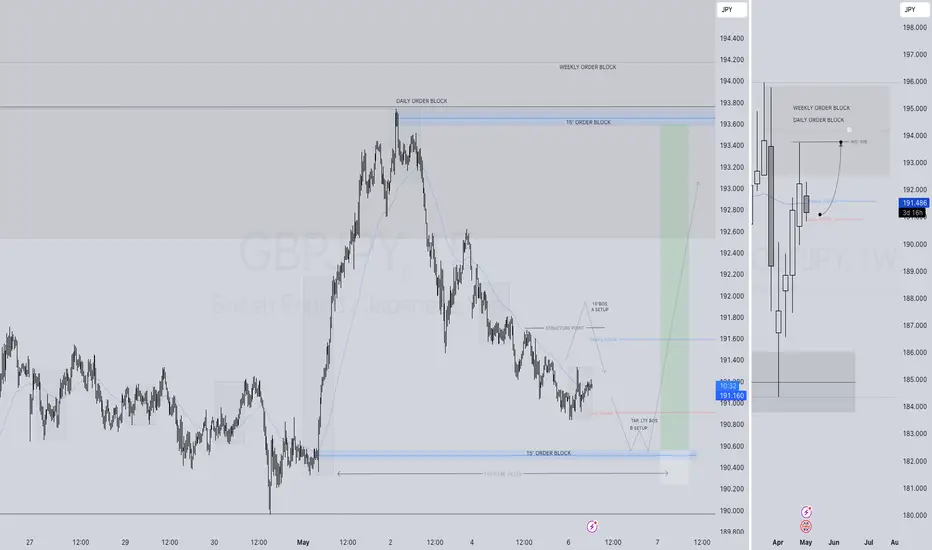
GBPJPY SHORT FORECAST Q2 W19 D5 Y25GBPJPY SHORT FORECAST Q2 W19 D5 Y25
Professional Risk Managers👋
Welcome back to another FRGNT chart update📈
Diving into some Forex setups using predominantly higher time frame order blocks alongside confirmation breaks of structure.
Let’s see what price action is telling us today!
💡Here are some trade confluences📝
✅Weekly order block rejection
✅Daily order block rejection
✅15' order block targets
✅Weekly imbalance fill targets
🔑 Remember, to participate in trading comes always with a degree of risk, therefore as professional risk managers it remains vital that we stick to our risk management plan as well as our trading strategies.
📈The rest, we leave to the balance of probabilities.
💡Fail to plan. Plan to fail.
🏆It has always been that simple.
❤️Good luck with your trading journey, I shall see you at the very top.
🎯Trade consistent, FRGNT X

swissy Shorts, short term15 min Idea
Either Asian lows manipulation might support the pro-trend direction, or it could reverse off a 15-min supply (which has already happened during this week).
These are short-term play ideas.

GBPJPY – Correction Could Offer a Good EntryA few days ago, I mentioned that GBPJPY could rise and test the 195.00 handle – and that idea still stands.
After pushing up to 191.75, the pair began to correct, which might be just what we needed: a chance to enter a long trade at better levels.
Is this correction a healthy pullback before resumption of the up move?
For now, it looks like a typical retracement within an uptrend (bullish flag).
The 190.00 zone, highlighted on the chart, is the ideal spot for long setups.
Why 190.00 is key:
- Strong horizontal support.
- Great risk-reward potential, with over 1:2 R:R possible.
- Price remains in bullish structure above 188.00.
Trading Plan:
Look for bullish confirmation around 190.00 – this zone could provide an excellent buying opportunity.
However, a break below 188.00 would invalidate the setup and call for caution.
Until then, buying the dip remains the plan.
Let the correction finish, and be ready to ride the next wave higher.
Disclosure: I am part of Trade Nation's Influencer program and receive a monthly fee for using their TradingView charts in my analyses and educational articles.

GBPJPY long entry Predicting the price would reach the channel top line. Bullish pattern + broke the key level and retesting. This is only my idea, I will share the results later.


#GBPJPY H4 TF Analysis #GBPJPY H4 TF is bearish once market is comming to our *AOI* then entry with LTF Conformation for a Good trade .
KGB Priyabrat Behera
ICT AND Advance Mapping SMC Trader

USDJPY and GBPJPY Analysis todayHello traders, this is a complete multiple timeframe analysis of this pair. We see could find significant trading opportunities as per analysis upon price action confirmation we may take this trade. Smash the like button if you find value in this analysis and drop a comment if you have any questions or let me know which pair to cover in my next analysis.
