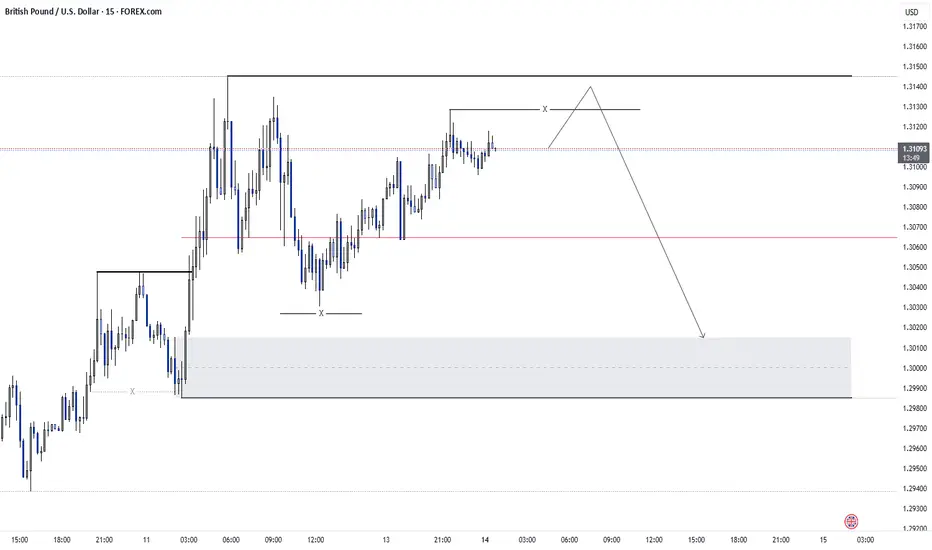
GBPUSD at Key Resistance - Time to Sell?OANDA:GBPUSD has reached a key resistance level, marked by significant selling pressure. This area has historically acted as a key supply zone, increasing the likelihood of a bearish reaction if sellers step in again.
The current market structure suggests that if the price confirms a rejection from this resistance level, there is a high probability of a downward move. I anticipate that if rejection occurs, the market may head lower toward the 1.30950 level, which serves as a logical target within the current market structure. However, a break above this resistance would invalidate the bearish bias and could lead to further upside.
This setup reflects the potential for a retracement after an impulsive move, supported by the confluence of previous price behavior and the current structure. If you agree with this analysis or have additional insights, feel free to share your thoughts in the comments!
GBPUSD.1.MINI trade ideas

#GBPUSD: Two Prominent Buying Points! Will Dxy Bounce Back? Due to strong economic data supporting GBP, its price has been bullish throughout the week, especially since DXY plunged. Given ongoing trade tensions, we may see another higher high. This is risky, so please analyse it yourself.
Like and comment to support us in bringing more analysis.
Have a great weekend! ❤️
Team Setupsfx_

GBPUSD I Weekly CLS I KL - OB I Model 2, Target HTF OBHey, Market Warriors, here is another outlook on this instrument
If you’ve been following me, you already know every setup you see is built around a CLS range, a Key Level, Liquidity and a specific execution model.
If you haven't followed me yet, start now.
My trading system is completely mechanical — designed to remove emotions, opinions, and impulsive decisions. No messy diagonal lines. No random drawings. Just clarity, structure, and execution.
🧩 What is CLS?
CLS is real smart money — the combined power of major investment banks and central banks moving over 6.5 trillion dollars a day. Understanding their operations is key to markets.
✅ Understanding the behaviour of CLS allows you to position yourself with the giants during the market manipulations — leading to buying lows and selling highs - cleaner entries, clearer exits, and consistent profits.
🛡️ Models 1 and 2:
From my posts, you can learn two core execution models.
They are the backbone of how I trade and how my students are trained.
📍 Model 1
is right after the manipulation of the CLS candle when CIOD occurs, and we are targeting 50% of the CLS range. H4 CLS ranges supported by HTF go straight to the opposing range.
📍 Model 2
occurs in the specific market sequence when CLS smart money needs to re-accumulate more positions, and we are looking to find a key level around 61.8 fib retracement and target the opposing side of the range.
👍 Hit like if you find this analysis helpful, and don't hesitate to comment with your opinions, charts or any questions.
⚔️ Listen Carefully:
Analysis is not trading. Right now, this platform is full of gurus" trying to sell you dreams based on analysis with arrows while they don't even have the skill to trade themselves.
If you’re ever thinking about buying a Trading Course or Signals from anyone. Always demand a verified track record. It takes less than five minutes to connect 3rd third-party verification tool and link to the widget to his signature.
"Adapt what is useful, reject what is useless, and add what is specifically your own."
— David Perk aka Dave FX Hunter ⚔️

GBP/USD Fundamental Update (17.04.2025)The GBP/USD pair on the M30 timeframe presents a Potential Buying Opportunity due to a recent Formation of a Breakout Pattern. This suggests a shift in momentum towards the upside and a higher likelihood of further advances in the coming hours.
Possible Long Trade:
Entry: Consider Entering A Long Position around Trendline Of The Pattern.
Target Levels:
1st Resistance – 1.3320
2nd Resistance – 1.3369
🎁 Please hit the like button and
🎁 Leave a comment to support for My Post !
Your likes and comments are incredibly motivating and will encourage me to share more analysis with you.
Best Regards, KABHI_TA_TRADING
Thank you.

GBP/USD Short Term Trend - Bearish Rebound🔔🔔🔔 GBP/USD news:
➡️ GBP/USD continues to climb, approaching the 1.3100 mark during European trading, as the persistent weakness in the U.S. dollar remains a key market driver. Escalating concerns over the deepening U.S.-China trade conflict and its potential to trigger a U.S. trade conflict. recession are weighing heavily on sentiment.
➡️ Broad-based selling pressure on the U.S. dollar followed China's retaliatory move to raise tariffs on American goods from 34% to 84%, supporting further gains in the GBP/USD pair.
Although Trump has temporarily paused additional tit-for-tat tariffs, investor anxiety over the U.S. Economic outlook remains elevated, with fears that trade tensions with China will intensify. As a result, the dollar remains under fresh downward pressure, allowing GBP/USD to regain bullish momentum.
Personal opinion:
➡️ DXY is showing signs of recovery after entering the extreme oversold zone. As a result, GBP/USd will have a downward phase after entering the overbought zone.
➡️ Analysis based on resistance - support levels and Volume profile combined with trend lines to come up with a suitable strategy
Plan:
🔆Price Zone Setup:
👉Sell GBP/USD 1.3080 – 1.3090
❌SL: 1.3120| ✅TP: 1.3020– 1.2970
FM wishes you a successful trading day 💰💰💰

GBPUSD - NEW BREAKOUT !Hello Traders !
The GBPUSD failed to create a new lower low!
At the moment, The last higher high is broken (break of structure).
So, I expect a bullish move🚀
______________
TARGET: 1.33630🎯

GBP/USD.. 30M chart patren..GBP/USD short trade setup summarized clearly:
---
Trade Setup:
Pair: GBP/USD
Direction: SELL
Entry: 1.32150
Resistance (Stop-Loss Area): 1.32500
Target 1: 1.31690 (approx. +46 pips)
Target 2: 1.31000 (approx. +115 pips)
---
Risk/Reward Analysis (R:R):
Stop-loss: 1.32500 (−35 pips)
Target 1 R:R: ~1.3:1
Target 2 R:R: ~3.3:1
This setup has a solid R:R if price reacts from the 1.32150 level and respects 1.32500 as resistance.
Would you like a quick technical chart analysis or fundamental outlook to back the trade?

GBPUSD Bullish ChannelIt looks as though GBPUSD is about to expand higher in this exponential resistance pattern. I am awaiting a retest on the trend line before a bounce higher.

GBPUSD - Intraday Analysis: Expect a slight correctionIt is true that the order flow is bullish on the daily timeframe, but on this timeframe, the price has reached an order block. Considering the price reaching a P/D array on the 4-hour timeframe, I expect the price to move towards clearing the liquidity of the internal range on the 15-minute timeframe after clearing the liquidity of the external range.
GU-Wed-16/04/25 TDA-Stubborn and strong GU bulls! Analysis done directly on the chart
Do it, Do it, Do it.
One simple action values more than thousand words.
Not financial advice, DYOR.
Market Flow Strategy
Mister Y

GBP/USD Short Setup – Rejection from Resistance Zone with High REMA 30 (red line)
EMA 200 (blue line)
---
Key Levels:
Entry Point: 1.31324
Stop Loss: 1.32303
Target (TP): 1.28102
---
Analysis:
1. Trend Context:
The market shows a recent bullish move approaching a key resistance zone (highlighted in purple).
The price is now reacting to that resistance zone and potentially forming a reversal.
2. EMA Insight:
Price is currently trading slightly above the EMA 200 and EMA 30, indicating short-term bullish momentum.
However, the suggested trade setup appears to be short (sell), anticipating a reversal from resista

GBP/USD Resistance Test: Will the Pound Maintain its Strength?📊 GBP/USD Daily Technical Outlook – April 11, 2025
Overview
The GBP/USD pair saw a notable rally on Friday, opening at 1.2970, reaching a high of 1.3046, and a low of 1.2967, before closing at 1.3007. This upward movement reflects the continuation of the bullish trend from earlier in the week, supported by positive economic data from the UK and a weakening U.S. dollar. The pair is currently moving in a strong bullish phase, with the market eyeing higher resistance levels.
📈 Current Market Structure
After a period of consolidation, the pair broke above key resistance levels, signaling strong buying momentum. This move follows positive GDP data from the UK, which showed a 0.5% growth in February 2025, the highest growth in 11 months.
🔹 Key Resistance Levels:
1.3046: The highest point of April 11, 2025. This is immediate resistance, and a break above it could lead to further upside.
1.3100: Psychological resistance level. A break above this could extend the rally further.
1.3200: A major resistance area, which could be a target for buyers if the bullish trend continues.
🔸 Key Support Levels:
1.2967: The low for the day, which acts as immediate support. A stay above this level reinforces the bullish outlook.
1.2900: A significant support level. A break below this could signal a short-term pullback.
1.2820: Strong support, marking the bottom of the previous price range.
📐 Price Action Patterns:
The strong bullish candles in recent days indicate dominance by buyers. The breakout above previous resistance levels and the formation of higher highs support the continuation of the uptrend. However, traders should keep an eye on potential reversal patterns as the price approaches resistance.
🧭 Potential Scenarios:
✅ Bullish Scenario:
If GBP/USD holds above 1.3046, the next targets could be 1.3100 and potentially 1.3200, driven by strong momentum from positive UK data and a weakening dollar.
❌ Bearish Scenario:
If GBP/USD fails to sustain above 1.2967, a pullback to 1.2900 could occur. A break below this level could lead to further declines towards 1.2820.
📌 Conclusion:
GBP/USD is showing strong bullish momentum, supported by positive economic data from the UK and a weakening U.S. dollar. A sustained break above resistance levels could open the door for further gains. Traders should watch for potential pullbacks at key support levels and monitor economic developments closely.
Note: This analysis is based on data available up to April 11, 2025. Always monitor the latest developments and apply appropriate risk management when trading.

GBP is bullish but looks weakThere can be a short pullback, which can be a quick move also
The momentum is very low but the volume is still high

GBPUSD(20250416)Today's AnalysisToday's buying and selling boundaries:
1.3214
Support and resistance levels:
1.3301
1.3268
1.3247
1.3180
1.3159
1.3127
Trading strategy:
If the price breaks through 1.3247, consider buying, the first target price is 1.3268
If the price breaks through 1.3214, consider selling, the first target price is 1.3180

GBP/USD: Bearish Divergence Flags Pullback Risk Bearish divergence between RSI (14) and price should have GBP/USD traders alert to the risk of a potential partial reversal of the recent bullish move.
Those contemplating the setup could look to sell around current levels or slightly higher, with a stop placed above the recent high of 1.3207 for protection. Bids may emerge around 1.3140—the high set last Friday—although 1.3045 screens as a more appropriate target, given the amount of price action seen either side of it over extended periods last year. While RSI (14) has diverged from price, MACD continues to generate a bullish momentum signal.
If the rally extends beyond 1.3207, the bearish setup would be invalidated.
Even though price and momentum signals favour upside, signs of stability in U.S. Treasuries and stocks—two markets that likely contributed to last week’s U.S. dollar weakness—may support the greenback in the near term.
Good luck!
DS

2025 Gold & GU Break DownExcuse me I'm on daddy duties lol but we still have to perform in this video I break down how I was able to take advantage of selling opportunity gold presented. Wasn't able to capitalize on GU but overall profitable session.

GBP/USD Daily AnalysisPrice is in a strong bullish trend.
After 6 bullish candles, we may now see a correction back towards the moving averages as profit taking occurs.
This is just an idea of what may happen. Always trade with a profitable strategy and good risk management.

GBPUSD buy Break of structure to the upside .We have been on a buy trend .Market moves to respect the Break and retest and now the we gotta go back to our demand to take more orders to the sky

GBPUSD SHORT FORECAST Q2 W16 D18 Y25GBPUSD SHORT FORECAST Q2 W16 D18 Y25
Fun Coupon Friday!
Summary
- Weekly order block short set up
- Awaiting clear shift in price action to downside
- C setup - Short from 5' order block with confluence of daily high wick fill prior turn over in price.
- B Setup - 15' break of structure anticipating 15' creation order block creation. Solid point of interest to short from
A Setup - Multiple 15' break of structure plus all of the above
FRGNT X

GBP/USD - Weekly Elliott Wave Forecast | Potential B-Wave Trap!Pattern: Completed 5-Wave Impulse + ABC Zigzag Correction
Current Price: 1.3056
Forecast: Bearish B-Wave Reversal Incoming?
Technical Breakdown:
Major impulse from 2007 to 2022 marked as 1 to 5
A corrective ABC move completed at the key resistance zone
Price currently facing rejection from the C wave top
High probability of a B-Wave trap forming before a drop to the 1.14 zone
Strong confluence with historical structure and Fibonacci retracement
Next Move:
Watch for a weekly candle close below 1.28 to confirm the reversal. Bears may target the 1.14 zone in the next leg down.
Wave Structure Visualized (Top-Right Inset):
Shows possible B-Wave drop before bullish C continuation — a perfect trap zone for early bulls.
Trade Plan:
Short bias below 1.30 with SL above 1.32
Target: 1.18–1.14 zone
Re-assess price action near 1.14 for long opportunities
Stay Sharp, Stay Green!

BEARISH BIASGbpUsd is set up for long term sell.
Looking at daily time frame you will observe price formed BOS while on a downward trend the previous week. That triggered a bullish liquidity sweep to previous supply region, which also was a resistance zone.
Upper liquidity have been fully filled, expect long term bearish trend which will get to daily demand zone, which was previously a support.
Below previous break of structure before upper liquidity movement, daily printed equal low liquidity zones which will likely not hold as demand zones.

GBPUSD Potential UpsidesHey Traders, in today's trading session we are monitoring GBPUSD for a buying opportunity around 1.32300 zone, GBPUSD is trading in an uptrend and currently is in a correction phase in which it is approaching the trend at 1.32300 support and resistance area.
Trade safe, Joe.

Market Insights with Gary Thomson: April 14 - 18Market Insights with Gary Thomson: UK & Canada Inflation, BOC & ECB Rates, Corporate Earnings
In this video, we’ll explore the key economic events, market trends, and corporate news shaping the financial landscape. Get ready for expert insights into forex, commodities, and stocks to help you navigate the week ahead. Let’s dive in!
In this episode, we discuss:
- UK’s Unemployment and Inflation Rates
- Inflation Rate in Canada & BOC Interest Rate Decision
- ECB Interest Rate Decision
- Corporate Earnings Statements
Don’t miss out—gain insights to stay ahead in your trading journey.
This video represents the opinion of the Companies operating under the FXOpen brand only. It is not to be construed as an offer, solicitation, or recommendation with respect to products and services provided by the Companies operating under the FXOpen brand, nor is it to be considered financial advice.
