Bullish rebound?The Cable (GBP/USD) has bounced off the pivot which is a pullback support and could rise to the 1st resistance which acts as a pullback resistance.
Pivot: 1.2717
1st Support: 1.2570
1st Resistance: 1.2875
Risk Warning:
Trading Forex and CFDs carries a high level of risk to your capital and you should only trade with money you can afford to lose. Trading Forex and CFDs may not be suitable for all investors, so please ensure that you fully understand the risks involved and seek independent advice if necessary.
Disclaimer:
The above opinions given constitute general market commentary, and do not constitute the opinion or advice of IC Markets or any form of personal or investment advice.
Any opinions, news, research, analyses, prices, other information, or links to third-party sites contained on this website are provided on an "as-is" basis, are intended only to be informative, is not an advice nor a recommendation, nor research, or a record of our trading prices, or an offer of, or solicitation for a transaction in any financial instrument and thus should not be treated as such. The information provided does not involve any specific investment objectives, financial situation and needs of any specific person who may receive it. Please be aware, that past performance is not a reliable indicator of future performance and/or results. Past Performance or Forward-looking scenarios based upon the reasonable beliefs of the third-party provider are not a guarantee of future performance. Actual results may differ materially from those anticipated in forward-looking or past performance statements. IC Markets makes no representation or warranty and assumes no liability as to the accuracy or completeness of the information provided, nor any loss arising from any investment based on a recommendation, forecast or any information supplied by any third-party.
GBPUSD.1.MINI trade ideas

Falling towards pullback support?GBP/USD is falling towards the support level which is a pullback support that aligns with the 161.8% Fibonacci extension and the 61.8% Fibonacci retracement and could bounce from this level to our take profit.
Entry: 1.2677
Why we like it:
There is a pullback support level that lines up with the 161.8% Fibonacci retracement and the 61.8% Fibonacci retracement.
Stop loss: 1.2677
Why we like it:
There is a pullback support level that is slightly below the 71% Fibonacci retracement.
Take profit: 1.2875
Why we like it:
There is a pullback resistance level.
Enjoying your TradingView experience? Review us!
Please be advised that the information presented on TradingView is provided to Vantage (‘Vantage Global Limited’, ‘we’) by a third-party provider (‘Everest Fortune Group’). Please be reminded that you are solely responsible for the trading decisions on your account. There is a very high degree of risk involved in trading. Any information and/or content is intended entirely for research, educational and informational purposes only and does not constitute investment or consultation advice or investment strategy. The information is not tailored to the investment needs of any specific person and therefore does not involve a consideration of any of the investment objectives, financial situation or needs of any viewer that may receive it. Kindly also note that past performance is not a reliable indicator of future results. Actual results may differ materially from those anticipated in forward-looking or past performance statements. We assume no liability as to the accuracy or completeness of any of the information and/or content provided herein and the Company cannot be held responsible for any omission, mistake nor for any loss or damage including without limitation to any loss of profit which may arise from reliance on any information supplied by Everest Fortune Group.

GBPUSD - The Trend is Your FriendWaiting for a bullish pullback to sell around the 1.29 handle.
Trade Safe - Trade Well. God Bless...


GBPusd Scenario 08/04/2025English : According to our analysis, we anticipate a Bearish scenario.
Morocan Darija : kanchofo d'apres l'analyse dyalna antsanaw hbot
ATENTION : I only share my ideas, not signals.

GBPUSD to recoverCCI convergence at the current levels.
I see 1.2715 holding the low and attempt to recover ground for a test higher at 1.2935 in the near-term

GBPUSD - ANALYSIS👀 Observation:
Hello, everyone! I hope you're doing well. I’d like to share my analysis of GBP-USD with you.
Looking at the GBP chart, I expect a slight price increase, possibly up to 1.29625. After reaching this level, I anticipate a price decline towards 1.27161.
📉 Expectation:
Bullish Scenario: A small increase to 1.29625.
Bearish Scenario: After reaching 1.29625, price declines towards 1.27161.
💡 Key Levels to Watch:
Support: 1.27161
Resistance: 1.29625
💬 What do you think about GBP-USD this week? Let me know in the comments!
Trade safe

GBPUSD Possible Trade idea GBPUSD H4
After a Bullish BOS, Currency Pros Indicator can identify
Discounted price for possible long positions
targeting the newly created swing high.
Strange enough EU did this before making a new high, but GU made the new high first then went for this LQ grab.
Makes it hard to have confidence on the trade but looks valid.

Markets in Turmoil and Correlations breaking - SELL GBPUSDAll the information you need to find a high probability trade are in front of you on the charts so build your trading decisions on 'the facts' of the chart NOT what you think or what you want to happen or even what you heard will happen. If you have enough facts telling you to trade in a certain direction and therefore enough confluence to take a trade, then this is how you will gain consistency in you trading and build confidence. Check out my trade idea!!
www.tradingview.com

GU-Mon-7/04/25 Top down analysis-Huge liquidity grab on GU!Analysis done directly on the chart
You don't have to be a genius to understand
macro economically what's happening in the market.
Use economic calendar, FinancialJuice to stay up to date.
Not financial advice, DYOR.
Market Flow Strategy
Mister Y

Bullish Rectangle of CableChart Shapes Work Very Well When News and Financial Indicators also Confirm Them. You See Here a Bullish Rectangle in GBPUSD Day Chart. For Long Time Holders It is A Good Trade Time.

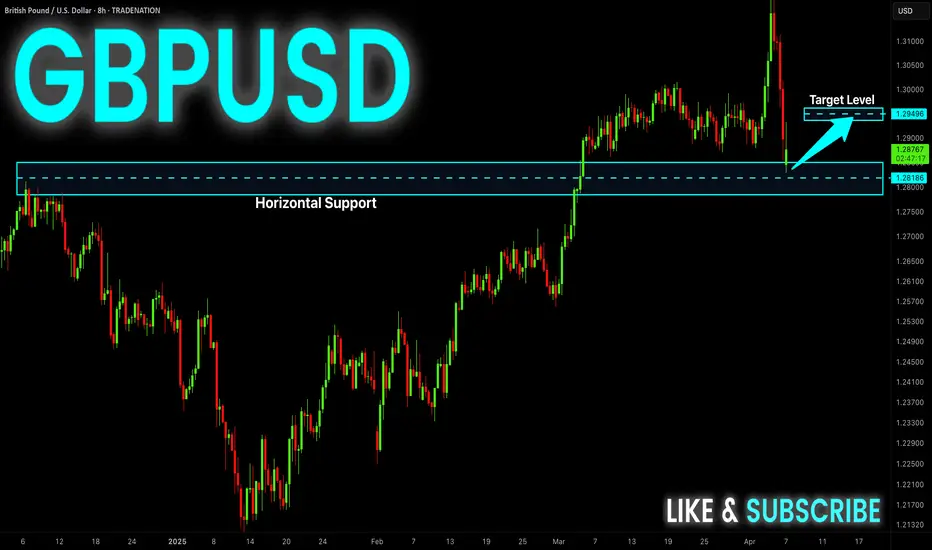
GBP-USD Local Rebound Ahead! Buy!
Hello,Traders!
GBP-USD has hit a
Wide horizontal demand
Level around 1.2800 and
We are seeing a bullish
Rebound already so we
Are locally bullish biased
And we believe we will
Be seeing a further move up
Buy!
Comment and subscribe to help us grow!
Check out other forecasts below too!
Disclosure: I am part of Trade Nation's Influencer program and receive a monthly fee for using their TradingView charts in my analysis.
GBPUSD selloffWe wait for this retest and then hope for best, overrall markets should still head downwards as Tariffs are in play, but you always never know what will happen, this will be my play today , I think it was called ''silver bullet'' pattern.
2.7 RRR
GL Traders
Not advice !

GBPUSD SHORT FORECAST Q2 W15 Y25 MONDAY 7TH APRIL 2024GBPUSD SHORT FORECAST Q2 W15 Y25 MONDAY 7TH APRIL 2024
First and full most, It looks good! However, it's important to approach with caution... much like always.
Pay attention to the previous weekly closure. Yes is it showing a rejection BUT in terms of us always expecting a wick fill prior trading in the opposing direction, Would an immediate short make sense?
We need to see clear price action showing us that it is not interesting in retracting the previous weekly wick with clear bearish movement.
More on the set up descriptions later in terms of text but I trust the chart analysis speaks 1000 words.
FRGNT X
GBP/USD Technical Outlook – April 7, 2025GBP/USD Technical Outlook – April 7, 2025 📊
🔹 Current Price: 1.29116
🔹 Timeframe: 15-Minute Chart
📌 Bullish Scenario (Primary & Alternate Paths):
🟢 Price is approaching a minor resistance at 1.29144, and a break above could lead to a push toward:
📍 1.29620 – Short-term resistance
📍 1.30295 – Key target zone
📌 Demand Zones (Support):
🟩 1.29144 - 1.29307 – Retest zone (potential bullish continuation)
🟩 1.27850 - 1.28350 – Major support for rebound if price rejects near-term structure
🛠️ Game Plan:
✅ Look for confirmations (bullish engulfing or breakout retest) around 1.29144 for long setups.
❗ If price breaks below both demand zones, reassess for bearish pressure.
#GBPUSD #PriceAction #ForexAnalysis #FXFOREVER #SmartMoneyConcepts #DemandZone #SupplyAndDemand #15MAnalysis

GBP/USD BUY ENTRY @1.28580 H4 chart analysisEntry Point: Around 1.28580
Stop Loss (SL): Around 1.27183
Take Profit (TP): Approximately 1.31000 (based on the green target zone)
Support Zone: Between 1.27183 and 1.28580 (highlighted in red)
Resistance Zone: Around 1.31000
The setup shows a potential bullish move with a Risk/Reward Ratio of 2.71, indicating a favorable trade opportunity. Let me know if you'd like additional details or tips for presenting this to your client.

GBPUSD H1 | Bullish Bounce Off the127.2% Based on the H1 chart analysis, the price is falling toward our buy entry level at 1.2796, a pullback support that aligns with the 127.2 Fibonacci extension
Our take profit is set at 1.2883, a pullback resistance.
The stop loss is placed at 1.2675, an overlap support.
High Risk Investment Warning
Trading Forex/CFDs on margin carries a high level of risk and may not be suitable for all investors. Leverage can work against you.
Stratos Markets Limited (fxcm.com/uk):
CFDs are complex instruments and come with a high risk of losing money rapidly due to leverage. 63% of retail investor accounts lose money when trading CFDs with this provider. You should consider whether you understand how CFDs work and whether you can afford to take the high risk of losing your money.
Stratos Europe Ltd (fxcm.com/eu):
CFDs are complex instruments and come with a high risk of losing money rapidly due to leverage. 63% of retail investor accounts lose money when trading CFDs with this provider. You should consider whether you understand how CFDs work and whether you can afford to take the high risk of losing your money.
Stratos Trading Pty. Limited (fxcm.com/au):
Trading FX/CFDs carries significant risks. FXCM AU (AFSL 309763), please read the Financial Services Guide, Product Disclosure Statement, Target Market Determination and Terms of Business at fxcm.com/au
Stratos Global LLC (fxcm.com/markets):
Losses can exceed deposits.
Please be advised that the information presented on TradingView is provided to FXCM (‘Company’, ‘we’) by a third-party provider (‘TFA Global Pte Ltd’). Please be reminded that you are solely responsible for the trading decisions on your account. There is a very high degree of risk involved in trading. Any information and/or content is intended entirely for research, educational and informational purposes only and does not constitute investment or consultation advice or investment strategy. The information is not tailored to the investment needs of any specific person and therefore does not involve a consideration of any of the investment objectives, financial situation or needs of any viewer that may receive it. Kindly also note that past performance is not a reliable indicator of future results. Actual results may differ materially from those anticipated in forward-looking or past performance statements. We assume no liability as to the accuracy or completeness of any of the information and/or content provided herein and the Company cannot be held responsible for any omission, mistake nor for any loss or damage including without limitation to any loss of profit which may arise from reliance on any information supplied by TFA Global Pte Ltd.
The speaker(s) is neither an employee, agent nor representative of FXCM and is therefore acting independently. The opinions given are their own, constitute general market commentary, and do not constitute the opinion or advice of FXCM or any form of personal or investment advice. FXCM neither endorses nor guarantees offerings of third-party speakers, nor is FXCM responsible for the content, veracity or opinions of third-party speakers, presenters or participants.

My idea for GBPUSD short positionHi ,there is my idea for short position on GBPUSD ,you need to know how to enter the position at sell zone.

GBPUSD BUY offered to you on a platter!!Dont miss out on this move guys. The tariff will bring dxy down first before we go up. Dont use because the news seems bullish for dollar and miss out this move.
Noone knows what the tariffs mean, I can only interpret the chart and all I'm seeing now is bullishness. BUYYY

Falling towards pullback support?The Cable (GBP/USD) is falling towards the pivot which is a pullback support and could bounce tot he 1st resistance which acts as a pullback resistance.
Pivot: 1.2771
1st Support: 1.2551
1st Resistance: 1.3100
Risk Warning:
Trading Forex and CFDs carries a high level of risk to your capital and you should only trade with money you can afford to lose. Trading Forex and CFDs may not be suitable for all investors, so please ensure that you fully understand the risks involved and seek independent advice if necessary.
Disclaimer:
The above opinions given constitute general market commentary, and do not constitute the opinion or advice of IC Markets or any form of personal or investment advice.
Any opinions, news, research, analyses, prices, other information, or links to third-party sites contained on this website are provided on an "as-is" basis, are intended only to be informative, is not an advice nor a recommendation, nor research, or a record of our trading prices, or an offer of, or solicitation for a transaction in any financial instrument and thus should not be treated as such. The information provided does not involve any specific investment objectives, financial situation and needs of any specific person who may receive it. Please be aware, that past performance is not a reliable indicator of future performance and/or results. Past Performance or Forward-looking scenarios based upon the reasonable beliefs of the third-party provider are not a guarantee of future performance. Actual results may differ materially from those anticipated in forward-looking or past performance statements. IC Markets makes no representation or warranty and assumes no liability as to the accuracy or completeness of the information provided, nor any loss arising from any investment based on a recommendation, forecast or any information supplied by any third-party.

GBPUSD FORECASTIn this analysis we're focusing on 4H time frame for GBPUSD. As we know that market trend was bullish and today I'm looking for a buy side opportunity. According to my analysis, if the market price wants to continue its move to the upside, it will need to first retest the key levels drawn on the chart before it can continue its upward movement. Let's see what happens and which opportunity market will give us. Always remember when price reaches our key levels wait for confirmation. After confirmation execute your trades.
Always use stoploss for your trade.
Always use proper money management and proper risk to reward ratio.
This is just my analysis or prediction.
#GBPUSD 4H Technical Analyze Expected Move.

GBPUSD - bottom out pattern going on? What's next??#GBPUSD - perfect move as per our last couple of ideas regarding #GBPUSD
and now in current situation we have 1.3220 as immediate supporting and below that 1.3140
If market holds that supporting areas then we can expect further bounce towards 1.3500 and after that 1.3700 , 1.3900 n upto 1.4200
So stay sharp and don't be lazy here..
Good luck
Trade wisley

GBPUSD Happy Easter Traders! 4/20 6:33pm. I’m currently holding a sell position on GBP/USD at 1.32480, and despite price climbing to 1.32942, I see several technical and fundamental factors that support my trade idea.
Fundamental Perspective
Looking ahead, this week presents major economic events that could drive volatility in GBP/USD.
UK PMI (April 23): Manufacturing PMI is expected to drop to 44.1, while Services PMI may soften to 51.0—both indicators suggest economic slowdown, potentially putting downward pressure on GBP.
US Durable Goods (April 24): Forecasts show mixed numbers—headline durable goods is projected at +1.8%, but ex-transportation and ex-defense figures are negative, meaning uncertainty surrounding USD demand.
UK Retail Sales (April 25): The monthly figure is expected at -0.3%, signaling weaker consumer spending. This aligns with my sell bias, as deteriorating UK economic conditions could contribute to pound weakness.
If the UK data disappoints while US figures remain mixed or slightly stronger, GBP/USD could face renewed selling pressure, validating my position.
Technical Analysis - Historical & Indicator Confirmation
Looking at the daily chart, there’s strong alignment between price action and indicator readings that suggest a potential reversal:
Resistance Holding at 1.330–1.331:
The Stochastic at 74.88 suggests GBP/USD is nearing overbought conditions.
The Williams %R at -22.24 reinforces the idea that price is pushing into exhaustion territory.
Support Structure (Where Downside Pressure Could Build):
Immediate Support at 1.326–1.327: Previous lows from April 20 confirm this zone as a critical level for sellers.
Secondary Support at 1.321: Multiple recent price reactions suggest this area could serve as a strong downside target.
Deeper Support at 1.316–1.318: If bearish momentum strengthens, this area represents a key swing low.
Additionally, while price is pushing higher in the short term, it’s trading well above long-term daily EMAs, suggesting the rally is a temporary overextension rather than a sustained breakout. If GBP/USD fails to break above 1.330–1.331, momentum could shift in favor of my sell trade.
Trade Management & Outlook
Despite the recent push higher, I remain confident in my sell position as long as GBP/USD does not break and hold above 1.330–1.331. If price starts rejecting this level, the next downside target could be 1.326, followed by 1.321, where I’d consider taking partial profits.
With fundamental catalysts ahead, volatility will likely increase. If bullish momentum persists beyond 1.331, I may need to re-evaluate my position, but until that happens, my trade setup remains valid.
Final Thoughts
My sell at 1.32480 is built on strong reasoning—key fundamental risks, extended technical levels, and a solid structure of resistance all favor a potential reversal. If sellers step in soon, I’ll have the opportunity to secure profits on a well-planned move. Now, it’s a waiting game to see how price reacts to resistance and upcoming data.
