GBP/USD – 15M Short Setup (NY Session)Took a short position after a clear rejection from a key supply zone right at the New York Open, following a strong bullish push during London.
🧠 Trade Idea & Confluences:
• Supply Zone: Price tapped into a 15M supply area, showing multiple rejections with wicks and bearish momentum.
• Structure Shift: Break of minor bullish structure – signaling a possible reversal.
• NY Open Volatility: Leveraging high volume for a strong move away from supply.
• EMA Confluence: Price losing the 20 EMA, now acting as dynamic resistance.
• Risk-to-Reward: Solid R:R (~3R), targeting an untapped demand zone and imbalance fill below.
🎯 Trade Setup:
• Entry: After bearish engulfing on rejection from supply
• Stop Loss: Above the recent high
• Take Profit: Into 15M demand zone, near previous Asian session highs
⸻
If you want, I can also add a few hashtags for better visibility:
#GBPUSD #SmartMoney #SupplyDemand #DayTrading #ForexStrategy #NYSession #PriceAction #15MChart #TradeSetup
GBPUSD.1.MINI trade ideas

GBPUSD My analysis for 4/10 8:55am. I’ve analyzed all the information—the price action, indicators, candlestick patterns, and the fresh fundamental news—and here’s why I believe this trade is compelling:
Overextension and Price Structure: Right now, the price is at 1.29490, which is significantly higher than the recent consolidation range of 1.281–1.285. This tells me that the market has pushed far beyond its comfort zone—a classic setup for a reversal pullback. I recognize this overextension as a warning sign that the rally might be overdone, especially when I consider the intraday price structure.
Candlestick Patterns and Timeframe Confluence: On the 1‑hour and 15‑minute charts, I’m seeing strong bearish candlestick formations like bearish marubozu and long-line bearish candles. These patterns show that sellers have been in control, and they typically indicate a clean, unimpeded move to the downside when a reversal begins. Even though there are some mixed signals on the weekly charts (with dojis and uncertain high waves suggesting indecision), the microstructure on the shorter timeframes tells me there's immediate selling pressure that I can exploit.
Indicator Confirmation: I’m also paying close attention to my indicators. The RSI on the 1‑hour chart is around 71, pushing into overbought territory, which signals that the upward momentum has likely peaked. Directional indicators, including the PLUS_DI versus MINUS_DI, further support a bias toward a corrective move downward. The ATR of approximately 0.00538 gives me a concrete measure of volatility, which I can use to set a well-defined stop-loss.
Fundamental Catalyst: The market’s recent surge has been partly driven by fresh fundamental news—contrasting tariff policies where the U.S. has relaxed tariffs while China hikes them. This divergence has spurred a burst of volatility and risk-off behavior. I see this fundamental news as amplifying the current overextension; the initial rally was impulsive, and now the fundamentals back the idea that the move isn’t sustainable.
Trade Setup and Risk Management: Based on this confluence, I plan to wait for a clear reversal signal on the lower timeframes—a bearish engulfing candle or a pin bar, ideally forming around 1.292–1.290. That’s when I would enter a short position. I’d set my stop-loss just above the recent highs (around 1.296–1.297) to accommodate normal volatility, as indicated by my ATR. For my profit target, I’m aiming for the support level around 1.278–1.281, which provides me with a favorable risk/reward ratio.
In summary, I believe this trade is attractive because the current price is clearly overextended relative to a recent consolidation, and the technical indicators (including bearish candlestick patterns and an overbought RSI) confirm that sellers have the upper hand in the short term. Coupled with the fundamental catalyst driving uncertainty, it makes sense for me to target a reversal pullback. Waiting for that confirmation around 1.292–1.290 with tight risk controls gives me confidence that I’m entering a high-confluence trade with strong downside potential.

GBPUSD Technical Analysis! SELL!
My dear friends,
Please, find my technical outlook for GBPUSD below:
The instrument tests an important psychological level 1.2924
Bias - Bearish
Technical Indicators: Supper Trend gives a precise Bearish signal, while Pivot Point HL predicts price changes and potential reversals in the market.
Target - 1.2858
About Used Indicators:
Super-trend indicator is more useful in trending markets where there are clear uptrends and downtrends in price.
Disclosure: I am part of Trade Nation's Influencer program and receive a monthly fee for using their TradingView charts in my analysis.
———————————
WISH YOU ALL LUCK

GBPUSD SELLA possible sell off on the GBPUSD pair. expecting a break of the trendline for a move downside to the 1hour target.

GBPUSD INTRADAY bullish continuation above 1.2765 support GBP/USD maintains a bullish bias, with the broader trend and structure supporting upside continuation. The recent intraday move appears to be a corrective pullback toward a key prior consolidation area.
Key Support: 1.2765 – aligns with the previous consolidation zone and potential bullish inflection point.
Upside Targets:
1.2935 – initial resistance level
1.2985 and 1.3026 – medium to long-term bullish targets
If price finds support at 1.2765 and forms a bullish reversal, it would confirm the continuation of the uptrend toward the mentioned resistance levels.
However, a break and daily close below 1.2765 would invalidate the bullish scenario, suggesting deeper retracement toward 1.2688, with further support at 1.2632 and 1.2600.
Conclusion
GBP/USD remains bullish above 1.2765. Look for a bounce from this level to confirm upside continuation. A daily close below 1.2765 would turn the outlook bearish, exposing lower support levels.
This communication is for informational purposes only and should not be viewed as any form of recommendation as to a particular course of action or as investment advice. It is not intended as an offer or solicitation for the purchase or sale of any financial instrument or as an official confirmation of any transaction. Opinions, estimates and assumptions expressed herein are made as of the date of this communication and are subject to change without notice. This communication has been prepared based upon information, including market prices, data and other information, believed to be reliable; however, Trade Nation does not warrant its completeness or accuracy. All market prices and market data contained in or attached to this communication are indicative and subject to change without notice.

GBP/USD Awaits CPI After Tariff-Driven GainGBP/USD hovered near 1.2830 on Thursday morning, holding its upward momentum for a third straight session. The pair remained supported as market sentiment improved following Trump’s tariff pause. All eyes are now on today’s U.S. inflation data, which is expected to influence the next move.
If GBP/USD breaks above 1.2860, resistance levels are at 1.2900 and 1.2940. Support is at 1.2715, followed by 1.2650 and 1.2600.

GU-Thu-10/04/25 Top down analysis-USD CPI todayAnalysis done directly on the chart
Trading is not easy, trading is not easy.
Whoever says the opposite is lying.
With right knowledge and experience you
make it simple but it's not easy.
Not financial advice, DYOR.
Market Flow Strategy
Mister Y

GBPUSD H4 | Bearish Reversal Based on the H4 chart, the price is approaching our sell entry level at 1.2885, a pullback resistance that aligns with the 38.2% Fibo retracement.
Our take profit is set at 1.2721, an overlap support.
The stop loss is set at 1.3009, a pullback resistance that aligns with the 61.8% Fibo retracement.
High Risk Investment Warning
Trading Forex/CFDs on margin carries a high level of risk and may not be suitable for all investors. Leverage can work against you.
Stratos Markets Limited (tradu.com):
CFDs are complex instruments and come with a high risk of losing money rapidly due to leverage. 63% of retail investor accounts lose money when trading CFDs with this provider. You should consider whether you understand how CFDs work and whether you can afford to take the high risk of losing your money.
Stratos Europe Ltd (tradu.com):
CFDs are complex instruments and come with a high risk of losing money rapidly due to leverage. 63% of retail investor accounts lose money when trading CFDs with this provider. You should consider whether you understand how CFDs work and whether you can afford to take the high risk of losing your money.
Stratos Global LLC (tradu.com):
Losses can exceed deposits.
Please be advised that the information presented on TradingView is provided to Tradu (‘Company’, ‘we’) by a third-party provider (‘TFA Global Pte Ltd’). Please be reminded that you are solely responsible for the trading decisions on your account. There is a very high degree of risk involved in trading. Any information and/or content is intended entirely for research, educational and informational purposes only and does not constitute investment or consultation advice or investment strategy. The information is not tailored to the investment needs of any specific person and therefore does not involve a consideration of any of the investment objectives, financial situation or needs of any viewer that may receive it. Kindly also note that past performance is not a reliable indicator of future results. Actual results may differ materially from those anticipated in forward-looking or past performance statements. We assume no liability as to the accuracy or completeness of any of the information and/or content provided herein and the Company cannot be held responsible for any omission, mistake nor for any loss or damage including without limitation to any loss of profit which may arise from reliance on any information supplied by TFA Global Pte Ltd.
The speaker(s) is neither an employee, agent nor representative of Tradu and is therefore acting independently. The opinions given are their own, constitute general market commentary, and do not constitute the opinion or advice of Tradu or any form of personal or investment advice. Tradu neither endorses nor guarantees offerings of third-party speakers, nor is Tradu responsible for the content, veracity or opinions of third-party speakers, presenters or participants.

GBPUSD Long?... not for long! Technical Analysis Summary (Multi-Timeframe View)
Price Structure & Patterns
Higher lows since April 8th = bullish market structure
Several bullish candles (belt-hold, closing marubozu, doji on higher TF) suggest momentum shift upward
The bearish harami on the 30-min adds caution — likely short-term consolidation, not reversal
Support & Resistance Zones
Support: 1.2785–1.2800 (prior rejection zone + buyer defense)
Current minor resistance: 1.2845–1.2855 (hit twice recently — strong short-term cap)
Next real resistance: 1.2890–1.2915 (April 7–8 highs)
Major resistance: 1.2935–1.2950 (where sellers aggressively capped rallies on April 7)
Indicators of Note
RSI on 1H = 72.56 → approaching overbought, which aligns with current resistance
MACD on 4H is positive = bullish momentum, though 1H MACD is nearly flat → move is maturing
ADX 1H = 44 → Strong trend
ATR 1H = 0.00358 (≈ 36 pips) → Expect that kind of volatility range
Fundamentals
April 9 FOMC Minutes: Hawkish
USD strength likely to return soon, but it hasn't crushed GBP yet.
April 10 CPI (coming up soon):
Expectations are slightly soft: CPI 2.6% vs previous 2.8%, Core CPI flat
If CPI misses → dollar weakens, GBP/USD rallies to next resistance
If CPI beats → USD strengthens, GBP/USD pullback likely
April 11 UK GDP and Trade
GDP expected positive (from -0.17% to +0.1%) → could support GBP
Option 1: Conservative TP (Safe Profit Lock-In)
TP1: 1.2860 = Just under current resistance
It's been tested a few times and could act as a double top if CPI hits strong.
Option 2: Moderate-Aggressive TP (Event Risk Carry)
TP2: 1.2870–1.2915 = Next resistance zone, April 7–8 top
Bullish structure + current momentum could extend if CPI is dollar-negative (inflation soft).
Good night everyone!

Gbpusd 9 Apr 2025 longVery attractive wave structure, should extend much higher if it works, else need low first before higher

BUY GBPUSDKeep buying GBPUSD. This pair is currently supper bullish. Any move down is a chance to enter more longs. The bulls are not tired just yet

GBPUSD buylooking at D1 and H4 time frames the market been in a downward trend, hitting a low on 1.21000.
my focus is on trends in trends, a formation of an uptrend on both H4 and H1 timeframes which indicates a very strong buy

GBPUSD in action #SELL LevelsAre sellers trying to set new record .. Sell side liquidity taken..this can be a whole twist in the story for buyers...

#GBPUSD #IDEA#GBPUSD #IDEA On M15 Gu i found some Sell Form on this TF so we will looking for confirm sell on M3 or M5

CHECK GBPUSD ANALYSIS SIGNAL UPDATE > GO AND READ THE CAPTAINTrade Setup:
Entry Zone: Around the 1.27950 area (highlighted with a blue box labeled "ENTRY POINT")
Stop Loss: Set at 1.27500 (marked in red below the entry zone)
Take Profit Levels:
TP1 (Take Profit 1): Approximately 1.28500
TP2 (Take Profit 2): Approximately 1.29000
Last Target: Approximately 1.29500
FALLOW RISK MANAGEMENT ✅

GBPUSD — Eyes on FOMC | Key Levels & Bearish Continuation SetupGBPUSD 4H Analysis
Technical Outlook — April 9, 2025
Currently trading around 1.2775, GBPUSD is showing signs of bearish momentum after breaking below the 200 EMA on the 4H timeframe.
Key Technical Highlights:
Price is currently stuck between resistance at 1.2800 - 1.2850 and support at 1.2700 - 1.2650.
Fib Cloud and moving averages are turning bearish.
Stochastic indicator is in the neutral zone but could provide momentum confirmation on breakdowns.
Immediate bearish targets are 1.2700 followed by 1.2600 and 1.2450 levels.
Possible Scenarios:
A pullback towards 1.2800 - 1.2850 resistance zone could attract sellers for the next leg down.
Clean break below 1.2700 could open doors for 1.2600 and 1.2450 support levels.
Important Note:
FOMC Rate Decision is scheduled for today — expect heightened volatility across USD pairs. Be cautious with risk management during the news event.
If you found this analysis valuable, kindly consider boosting and following for more updates.
Disclaimer: This content is intended for educational purposes only and does not constitute financial advice.

Ok i closed my sell for GBPUSD After my analysis this morning I decided to close my sell trade with very minimal profits. The trade was placed too early and I'd rather go along with the current trend instead of the overall trend. This will give me better positions.
Key Observations
Trend and Directional Indicators:
EMA (1.31338), DEMA (1.31573), and KAMA (1.31361) are positioned above the current price level, suggesting that the broader market remains bearish, or at least indecisive with downward pressure.
Aroon Oscillator (71.43) indicates a strengthening trend, which may confirm the continuation of the current movement.
The Directional Movement Index (DX ~18.31) suggests a relatively weak trend strength, but PLUS_DI (20.91) outweighing MINUS_DI (14.44) hints at potential bullish momentum building.
Momentum Indicators:
RSI (53.42) reflects neutral territory, which indicates neither overbought nor oversold conditions. It aligns with the notion of waiting for clearer signals.
MACD (0.00353) shows mild bullish divergence, suggesting potential upward momentum in the near term.
Chande Momentum Oscillator (6.85) supports modest bullish movement, but it’s not extreme.
Volatility and Price Action:
ATR (0.00422) and Standard Deviation (0.00303) suggest low volatility, providing an opportunity for tighter risk management (closer stop-loss and smaller targets).
Commodity Channel Index (CCI -67.63) indicates price trading near the lower end of typical levels, signaling potential support or stabilization.
Oscillators and Reversals:
Williams %R (-69.67) reflects a mildly oversold condition but not yet extreme—suggesting price may consolidate before a decisive move.
Ultimate Oscillator (64.66) aligns with balanced market sentiment, potentially pointing toward continuation rather than a reversal.

GBPUSD - Looking To Sell Pullbacks In The Short TermH1 - Strong bearish momentum
No opposite signs
Expecting bearish continuation until the two Fibonacci resistance zones hold
If you enjoy this idea, don’t forget to LIKE 👍, FOLLOW ✅, SHARE 🙌, and COMMENT ✍! Drop your thoughts and charts below to keep the discussion going. Your support helps keep this content free and reach more people! 🚀
--------------------------------------------------------------------------------------------------------------------
Disclosure: I am part of Trade Nation's Influencer program and receive a monthly fee for using their TradingView charts in my analysis.

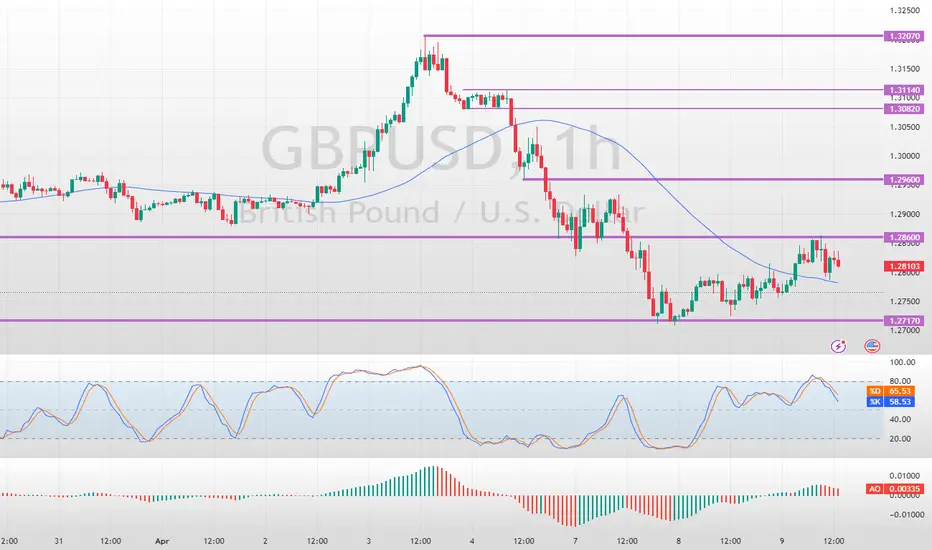
GBPUSD Made New Higher Highs amid Sell-offFenzoFx—GBP/USD trades bearish but is forming new higher highs with immediate resistance at $1.286. The next bullish target could be $1.2960 if bulls close and stabilize above this level.
Conversely, the bullish outlook should be invalidated if GBP/USD falls below $1.2717. If this scenario unfolds, the pound could fall toward the next support level at $1.2563.
The Day Ahead Wednesday, April 9 – Market Highlights
Economic Data:
US February Wholesale Trade Sales – Insight into inventory and business spending; may impact GDP outlook.
Japan March Consumer Confidence – Indicator of consumer sentiment; could influence JPY and equities.
Japan Machine Tool Orders – Key for industrial activity; relevant for JPY and manufacturing stocks.
Central Banks:
FOMC Meeting Minutes – Closely watched for clues on Fed’s rate path; could move Treasuries, USD, and equities.
Fed’s Barkin Speaks – May offer fresh policy signals.
BoJ Governor Ueda Speaks – Comments could affect JPY and Japanese bonds.
ECB’s Knot and Cipollone Speak – Potential impact on EUR if policy views are signaled.
RBNZ Rate Decision – Markets expect a hold; tone of statement may move NZD.
Earnings:
Seven & i Holdings – Insight into Japanese retail and consumer spending.
Delta Air Lines – Early look at travel demand and input costs; relevant for transport and consumer sectors.
Constellation Brands – Watch for trends in consumer demand and margins.
Auctions:
US 10-Year Note Auction – Key for rate sentiment; demand could impact yields and broader market tone.
This communication is for informational purposes only and should not be viewed as any form of recommendation as to a particular course of action or as investment advice. It is not intended as an offer or solicitation for the purchase or sale of any financial instrument or as an official confirmation of any transaction. Opinions, estimates and assumptions expressed herein are made as of the date of this communication and are subject to change without notice. This communication has been prepared based upon information, including market prices, data and other information, believed to be reliable; however, Trade Nation does not warrant its completeness or accuracy. All market prices and market data contained in or attached to this communication are indicative and subject to change without notice.

GBP/USD Today - Maintaining Uptrend🔔🔔🔔 GBP/USD news:
➡️ The British Pound (GBP) extended its previous day’s rebound, rising toward 1.2850 against the U.S. Dollar (USD) during Wednesday’s European session. The GBP/USD pair gained as the U.S. dollar remains under selling pressure amid growing concerns that the United States may enter a recession this year. TheU.S. Dollar Index (DXY), which measures the greenback against a basket of six major currencies, dropped sharply toward the 102.00 level.
➡️ A renewed escalation in the U.S.-China trade conflict has heightened fears of a U.S. trade conflict. recession. recession. On Tuesday, President Donald Trump signed an order raising tariffs on Chinese goods to 104% after Beijing responded with retaliatory measures. Trump also accused China of currency manipulation to offset the impact of higher tariffs.
Personal opinion:
➡️ The US-China trade war is getting hotter, which will be detrimental to the USD, supporting the GBP/USD currency pair. Therefore, GBP/USD remains within the uptrend line.
➡️ Analysis based on important resistance - support and Fibonacci levels combined with trend lines to come up with a suitable strategy
Plan:
🔆Price Zone Setup:
👉Buy GBP/USD 1.2815 – 1.2800
❌SL: 1.2760 | ✅TP: 1.2865 – 1.2900
FM wishes you a successful trading day 💰💰💰

Seller has coming to GBPUSDThe daily timeframe already shows signs of sellers entering the market. On the 1-hour timeframe, the low is already sweep, indicating a potential trend change on the 1-hour timeframe. To follow the trend, the entry area is located in the supply zone on the 15-minute and 30-minute timeframes.

GBPUSD(20250409)Today's AnalysisMarket news:
The U.S. Customs and Border Protection Agency reiterated that the specific tax rates for each country will be announced at 12:01 a.m. on April 9.
Technical analysis:
Today's buying and selling boundaries:
1.2764
Support and resistance levels:
1.2862
1.2825
1.2802
1.2726
1.2702
1.2666
Trading strategy:
If the price breaks through 1.2802, consider buying, the first target price is 1.2825
If the price breaks through 1.2764, consider selling, the first target price is 1.2726
