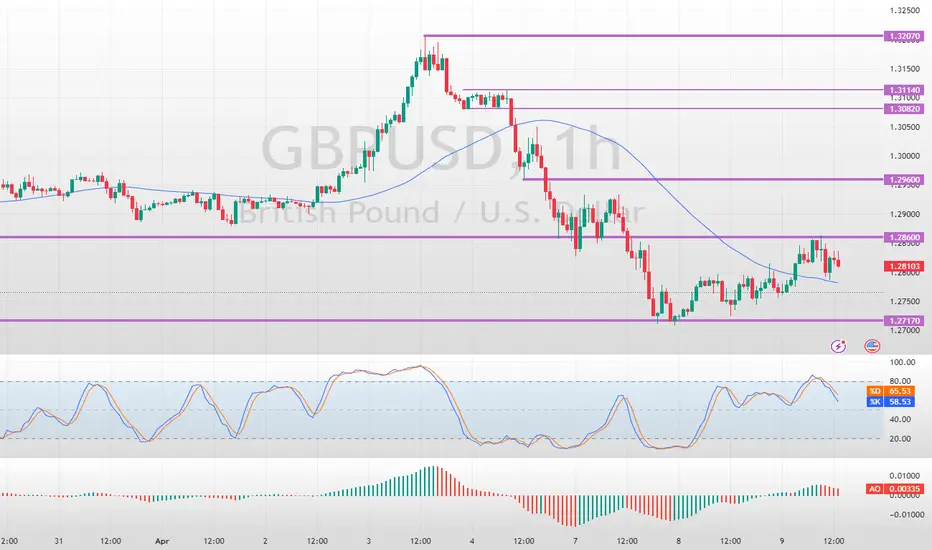
GBPUSD Made New Higher Highs amid Sell-offFenzoFx—GBP/USD trades bearish but is forming new higher highs with immediate resistance at $1.286. The next bullish target could be $1.2960 if bulls close and stabilize above this level.
Conversely, the bullish outlook should be invalidated if GBP/USD falls below $1.2717. If this scenario unfolds, the pound could fall toward the next support level at $1.2563.
GBPUSD.1.MINI trade ideas
The Day Ahead Wednesday, April 9 – Market Highlights
Economic Data:
US February Wholesale Trade Sales – Insight into inventory and business spending; may impact GDP outlook.
Japan March Consumer Confidence – Indicator of consumer sentiment; could influence JPY and equities.
Japan Machine Tool Orders – Key for industrial activity; relevant for JPY and manufacturing stocks.
Central Banks:
FOMC Meeting Minutes – Closely watched for clues on Fed’s rate path; could move Treasuries, USD, and equities.
Fed’s Barkin Speaks – May offer fresh policy signals.
BoJ Governor Ueda Speaks – Comments could affect JPY and Japanese bonds.
ECB’s Knot and Cipollone Speak – Potential impact on EUR if policy views are signaled.
RBNZ Rate Decision – Markets expect a hold; tone of statement may move NZD.
Earnings:
Seven & i Holdings – Insight into Japanese retail and consumer spending.
Delta Air Lines – Early look at travel demand and input costs; relevant for transport and consumer sectors.
Constellation Brands – Watch for trends in consumer demand and margins.
Auctions:
US 10-Year Note Auction – Key for rate sentiment; demand could impact yields and broader market tone.
This communication is for informational purposes only and should not be viewed as any form of recommendation as to a particular course of action or as investment advice. It is not intended as an offer or solicitation for the purchase or sale of any financial instrument or as an official confirmation of any transaction. Opinions, estimates and assumptions expressed herein are made as of the date of this communication and are subject to change without notice. This communication has been prepared based upon information, including market prices, data and other information, believed to be reliable; however, Trade Nation does not warrant its completeness or accuracy. All market prices and market data contained in or attached to this communication are indicative and subject to change without notice.

GBP/USD Today - Maintaining Uptrend🔔🔔🔔 GBP/USD news:
➡️ The British Pound (GBP) extended its previous day’s rebound, rising toward 1.2850 against the U.S. Dollar (USD) during Wednesday’s European session. The GBP/USD pair gained as the U.S. dollar remains under selling pressure amid growing concerns that the United States may enter a recession this year. TheU.S. Dollar Index (DXY), which measures the greenback against a basket of six major currencies, dropped sharply toward the 102.00 level.
➡️ A renewed escalation in the U.S.-China trade conflict has heightened fears of a U.S. trade conflict. recession. recession. On Tuesday, President Donald Trump signed an order raising tariffs on Chinese goods to 104% after Beijing responded with retaliatory measures. Trump also accused China of currency manipulation to offset the impact of higher tariffs.
Personal opinion:
➡️ The US-China trade war is getting hotter, which will be detrimental to the USD, supporting the GBP/USD currency pair. Therefore, GBP/USD remains within the uptrend line.
➡️ Analysis based on important resistance - support and Fibonacci levels combined with trend lines to come up with a suitable strategy
Plan:
🔆Price Zone Setup:
👉Buy GBP/USD 1.2815 – 1.2800
❌SL: 1.2760 | ✅TP: 1.2865 – 1.2900
FM wishes you a successful trading day 💰💰💰

Seller has coming to GBPUSDThe daily timeframe already shows signs of sellers entering the market. On the 1-hour timeframe, the low is already sweep, indicating a potential trend change on the 1-hour timeframe. To follow the trend, the entry area is located in the supply zone on the 15-minute and 30-minute timeframes.

GBPUSD(20250409)Today's AnalysisMarket news:
The U.S. Customs and Border Protection Agency reiterated that the specific tax rates for each country will be announced at 12:01 a.m. on April 9.
Technical analysis:
Today's buying and selling boundaries:
1.2764
Support and resistance levels:
1.2862
1.2825
1.2802
1.2726
1.2702
1.2666
Trading strategy:
If the price breaks through 1.2802, consider buying, the first target price is 1.2825
If the price breaks through 1.2764, consider selling, the first target price is 1.2726

GBPUSDopen trade
although trend is super bearish on 1d but
1- 4h mulitple fractals indicate retracement
2- above marked liq zone is nice level for target

GBPUSD I may have entered too early.. But im not backing out yet!
Observations from the Data
Trend Confirmation via Moving Averages: Several key moving averages and trend indicators (EMA at 1.30829, DEMA, HT Trendline at 1.31043, KAMA, Linear Regression) are positioned well above the current market level of 1.28234. This indicates that, on an hourly basis, the longer-term trend remains bearish.
Directional Indicators: The directional movement figures are very telling. With PLUS_DI at about 4.97 and MINUS_DI at around 31.38, sellers clearly dominate the market. A low DI(+) against a high DI(–) reinforces that the overall bias is to the downside.
Momentum & Oscillators:
The RSI is extremely low at ~15, indicating an oversold condition. In isolation, this might hint at a potential short-term bounce.
However, other momentum indicators, such as the Chande Momentum Oscillator (-70.09) and a slightly negative MACD (-0.00185), suggest that the underlying bearish momentum has been strong.
Oscillators like Williams %R (at -89.21) further underscore that the market is deep into oversold territory.
Volatility Metrics: An ATR of 0.0043 and relatively low standard deviation indicate modest volatility, meaning your stop-loss and target levels can be measured with reasonable precision.
Context and Rationale
Overall Trend: The majority of your trend-following indicators (e.g., EMA, DEMA, HT Trendline, KAMA) are positioned higher, confirming a prevailing bearish bias. Even though the RSI shows an extreme oversold reading (around 15), in a strong downtrend like this, oversold conditions can simply trigger a temporary bounce rather than a reversal. My sell entry at 1.27752 aligns with staying in the trend.
Directional Pressure: With the MINUS_DI (31.38) greatly outweighing the PLUS_DI (4.97), the directional movement clearly favors sellers. My entry at 1.27752 positions me within this selling pressure, assuming the bounce to fail and the downtrend to resume.
Entry Timing: Instead of waiting for a higher bounce ideal for a pullback short, my entry at 1.27752 suggests that I chose to capture a move early in the downswing or perhaps because price action broke a key support level. This could be advantageous if momentum continues as anticipated.
Why This Trade Setup Works
Alignment with Trend: Maintaining a sell position aligns with the overall bearish structure indicated by your moving averages and directional indicators.
Captchaing a Bounce Rejection: Even if a short-term bounce occurs from oversold conditions, your entry near 1.27752 could capture the early phase of a bearish continuation provided that the rally fails to sustain.
Confluence of Technical Signals: The combination of oversold conditions (which in a downtrend often predict a short-lived bounce) and the strong directional indication from MINUS_DI and related momentum oscillators creates a setup where a rejection of a minor recovery can lead to further downside moves.

GBP USD LONG SETUPBritish Pound has been in a strong downtrend channel, broke out and moving in an ascending Trendline structure to the upside, so we'll see how market plays out

GBPUSD(Good Trade Again)You can follow us for more Analysis(Images and Videos) with Precise definition of the Financial Market.

Afternoon Update GBPUSD 4/8 4:30pmWhere We Stand
Entry vs. Current Price: I placed a sell at 1.27752, and the current price is now 1.27982—about 0.0023 (or roughly 23 pips) above my entry. In other words, you’re in a slight, manageable loss.
Technical Context:
The moving averages (like the DEMA at 1.2953 and EMA at 1.30089) and the SAR (at 1.29789) remain well above the current price, which means the broader technical landscape still supports a bearish bias.
The directional indicators are favoring the downtrend (with minus DI significantly above plus DI) and even though the RSI is very low (around 20.4, indicating oversold conditions), in strong downtrends oversold readings can persist without triggering a full reversal.
The high ADX-related values (DX ~60.95) further suggest that the trend is robust, even if there’s a brief pullback.
Recent Price Action: On the daily chart, recent swings show that minor retracements can occur as the market digests news and key levels. The current price movement to 1.27982 may simply be a short-term bounce rather than a change in sentiment.
Fundamental Environment: With upcoming news (like the FOMC minutes on April 9th and additional US/UK data later in the week) adding volatility, the market might briefly test higher levels. However, these fundamentals haven’t yet overturned the prevailing technical context.
What to Consider
Hold with Caution: Given that the overall bearish structure, along with key technicals (moving averages, SAR, and directional indicators), still supports a downtrend, keeping the trade is reasonable. The slight pullback above your entry can be viewed as a temporary retracement.
Risk Management:
Watch Key Levels: Monitor if the price decisively holds above a certain level (say, if it pushes well above 1.2800 with strong momentum). That could signal the potential for a sustained reversal—in which case I might need to exit or partially close your position.
Upcoming Fundamental News: The scheduled data releases can spike volatility. Be prepared for erratic price action around these events. It might be wise to reduce my position size or set alerts to protect your downside if the trade starts to move against you.
Recommendation
I lean toward keeping the trade because:
The overall technical setup (moving averages, SAR, and directional movement) remains bearish.
The recent pullback appears to be minor and doesn’t breach key resistance levels that might signal a reversal.
RSI oversold conditions in a strong downtrend aren’t uncommon, so while they may indicate potential for a bounce, they don’t necessarily negate the downtrend.

GBP/USD possible bear set up/sell offAscending wedge channel 70% of bear breakout. We have 3 HHs printed with a possible 4th. We are currently in a strong bear trend. So trading with the trend here. Biggest target is a daily target. If a certain support level breaks on the daily I will target the wedge channel fill from the daily.

Round three? GBPUSDGBPUSD is in a clear short term downtrend, and i think it's going to perform the last downside move before bouncing back. I expect a breakout to the downside from the flag pattern that is forming, like happend in the previous two setup.

Lets Talk about GBPUSD..Trade Setup: Short GBP/USD
Entry: Sell now!
Stop Loss: Place your stop just above the recent intraday swing high. A level around 1.2790 offers a buffer in case of whipsaw moves.
Take Profit: With the risk defined by the difference between 1.2790 and your entry near 1.2725 (approximately 0.0065, or 65 pips), aiming for a reward roughly twice that size can be attractive. Setting a target near 1.2580 gives you a risk/reward ratio around 1:2.2. This level is in the vicinity of prior support from the day’s price action.
Rationale
Technical Overbought Signals: The elevated RSI, Stochastic, CCI, and Ultimate Oscillator values suggest that buyers might be exhausted and a pullback is due. With oscillators teetering in the overbought zone, the market’s momentum appears at risk of reversing.
Directional Indicators: The fact that the minus DI is significantly higher than the plus DI indicates that downward pressure is gaining strength, even though the ADX (≈21.65) and ADXR (≈23.32) hint that the trend isn’t yet fully solidified. This sets the stage for a potential reversal from an overextended area.
Price Action & Key Levels: Today’s price action has been squeezed into a narrow range with support clustered around 1.272–1.273 (supported by DEMA and SAR levels). A confirmed break below this zone would likely trigger further selling into established support areas.
Fundamental Surprises: With the mix of U.S. and U.K. fundamentals on the horizon this week, be mindful of possible volatility. If, for example, UK data comes in stronger than expected, it might buoy the GBP despite the technical caution—at which point you might re-assess or even consider a counter-trend long if the pullback reverses.

#GBPUSD #IDEA#GBPUSD #IDEA On today idea i looking for Buy on GU i Will using m3 or M5 for confirm my entry

Gbp/Usd Harmonic PatternFX:GBPUSD
Bearish bat pattern in making TF 30 mins
Market is completing it's C-D leg .
After completion of C-D leg , take sell trade and target for 0.382%


GBPUSD Is Very Bearish! Short!
Here is our detailed technical review for GBPUSD.
Time Frame: 9h
Current Trend: Bearish
Sentiment: Overbought (based on 7-period RSI)
Forecast: Bearish
The market is approaching a significant resistance area 1.277.
Due to the fact that we see a positive bearish reaction from the underlined area, I strongly believe that sellers will manage to push the price all the way down to 1.256 level.
P.S
Overbought describes a period of time where there has been a significant and consistent upward move in price over a period of time without much pullback.
Disclosure: I am part of Trade Nation's Influencer program and receive a monthly fee for using their TradingView charts in my analysis.
Like and subscribe and comment my ideas if you enjoy them!

The peak is so close IMO... thoughts?So I've been tracking this idea for a couple of weeks.
I think based on fractal pattern theory, that this is about to start dropping out, and really fast?
Have a look at my previous GPBUSD idea, and you'll get an idea of what I've been thinking.
I might be wrong, but I post because I want to hear alternative ideas, so fire away.
As it stands, it looks like we need a big drop out/correction, and so have been holding a short position from 1.9557 as it's hard to truly predict when a drop out might happen.
I've highlighted key support areas with circles - I'll update my idea as it hits each one, but I would'nt be surprised it we eventually got down to 1.7000 range (pink circle).
I'd like to see a drop back to the green arrow/blue trend line, then we break further to the downside.
The chart to the top left is a BTC chart which I use as a template to track where in the uptrends/downtrends. If you look at my last idea, you'll get an idea of what I'm on about and why I think we are where we are.
We've got UK unemployment rate coming up Thursday + UK interest rates which could be the catalyst I'm looking for to the down side.

GBP Falls as Trade Tensions Fuel RecessionThe British pound fell to $1.28, its lowest since March 4, as Trump’s trade policies fueled recession fears. After China imposed 34% tariffs on U.S. goods, markets raised BoE rate cut bets. Traders now price in 88 bps of cuts by December, up from 43 bps in March, with a 90% chance of a 25bps cut in May.
If GBP/USD breaks above 1.2850, resistance levels are at 1.2900 and 1.2940. Support is at 1.2715, followed by 1.2650 and 1.2600.

GBP/USD 2 Best Scenarios For Me To Get 250 Pips ! Here is my opinion on GBP/USD , If we checked the dxy we will see that the price making a good waves at te moment so i`m looking to sell GBP/USD If the price go back a little and give me a good bearish Price Action to can enter a sell trade , highest place will be the best place for me cuz it will be safe and sl will be small , but if the price hit the second place and give me a good bearish price action i will enter a sell trade with smal lotsize and targeting 250 Pips .
This Is An Educational + Analytic Content That Will Teach Why And How To Enter A Trade
Make Sure You Watch The Price Action Closely In Each Analysis As This Is A Very Important Part Of Our Method
Disclaimer : This Analysis Can Change At Anytime Without Notice And It Is Only For The Purpose Of Assisting Traders To Make Independent Investments Decisions.

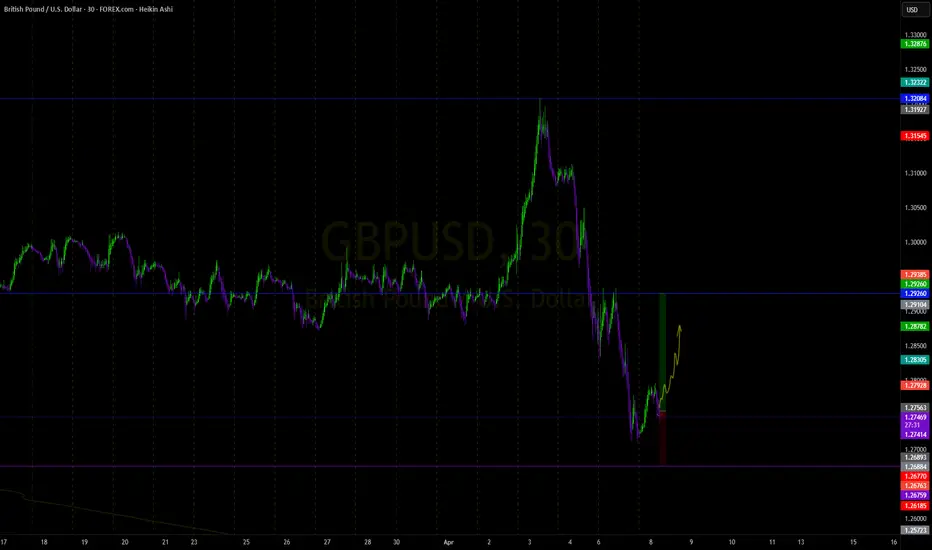
GBP/USDCable showing potential for a bullish continuation following recent support around the 1.2675 area. Entered long at 1.27507, with stops just below recent lows at 1.26759, and a target of 1.29260 aligning with previous resistance and measured move structure.
Risk/reward setup favors patience on this one — will monitor for clean price action and momentum confirmation above 1.2800 for added confidence.
Key Levels:
Entry: 1.27507
Stop: 1.26759
Target: 1.29260
Let’s see how it plays out — trade safe and stay disciplined.
GBP/USD small sell: Reversal Pattern in PlayHello,
A clear reversal pattern is forming on GBP/USD, presenting a short-term selling opportunity toward the pattern's lower boundary. The pair remains under pressure as the US Dollar attempts to recover losses from the past two sessions. However, downside movement could be limited, given the Greenback’s vulnerability.
Meanwhile, the Pound Sterling (GBP) may find additional support ahead of Thursday’s Bank of England (BoE) policy meeting. Markets expect the BoE to maintain its current interest rates, balancing weak economic growth with persistent inflation risks. In February, the central bank lowered rates to 4.5% and revised its 2025 growth forecast downward to 0.75%, citing concerns over tax hikes and global trade uncertainties.
Given the current setup, I see an opportunity for a short position from current levels or slightly higher. The GBPNZD has already moved in alignment with this setup, adding further conviction to the trade. see below
Disclosure: I am part of Trade Nation's Influencer program and receive a monthly fee for using their TradingView charts in my analysis.

Ict lsmmsfvgLiquidity sweep into market structure shift entry into fvg to take profit in an imbalance at equilibrium levels
