GBPUSD: Strong Bullish Market 🇬🇧🇺🇸
GBPUSD set a new daily high today.
The pair remains in a strong bullish momentum since 8th of April.
With the complete absence of high impact fundamentals today, buying pressure
may persist.
I believe that it may continue rising at least to 1.33 - the closest historic resistance.
❤️Please, support my work with like, thank you!❤️
I am part of Trade Nation's Influencer program and receive a monthly fee for using their TradingView charts in my analysis.
GBPUSD.1.MINI trade ideas

Gbpusd support sell signal GBP/USD could face immediate resistance at 1.3200 (static level) ahead of 1.3270 (static level) and 1.3300 (round level). On the downside, first support could be spotted at 1.3150 (static level) before 1.3100 (round level, static level) and 1.3040 (static level).
GBP/USD rose three-quarters of one percent on Monday, climbing for a fifth straight trading session as the Pound Sterling continues to reclaim ground against the softening Greenback.

Market Analysis: GBP/USD Rockets HigherMarket Analysis: GBP/USD Rockets Higher
GBP/USD is gaining pace above the 1.3220 resistance.
Important Takeaways for GBP/USD Analysis Today
- The British Pound is attempting a fresh increase above 1.3220.
- There is a key bullish trend line forming with support near 1.3245 on the hourly chart of GBP/USD at FXOpen.
GBP/USD Technical Analysis
On the hourly chart of GBP/USD at FXOpen, the pair remained well-bid above the 1.2850 level. The British Pound started a decent increase above the 1.3000 zone against the US Dollar.
The bulls were able to push the pair above the 50-hour simple moving average and 1.3150. The pair even climbed above 1.3200 and traded as high as 1.3263. It is now consolidating gains and trading well above the 23.6% Fib retracement level of the upward move from the 1.3030 swing low to the 1.3263 high.
On the upside, the GBP/USD chart indicates that the pair is facing resistance near 1.3260. The next major resistance is near 1.3320. A close above the 1.3320 resistance zone could open the doors for a move toward 1.3450.
Any more gains might send GBP/USD toward 1.3500. On the downside, there is a key support forming near a bullish trend line at 1.3245.
If there is a downside break below 1.3245, the pair could accelerate lower. The next major support is at 1.3145. It is close to the 50% Fib retracement level of the upward move from the 1.3030 swing low to the 1.3263 high.
The next key support is seen near 1.3030, below which the pair could test 1.2860. Any more losses could lead the pair toward the 1.2745 support.
This article represents the opinion of the Companies operating under the FXOpen brand only. It is not to be construed as an offer, solicitation, or recommendation with respect to products and services provided by the Companies operating under the FXOpen brand, nor is it to be considered financial advice.

GBPUSD Analysis Today: Technical and Order Flow !In this video I will be sharing my GBPUSD analysis today, by providing my complete technical and order flow analysis, so you can watch it to possibly improve your forex trading skillset. The video is structured in 3 parts, first I will be performing my complete technical analysis, then I will be moving to the COT data analysis, so how the big payers in market are moving their orders, and to do this I will be using my customized proprietary software and then I will be putting together these two different types of analysis.

GBPUSD Analysis – Bearish Setup From Premium ZoneAfter a strong bullish rally, GBPUSD is now tapping into a premium zone just below 1.32800–1.33000, an area aligned with an FVG (Fair Value Gap) and potential liquidity grab. The pair looks set for a short-term correction before any further continuation.
🔍 Key Elements of This Analysis:
Premium Price Zone: Price has entered a high-probability reversal zone after a sustained bullish move, reacting within a supply/FVG area.
Liquidity Consideration: Buy-side liquidity above recent highs is likely to be swept before any downside move gains momentum.
Bearish Bias: My short bias is based on exhaustion near premium levels and the potential for a correction into previous demand zones.
🎯 Target Levels:
TP1: 1.3050 (first structure break zone)
TP2: 1.2957 (imbalance fill level)
TP3: 1.2846 (golden retracement zone / higher timeframe demand)
🛡️ Risk Management:
The stop-loss is placed above the previous high at 1.3374, protecting against unexpected breakouts. Entry is based on confirmation of price rejection inside the FVG area.
This trade idea follows my model combining liquidity sweeps, FVGs, and price action within premium zones — staying aligned with macro structure and clean execution.
— Emerson Massawe

GBPUSD Set To Fall! SELL!
My dear followers,
This is my opinion on the GBPUSD next move:
The asset is approaching an important pivot point 1.3239
Bias - Bearish
Safe Stop Loss - 1.3308
Technical Indicators: Supper Trend generates a clear short signal while Pivot Point HL is currently determining the overall Bearish trend of the market.
Goal - 1.3099
About Used Indicators:
For more efficient signals, super-trend is used in combination with other indicators like Pivot Points.
Disclosure: I am part of Trade Nation's Influencer program and receive a monthly fee for using their TradingView charts in my analysis.
———————————
WISH YOU ALL LUCK

GBPUSD buy We have to retest the place where we came from , i hope market does this . Today is no significant news to impact price with spikes , so naturally trend line has been broken and we should head atleast for retest.
3.5 RRR
GL Traders
Not ADVICE !

GBPUSD PRIMED FOR SELLS-GBPUSD has had quite the volatility in the past weeks, creating this very overextended climb into this major weekly support.
-Weekly RSI approaching 68, I would never consider taking a trade solely on rsi; however it adds nice conviction in confluence with levels and price action.
-Will be looking for shift of structure at this major level on the 4hr timeframe to take advantage of some sells.
[/url

GBPUSD approaching Daily Supply ZoneGBPUSD approaching Daily Supply Zone
Expected to take daily supply and retrace before further up journey

GBP/USD Breaking Key Fib Level, Bulls Eye September HighsThe British pound surged through the 78.6% Fib retracement near 1.3149, extending its post-breakout rally with a +0.77% daily gain. Price is now on track to test the September swing high at 1.3440 — the next major resistance zone.
📈 Price has reclaimed both the 50- and 200-day SMAs
📊 MACD is showing bullish momentum above the zero line
📍 RSI sits at 64.98 — bullish, but nearing overbought territory
As long as GBP/USD holds above 1.3149, the path of least resistance remains higher. A clean break above 1.3440 would confirm a major trend reversal and open the door to a broader bullish cycle.
-MW

UPDATE ON GBP/USD TRADEGBP/USD 15M - Wow, as you can see price is playing out really well for us, as it approaches the last high its important that we manage our trade accordingly, I have gone ahead and taken a partial.
I want to see price break the last high, once it does it will confirm that the low set where we have entered in on this market is seen as protected which as a result should mean our entry is safe.
This trade is currently running + 56 pips. (+ 2.4%) 2.4RR
A big well done to all involved, if you have any questions with regards to the trade or the analysis itself then please drop me a message or comment below and I will get back to you as soon as possible.
Ensure you are managing your running trades correctly, taking partials throughout the position and applying safety measures, a big well done to all of you!

Short-term correction after overbought🔔🔔🔔 GBP/USD news:
➡️ GBP/USD is holding modest bids near the 1.3200 mark during early European trading on Tuesday. Recent UK data revealed that the unemployment rate remained steady at 4% for the three months to February, while average earnings came in weaker than expected, putting downside pressure on the British pound.
➡️ After gaining nearly 1% on Friday and closing the previous week up 1.5%, GBP/USD continued its upward momentum on Monday, trading above the 1.3150 level. Although the pair’s short-term technical outlook suggests overbought conditions, investors may be hesitant to anticipate a significant pullback due to widespread selling pressure on the U.S. dollars (USD).
TheU.S. Dollar Index, which measures the greenback’s performance against a basket of six major currencies, dropped 3% last week as escalating U.S.-China trade fears of a potential U.S. economic downturn.
Personal opinion:
➡️ The uptrend is still strong while the USD is being sold.
➡️ However, the overbought zone of RSI should also be taken seriously, this will be the reaction zone of the selling side.
➡️ Analysis based on important resistance - support zones and Fibonacci combined with RSI to come up with a suitable strategy
Plan:
🔆Price Zone Setup:
👉Sell GBP/USD 1.3265 - 1.3275
❌SL: 1.3310| ✅TP: 1.3210 - 1.3160
FM wishes you a successful trading day 💰💰💰

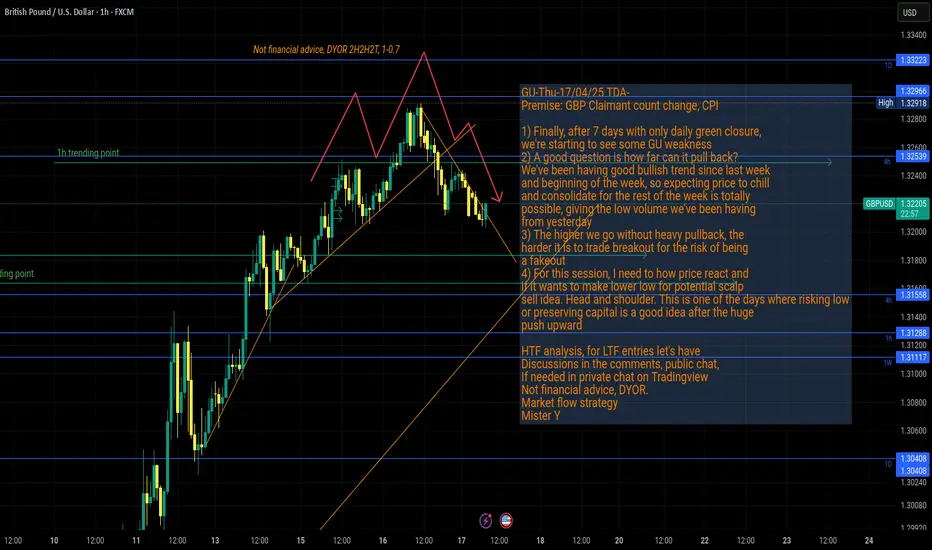
GU-Thu-17/04/25 TDA-GU starting to pullback, how far can it go?Analysis done directly on the chart
Low volume since yesterday, good
push upward since last week, will
we see some consolidation for the
rest of the week?
Not financial advice, DYOR.
Market Flow Strategy
Mister Y
GBPUSD SHORT FORECAST Q2W W16 D17 Y25GBPUSD SHORT FORECAST Q2W W16 D17 Y25
GM GM!
- Potential 15' OB Short
- Potential 5' OB Short, lower time frame Break of structure via level
- Potential
SUMMARY
- Weekly order block rejection is the setup
- Required 15' Breaks of structure
FRGNT X

GBPUSD macro viewnotice the bullish flow sweeping swing lows and rallying higher. This has brought my attention to the equal highs on the monthly and also checking my indicator u can see the close back in the M range and higher pricing is suggested. we already retested the Wfvg where price reacted from and getting another push higher will suggest a break of that high.
As far as my model and strategy i do not trade on mondays so i will sit on my hands to see how the daily candle closes so we trade the expansion for the rest of the week. Mondays can be reversals setting up for tuesdays/wed high of the week or low... anyways the strategy here is trading the weekly/daily range. have an amazing week guys.


GBP-USD Free Signal! Buy!
Hello,Traders!
GBP-USD is trading in an
Uptrend and the pair is
About to retest a horizontal
Support level of 1.3181
From where we will be
Expecting a local rebound
As we are locally bullish biased
So we can enter a long trade
With the Take Profit of 1.3290
And the Stop Loss of 1.3147
Buy!
Comment and subscribe to help us grow!
Check out other forecasts below too!
Disclosure: I am part of Trade Nation's Influencer program and receive a monthly fee for using their TradingView charts in my analysis.

GBPUSD Analysis 10:40am 4/16Here’s my updated resistance zone analysis for GBP/USD, combining all the technical and fundamental data:
Resistance Levels & Why They Matter
1.3265 – Immediate Resistance
GBP/USD tested this level today, and it acted as a short-term barrier.
This level aligns with recent swing highs and pivot point calculations, making it a key area where sellers may step in.
1.3305 – Next Resistance Zone
If price breaks above 1.3265, the next resistance is around 1.3305, based on historical price action and pivot analysis.
This level has previously acted as a turning point, meaning traders may look to take profit or enter short positions here.
1.3430 – Stronger Resistance
This level was identified in recent market analysis as a former multi-month high.
If GBP/USD continues its bullish momentum, this could be a major resistance zone where price struggles to push higher.
1.3640 – Long-Term Resistance Target
If GBP/USD breaks above 1.3430, the next major resistance sits at 1.3640, which has historically been a strong reversal point.
This level represents a significant psychological barrier, where traders may reassess the trend direction.
How I Derived These Levels
Price Action Review: I analyzed recent swing highs and lows to identify key turning points.
Pivot Point Calculations: Using the formula (High + Low + Close)/3, I confirmed resistance zones that align with historical price behavior.
Market Analysis: External sources also highlighted 1.3430 and 1.3640 as critical resistance levels2.
Moving Averages & Trendlines: These levels coincide with key moving averages, reinforcing their importance.
Final Thoughts
With GBP/USD currently at 1.32464, I’m watching 1.3265 as the immediate resistance. If price breaks above that, 1.3305 is the next target, followed by 1.3430 and 1.3640 for longer-term moves. These levels are based on a combination of technical indicators, price action, and external market analysis.
PLEASE BE ADVISED THAT THINGS CAN CHANGE..! PLEASE FOLLOW MY ANALYSIS TO OBTAIN ANY UPDATED INFO REGARDING GBPUSD.

GBPUSD Analysis - Weekly Market Analysis This is my weekly market analysis, specifically for GBPUSD.
I share what I think is going to happen in terms of the PDA Matrix as it pertains to ICT concepts, as well as time considerations such as economic news events.
I hope you find it insightful in your trading.
- R2F Trading

GBPUSDMy option about gbpusd Is more bullish so that zone is good and strong support,if the price comes to that zone it can pullback

GBPUSD H4 I Bearish Drop Based on the H4 chart analysis, we can see that the price is testing our sell entry at 1.3260, which is a pullback resistance.
Our take profit will be at 1.3166, an overlap support level.
The stop loss will be placed at 1.3368, above the 127.2% Fibo extension.
High Risk Investment Warning
Trading Forex/CFDs on margin carries a high level of risk and may not be suitable for all investors. Leverage can work against you.
Stratos Markets Limited (tradu.com):
CFDs are complex instruments and come with a high risk of losing money rapidly due to leverage. 63% of retail investor accounts lose money when trading CFDs with this provider. You should consider whether you understand how CFDs work and whether you can afford to take the high risk of losing your money.
Stratos Europe Ltd (tradu.com):
CFDs are complex instruments and come with a high risk of losing money rapidly due to leverage. 63% of retail investor accounts lose money when trading CFDs with this provider. You should consider whether you understand how CFDs work and whether you can afford to take the high risk of losing your money.
Stratos Global LLC (tradu.com):
Losses can exceed deposits.
Please be advised that the information presented on TradingView is provided to Tradu (‘Company’, ‘we’) by a third-party provider (‘TFA Global Pte Ltd’). Please be reminded that you are solely responsible for the trading decisions on your account. There is a very high degree of risk involved in trading. Any information and/or content is intended entirely for research, educational and informational purposes only and does not constitute investment or consultation advice or investment strategy. The information is not tailored to the investment needs of any specific person and therefore does not involve a consideration of any of the investment objectives, financial situation or needs of any viewer that may receive it. Kindly also note that past performance is not a reliable indicator of future results. Actual results may differ materially from those anticipated in forward-looking or past performance statements. We assume no liability as to the accuracy or completeness of any of the information and/or content provided herein and the Company cannot be held responsible for any omission, mistake nor for any loss or damage including without limitation to any loss of profit which may arise from reliance on any information supplied by TFA Global Pte Ltd.
The speaker(s) is neither an employee, agent nor representative of Tradu and is therefore acting independently. The opinions given are their own, constitute general market commentary, and do not constitute the opinion or advice of Tradu or any form of personal or investment advice. Tradu neither endorses nor guarantees offerings of third-party speakers, nor is Tradu responsible for the content, veracity or opinions of third-party speakers, presenters or participants.

GBP/USD Ready to Fly! 📢 GBP/USD Ready to Fly! 🚀
📈 Looking bullish from Weekly Bullish FVG 50% Level 🎯
✅ Waiting for confirmation before entry!
🎯 Target: Bearish Extreme Order Block
🔥 Don't miss the move! Stay updated – Follow our TradingView page! 📊

A rejection near current resistanceEntry after confirmation of bearish momentum.
Confirm with momentum indicators (e.g., RSI divergence or MACD crossover)
Targeting a move back toward previous structure lows.
