Falling towards pullback support?GBP/USD is falling towards the support level which is a pullback support that aligns with the 61.8% Fibonacci retracement and could bounce from this level to our take profit.
Entry: 1.3004
Why we like it:
There is a pullback support level that lines up with the 61.8% Fibonacci retracement.
Stop loss: 1.2874
Why we like it:
There is a pullback support level.
Take profit: 1.3208
Why we like it:
There is a pullback resistance level.
Enjoying your TradingView experience? Review us!
Please be advised that the information presented on TradingView is provided to Vantage (‘Vantage Global Limited’, ‘we’) by a third-party provider (‘Everest Fortune Group’). Please be reminded that you are solely responsible for the trading decisions on your account. There is a very high degree of risk involved in trading. Any information and/or content is intended entirely for research, educational and informational purposes only and does not constitute investment or consultation advice or investment strategy. The information is not tailored to the investment needs of any specific person and therefore does not involve a consideration of any of the investment objectives, financial situation or needs of any viewer that may receive it. Kindly also note that past performance is not a reliable indicator of future results. Actual results may differ materially from those anticipated in forward-looking or past performance statements. We assume no liability as to the accuracy or completeness of any of the information and/or content provided herein and the Company cannot be held responsible for any omission, mistake nor for any loss or damage including without limitation to any loss of profit which may arise from reliance on any information supplied by Everest Fortune Group.
GBPUSD.1.MINI trade ideas

GBP/USD Technical Outlook: Elliott Wave Mapping the Next MoveThis GBP/USD 4H chart presents an Elliott Wave analysis.
Wave (1) and (2): The market had an impulsive bullish movement in Wave 1, followed by a corrective Wave 2.
Wave (3): A strong bullish move with momentum.
Wave (4): A corrective phase, forming a triangle pattern (a-b-c-d-e), which suggests the market is preparing for another impulsive leg.
Entry Confirmation: A breakout above the triangle pattern.
First Target: 1.31457 (Fibonacci 0.382)
Second Target: 1.32105 (Fibonacci 0.5)

IDEA FOR GBP/USD NEXT WEEKGBP/USD 1H - Now that we have seen price trade us up and into the Supply Zone above, this may encourage price to take a move back to the downside, given enough Supply has been introduced.
I would like to see price now trade us back up and into the Order Block that has been left behind, just to clear any remaining orders to the upside before the down move. In order for us to enter we want further confirmation.
This will come from price trading up and into the Supply Zone marked out, breaking structure fractally as displayed above. This would confirm the end of the correction and the start of the next impulse taking us lower.
Once we have this, we can then begin looking for areas to enter in short on this market. I will want to see price pullback a final time more fractally to give us the opportunity to enter, and illustration of this can be seen above.

Skeptic | GBP/USD Deep Dive: Major Trend, Trade Setups!Hey guys, welcome back! 👋 I'm Skeptic.
Let’s dive into GBP/USD , a pair that’s been in a strong uptrend and has the potential for another solid price jump. We’ll break it down across multiple timeframes , do a deep analysis , and at the end, I’ll share high-probability long & short setups with clear triggers—so stick around!
Daily Timeframe Analysis
As you can see, GBP/USD has been respecting an uptrend channel , reacting well to both the upper, lower, and midlines —a key characteristic of a strong trend. Each time price makes a jump, it enters a range box (re-accumulation phase) before breaking out to continue the trend.
Currently, we’re inside another range between 1.28720 - 1.29883 . A breakout in either direction can give us a trading opportunity, but given the major trend is bullish , I prefer trading in the direction of the trend unless we get a clear reversal signal.
4H Timeframe Analysis
The uptrend channel remains intact , and we’re still within the Consolidation phase . We recently saw a fake breakout , which could mean that the next breakout might happen with stronger momentum.
Trade Setups
✅ Long Setup:
- Entry: After a confirmed breakout of 1.29883
- Confirmation: RSI breaking above 65.33 (which acts as an overbought signal in this case)
- Preferred Order: Stop Buy above resistance to catch momentum
❌ Short Setup:
- Entry: After a confirmed break of 1.28682
- Risk Management: Since this is against the trend, take quick profits and use a tighter SL to manage risk efficiently.
What are your thoughts on GBP/USD? Drop your opinions in the comments! Let’s grow together, not alone. 🚀🔥

Cable Is Trading Impulsively HigherCable is making a very nice and strong extension higher on the 4-hour time frame, so it appears to be impulsive. We should be aware of further upside, especially as the market has broken out of a base channel, which typically happens within wave three of three.
In fact price is now even higher after a triangle in wave four so wave 5 of red (3) is in progress as expected, but it can target 1.32, so be aware of a new red higher degree wave (4) correction before the bullish trend for wave (5) resumes. Ideal support is at 1.29 – 1.28 area.

EDUCATION: The $5 Drop: How Trump’s Tariffs Sent Oil TumblingOil markets don’t move in a vacuum. Politics, trade wars, and global economic shifts all play a role in price action. Case in point: the recent $5 drop in oil prices following Trump’s latest tariff announcement.
What Happened?
Markets reacted swiftly to Trump’s renewed push for tariffs, targeting key trading partners. The result? A ripple effect that sent oil prices tumbling as traders anticipated lower global demand. The logic is simple—higher tariffs slow trade, slowing trade weakens economies, and weaker economies use less oil.
Why It Matters to Traders
For traders, this kind of volatility is both an opportunity and a risk. Sharp price drops like this shake out weak hands while rewarding those who position themselves with clear strategies. If you trade crude oil, understanding the macro picture—beyond just supply and demand—can make or break your positions.
The Next Move
Is this just a knee-jerk reaction, or the start of a larger trend? Smart traders are watching key levels, tracking institutional order flow, and looking for confirmation before making their next move.
How do you react when headlines move the market? Do you panic, or do you position yourself with a plan? Drop a comment and let’s talk strategy.

GBPUSD "Buy"We still have opportunity to go LONG on GBPUSD since the premium isn't filled.Remember the Supply zone must be taken before possibly change ideas for maybe short.
As for me,I predict the USD pairs to continue going LONG still supply is swept ✍️

GUWe have tapped into a key supply zone. We are at some key zones on the fibb as well. I expect to see GU drop here.

GBPUSD Short Term Buy IdeaM15 - Strong bullish momentum
No opposite signs
Expecting retraces and further continuation higher until the two Fibonacci support zones hold.
If you enjoy this idea, don’t forget to LIKE 👍, FOLLOW ✅, SHARE 🙌, and COMMENT ✍! Drop your thoughts and charts below to keep the discussion going. Your support helps keep this content free and reach more people! 🚀
--------------------------------------------------------------------------------------------------------------------
Disclosure: I am part of Trade Nation's Influencer program and receive a monthly fee for using their TradingView charts in my analysis.

Trading GBPUSD | Judas Swing Strategy 25/03/2025We had a good trading session with the Judas Swing Strategy two weeks ago, as the strategy delivered 3 solid setups, 2 on FX:EURUSD and 1 on $GBPUSD. And guess what? All three hit their targets!
That’s a massive 6% gain for the week! And with these impressive results we wanted to see how the strategy will perform last week.
The strategy did not produce any setups on the currency pair we monitor ( FX:EURUSD , FX:GBPUSD , FX:AUDUSD , OANDA:NZDUSD ) on Monday 24th March and instead of forcing setups like other traders would we sat that day out. Why was this possible? we had backtested the strategy and had enough data to prove that when we stick to this strategy long term we'd be in putting ourselves in a profitable position.
On Tuesday, we returned to the trading desk, scouting for setups, when we noticed a potential opportunity on $GBPUSD. The currency pair had swept liquidity at the high of our zone, signaling a possible shift in direction. We then shifted our focus to selling opportunities for the session. Our strategy required waiting for a break of structure to the downside, followed by a retracement into the FVG before executing a trade
After waiting for an hour and 15 minutes, we finally got the break of structure to the downside. The only step left was a retrace into the FVG. After some patience, the retrace materialized, meeting all the criteria on our entry checklist. We executed the trade, risking 1% of our account with a target return of 2%
Trade Details:
Entry: 1.29513
Stop Loss: 1.29611
Take Profit: 1.29311
After entering the trade, price consolidated around our entry point for a while, showing no clear direction. However, we remained unfazed, trusting our well-backtested strategy, which has a 50% win rate. With a 1:2 risk-reward ratio, we know that consistently following our strategy will yield profits in the long run. Since we had risked only what we could afford to lose, the slow price movement didn’t shake our confidence
Unfortunately, this trade didn’t go in our favor and ended up hitting our stop loss. This serves as a reminder that not every trade will reach take profit and that’s perfectly okay. Losses are an inevitable part of trading, but what truly matters is maintaining a solid risk management strategy, sticking to a proven system, and thinking long-term. As traders, our edge comes not from winning every trade, but from executing consistently and letting probabilities play out over time

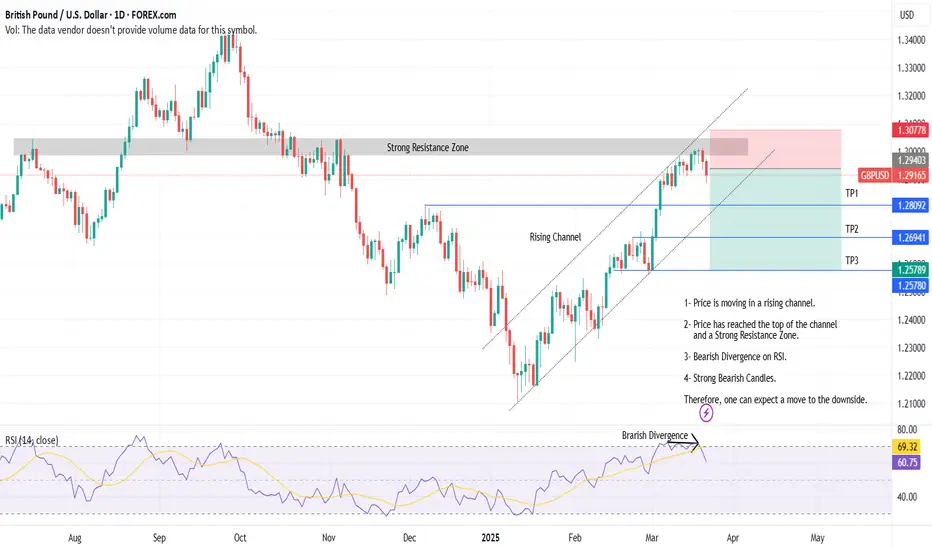
23-03-2025 _ Short Term Bearish Idea _ GBPUSD D11- Price is moving in a rising channel.
2- Price has reached the top of the channel
and a Strong Resistance Zone.
3- Bearish Divergence on RSI.
4- Strong Bearish Candles.
Therefore, one can expect a move to the downside.
GBPUSD INTRADAY breakout higher supported at 1.3050Trend Overview
The GBP/USD currency pair maintains a bullish trend, with recent price action confirming a breakout above the previous consolidation zone.
Key Levels & Scenarios
Support: 1.3050 (previous consolidation range)
A bullish bounce from this level could sustain the rally.
Upside targets: 1.3240, followed by 1.3270 and 1.3300 over the longer term.
Bearish Breakdown Scenario:
A daily close below 1.3050 would invalidate the bullish outlook.
Downside targets: 1.3010, followed by 1.2960 and 1.2910.
Indicators & Market Sentiment
Momentum indicators support the bullish bias, but price action needs to hold above 1.3050.
Volume confirms buying interest, reinforcing the breakout potential.
Conclusion
As long as 1.3050 holds as support, GBP/USD remains in a bullish structure, targeting 1.3240 and beyond. A break below 1.3050 would shift the focus toward 1.3010 and lower retracement levels.
This communication is for informational purposes only and should not be viewed as any form of recommendation as to a particular course of action or as investment advice. It is not intended as an offer or solicitation for the purchase or sale of any financial instrument or as an official confirmation of any transaction. Opinions, estimates and assumptions expressed herein are made as of the date of this communication and are subject to change without notice. This communication has been prepared based upon information, including market prices, data and other information, believed to be reliable; however, Trade Nation does not warrant its completeness or accuracy. All market prices and market data contained in or attached to this communication are indicative and subject to change without notice.

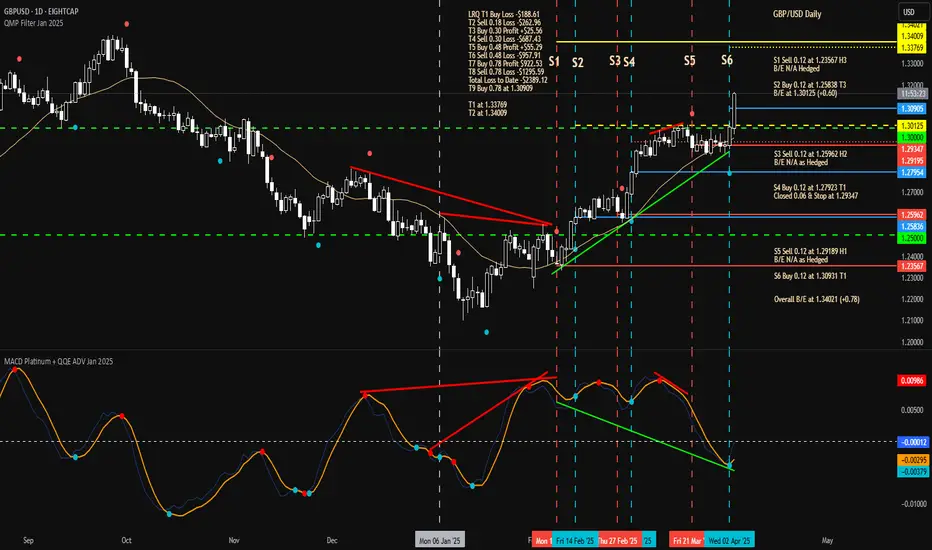
Thu 3rd Apr 2025 GBP/USD Daily Forex Chart Buy SetupGood morning fellow traders. On my Daily Forex charts using the High Probability & Divergence trading methods from my books, I have identified a new trade setup this morning. As usual, you can read my notes on the chart for my thoughts on this setup. The trade being a GBP/USD Buy. Enjoy the day all. Cheers. Jim
GBPUSD - near to his very expensive region, what's next??#GBPUSD... market just trade in range just below is most expensive region and that is market swing region as well.
keep close that region and only only buy above that region.
means don't holds your shorts above that region.
upside we have long leg if market clear that region.
good luck
trade wisely

GBPUSD GBPUSD currently in over bought region.
possible pullback and main focus is on the FVG that needs correction.
what are your thought?

GBP/USD Technical Analysis: Key Levels and Trade SetupThis chart represents a technical analysis of the GBP/USD currency pair on a 15-minute timeframe, using exponential moving averages (EMAs) and key levels.
Key Observations:
1. EMA Indicators:
The 200-period EMA (blue) is at 1.29238.
The 30-period EMA (red) is at 1.29155.
Price is currently below the 200 EMA, indicating a potential bearish trend.
2. Support and Resistance:
Resistance Level: 1.29346 (highlighted in blue).
Support Zone: Around 1.28857 (purple highlighted area).
3. Trading Plan:
The price is currently consolidating in a range between the support and resistance levels.
If the price breaks above 1.29346, it could move towards the target of 1.29720.
If the price fails to break resistance and falls below support (1.28857), a bearish

GBPUSD LONGS CONCEPTMarkets are choppy and so is cable.
I wanna see Tuesday's low being maintained as the low of the week and an expansion to prev weekly highs.
I was awaiting a HTF Mss with confirmation of how the market will close above prev daily highs.
Getting an entry on this one can be tricky unless the dollar index will be strongly drawn to the downside.
Lets tape read this together. I'll share more afterwards.
Stay tuned, & if you have not, hit the boost & follow button for more insights

GU-Thu-3/04/25 Top down analysis-Finally GU breakout!Analysis done directly on the chart
Who's been patient and was not lost inside this wide range
will be rewarded with good clean bullish movement.
Clever decision to wait out until Trump's tariffs being
announced. Now it is a good time to buy and take good trades.
Not financial advice, DYOR.
Market Flow Strategy
Mister Y

GBPUSD(20250403)Today's AnalysisMarket news:
US trade policy-① Trump signed an executive order to establish a 10% "minimum base tariff" for all countries, and will impose reciprocal tariffs, including 20% for the EU, 24% for Japan, 46% for Vietnam, and 25% for South Korea. The tariff exemption for goods that meet the USMCA will continue, and the tariff for those that do not meet the requirements will remain at 25%; ② The US Treasury Secretary called on countries not to retaliate; ③ The base tariff will take effect on April 5, and the reciprocal tariff will take effect on the 9th. In addition, the 25% automobile tariff will take effect on the 3rd, and the automobile parts tariff will take effect on May 3rd; ④ Gold bars, copper, pharmaceuticals, semiconductors and wood products are also not subject to "reciprocal tariffs".
Today's buying and selling boundaries:
1.2976
Support and resistance levels
1.3100
1.3053
1.3023
1.2928
1.2898
1.2852
Trading strategy:
If the price breaks through 1.3023, consider buying, the first target price is 1.3053
If the price breaks through 1.2976, consider selling, the first target price is 1.2928
GBPUSD upside target 1.331-1.343On the daily chart, GBPUSD continues to rise, and the bullish trend is obvious. At present, we can pay attention to the support of 1.304-1.306 area. If it falls back and stabilizes, we can consider going long. Pay attention to the previous supply area of 1.331-1.343 above.

SELL GBPUSDYesterday we bought it to the max. Now today, I am anticipating a decline in price. This is directly proportional with fundamentals as we await the market to react to the tariffs.

GBPUSD I Weekly CLS, KL - Order Block, Model 2Hey Traders!!
Feel free to share your thoughts, charts, and questions in the comments below—I'm about fostering constructive, positive discussions!
🧩 What is CLS?
CLS represents the "smart money" across all markets. It brings together the capital from the largest investment and central banks, boasting a daily volume of over 6.5 trillion.
✅By understanding how CLS operates—its specific modes and timings—you gain a powerful edge with more precise entries and well-defined targets.
🛡️Follow me and take a closer look at Models 1 and 2.
These models are key to unlocking the market's potential and can guide you toward smarter trading decisions.
📍Remember, no strategy offers a 100%-win rate—trading is a journey of constant learning and improvement. While our approaches often yield strong profits, occasional setbacks are part of the process. Embrace every experience as an opportunity to refine your skills and grow.
Wishing you continued success on your trading journey. May this educational post inspire you to become an even better trader!
“Adapt what is useful, reject what is useless, and add what is specifically your own.”
David Perk ⚔

GBPUSD H4 | Bearish Reversal Based on the H4 chart, the price is rising toward our sell entry level at 1.3150, a pullback resistance that aligns with the 61.8% Fibo projection and the 200% Fibo extension.
Our take profit is set at 1.3013, a pullback support.
The stop loss is set at 1.3319, a pullback resistance.
High Risk Investment Warning
Trading Forex/CFDs on margin carries a high level of risk and may not be suitable for all investors. Leverage can work against you.
Stratos Markets Limited (fxcm.com/uk):
CFDs are complex instruments and come with a high risk of losing money rapidly due to leverage. 63% of retail investor accounts lose money when trading CFDs with this provider. You should consider whether you understand how CFDs work and whether you can afford to take the high risk of losing your money.
Stratos Europe Ltd (fxcm.com/eu):
CFDs are complex instruments and come with a high risk of losing money rapidly due to leverage. 63% of retail investor accounts lose money when trading CFDs with this provider. You should consider whether you understand how CFDs work and whether you can afford to take the high risk of losing your money.
Stratos Trading Pty. Limited (fxcm.com/au):
Trading FX/CFDs carries significant risks. FXCM AU (AFSL 309763), please read the Financial Services Guide, Product Disclosure Statement, Target Market Determination and Terms of Business at fxcm.com/au
Stratos Global LLC (fxcm.com/markets):
Losses can exceed deposits.
Please be advised that the information presented on TradingView is provided to FXCM (‘Company’, ‘we’) by a third-party provider (‘TFA Global Pte Ltd’). Please be reminded that you are solely responsible for the trading decisions on your account. There is a very high degree of risk involved in trading. Any information and/or content is intended entirely for research, educational and informational purposes only and does not constitute investment or consultation advice or investment strategy. The information is not tailored to the investment needs of any specific person and therefore does not involve a consideration of any of the investment objectives, financial situation or needs of any viewer that may receive it. Kindly also note that past performance is not a reliable indicator of future results. Actual results may differ materially from those anticipated in forward-looking or past performance statements. We assume no liability as to the accuracy or completeness of any of the information and/or content provided herein and the Company cannot be held responsible for any omission, mistake nor for any loss or damage including without limitation to any loss of profit which may arise from reliance on any information supplied by TFA Global Pte Ltd.
The speaker(s) is neither an employee, agent nor representative of FXCM and is therefore acting independently. The opinions given are their own, constitute general market commentary, and do not constitute the opinion or advice of FXCM or any form of personal or investment advice. FXCM neither endorses nor guarantees offerings of third-party speakers, nor is FXCM responsible for the content, veracity or opinions of third-party speakers, presenters or participants.
