Fundamental Market Analysis for March 27, 2025 GBPUSDEvent to pay attention to today:
14:30 EET. USD - Unemployment Claims
GBPUSD:
The GBP/USD pair is showing signs of recovery, having rebounded from the previous session's losses to reach 1.2910 during Thursday's Asian trading session. The pair is strengthening as the US dollar remains under pressure from lower Treasury yields: 2-year and 10-year yields are at 4.0% and 4.34%, respectively. Market participants are monitoring upcoming US economic data, including weekly initial jobless claims and the final Q4 annualised Gross Domestic Product (GDP) report, scheduled for release later today.
However, GBP/USD gains may be constrained due to an escalation in risk-off sentiment and a rise in US trade policy. On Wednesday, US President Donald Trump signed an executive order imposing 25 per cent tariffs on car imports, which will come into effect on April 2, with duty collection starting the following day. However, a one-month delay will be granted for imports of auto parts. This has led to heightened global trade tensions and added uncertainty to the markets.
On Wednesday, St. Louis Fed President Alberto Musalem issued a statement that was critical of the tariff policy, joining other Federal Reserve chiefs in expressing concerns. Musalem warned that the measures are disrupting the US economy, increasing uncertainty and pushing inflation higher.
The release of the UK Consumer Price Index (CPI) report for February showed inflation falling faster than expected, leading to a weakening of the Pound Sterling (GBP). The lower CPI reading has led to speculation that the Bank of England (BoE) may be leaning towards easing monetary policy.
The core CPI rose by 2.8% year-on-year, falling short of the 2.9% forecast and down from January's 3.0%. The core consumer price index, which excludes volatile goods, rose by 3.5%, below the anticipated 3.6% and the previous reading of 3.7%. On a monthly basis, the core CPI increased by 0.4%, following a 0.1% decline in January, falling short of the 0.5% forecast. Inflation in the services sector, a key focus area for the Bank of England, remained steady at 5%.
Trading recommendation: SELL 1.29000, SL 1.29700, TP 1.28100
GBPUSD.1.MINI trade ideas

GBP/USD Price Action Update📊 GBP/USD Price Action Update 🇬🇧💵
GBP/USD is currently trading around 1.2916, showing signs of a potential retracement before its next move.
📌 Key Levels to Watch:
✅ Supply Zone (Resistance): 1.3000 - 1.3050 📍
🔴 This red zone represents a strong resistance level where price previously reversed. If GBP/USD breaks above this, we may see further bullish momentum.
✅ Demand Zone (Support): 1.2814 - 1.2854 📍
🟢 Buyers are expected to step in around these green zones, making them strong support levels for a potential bounce.
⚡ Possible Trade Setups:
📉 Bearish Scenario: Price may drop towards the 1.2854 - 1.2814 demand zone before reversing upwards.
📈 Bullish Scenario: If price finds support in the demand zone, it could rally back toward the 1.3000+ resistance area.
📢 Trading Tip:
Wait for confirmations in the key zones before taking positions. Watch for price reactions and volume changes before executing trades! 🔥
#fxforever #fxf #GBPUSD #ForexTrading #PriceAction #TechnicalAnalysis #DayTrading #SmartMoney #ForexSignals #TradingStrategy #MarketAnalysis #TradeSmart

Is There the Best Time to Trade Forex in the UK?Is There the Best Time to Trade Forex in the UK?
Grasping the nuances of forex market hours is essential for traders aiming to optimise their strategies. Operating continuously from Sunday evening to Friday night, the currency market accommodates participants across various time zones without being anchored to a singular physical location.
For those in the UK, recognising when to engage can dramatically influence outcomes. This FXOpen article discusses the pivotal currency trading sessions that may be optimal for UK-based traders.
Understanding Forex Market Hours
Understanding currency exchange market hours is crucial for anyone involved in the global foreign exchange market. Although you may already know this, let us remind you.
The forex market operates on a 24/5 basis, opening during weekdays and closing at weekends. This round-the-clock trading is possible because it’s not tied to a physical location; instead, it relies on a decentralised network of banks, businesses, and individuals exchanging currencies across different time zones.
For traders in the UK, knowing the best forex trading hours can be key to effective trading. The currency market is broadly divided into four main 9-hour-long windows, each starting at different times to cater to traders across the globe. The forex session times UK traders need to be aware of are:
- Sydney Session: 9:00 PM GMT - 6:00 AM GMT
- Tokyo Session: 11:00 PM GMT - 8:00 AM GMT
- London Session: 8:00 AM GMT - 5:00 PM GMT
- New York Session: 1:00 PM GMT - 10:00 PM GMT
Note that during British Summer Time (BST), some of these times are shifted forward by one hour.
These forex market trading times are essential to know, as they indicate when liquidity and volatility are likely to increase, potentially offering favourable market conditions.
The Optimal Times to Trade Forex in the UK
In navigating currency trading, UK-based traders should be aware of two key sessions: London and New York. These periods are optimal forex market hours in the UK, offering greater volumes, volatility, and liquidity. They’re also the periods that see the most releases for three of the major economies: the UK, Eurozone, and the US.
The core forex trading times in the UK are anchored around the London session, which is central to global forex market operations due to London's key position in the financial world. The London trading session time in the UK commences at 8:00 AM GMT (winter time).
This period, ending at 5:00 PM GMT (winter time), is pivotal as it accounts for roughly half of the forex transactions globally, making it a prime trading time due to the high liquidity and the potential for more pronounced price movements.
Likewise, the London-New York trading session time in the UK can be especially advantageous. It’s a crucial overlapping window occurring from 1:00 PM to 5:00 PM GMT (winter time), offering an avenue for traders seeking to maximise their potential returns due to the surge in activity and high-profile economic releases from the US.
During this window, the US stock market opens at 2:30 PM GMT. This secondary opening can also have a notable effect on US dollar-based pairs.
Economic Releases and the Impact on Trading Times for UK Traders
Economic releases and central bank announcements significantly influence UK forex trading times, often driving prices higher or lower. Many UK economic releases—affecting GBP currency pairs—are scheduled around 7:00 AM GMT. This timing offers traders opportunities to engage in trends post-release during the early hours of the London open.
However, some UK data and plenty of Eurozone data are released between 8:00 AM GMT and 10:00 AM GMT, periods typically characterised by increased liquidity and volatility, providing fertile ground for traders.
Likewise, many high-profile US economic announcements—non-farm payrolls, inflation statistics and employment data— are made between 1:00 PM GMT and 3:00 PM GMT. Given the US dollar's dominance on the world stage, these releases can present significant trading opportunities.
Although activity tends to quiet down after London closes, the late hours of the New York session still offer potential entries, albeit with generally lower volatility and volume.
Notably, Federal Reserve interest rate decisions are announced at 7:00 PM GMT with a press conference held after that can cause outsized price movements. The same can be said for the Bank of England and European Central Bank’s interest rate decisions at 12:00 PM GMT and 1:15 PM GMT, respectively, and their subsequent press conferences.
The Worst Time to Trade Forex in the UK
The worst times to trade forex in the UK often occur after 8:00 PM GMT, during the tail end of New York’s hours, when liquidity and volume significantly decrease. This reduction in activity can lead to less favourable trading conditions, including wider spreads and slower execution times.
Additionally, while the Asian session forex time in the UK, partially overlapping with the Sydney session, runs from 11:00 PM to 8:00 AM GMT, it presents challenges for UK traders.
Despite offering trading opportunities, especially in Japanese yen, Australian dollar, and New Zealand dollar-based pairs, the volumes during this period are substantially lower compared to the London and New York sessions. The Tokyo session forex time in the UK accounts for particularly unsociable hours anyway, so many UK traders are unlikely to engage in currency trading during this period.
Trading the London Session: A Strategy
The Asian-London Breakout Strategy leverages the unique dynamics between the calmer Asian session and the volatile London session. It involves setting buy/sell stop orders at the high and low points of the Asian period’s range, aiming to capture movements as London opens at 8:00 AM GMT.
With stop-loss orders placed above or below the range and a strategic approach to take profit – either at the end of the London session or by trailing a stop loss during the day – traders can potentially capitalise on the surge in activity. To delve deeper into this strategy and other session-based setups, consider exploring FXOpen’s 3-session trading system article.
The Bottom Line
Understanding forex trading hours and leveraging optimal times are pivotal for achieving favourable outcomes in currency trading. Luckily, UK-based traders are well placed to take advantage of the many opportunities the currency market presents, given their ability to trade both the London and New York sessions.
For UK traders seeking to navigate the complexities of markets with a trusted broker, opening an FXOpen account can provide all of the tools and insights necessary for effective trading.
FAQs
When Do the Forex Markets Open in the UK?
Forex opening times in the UK start at 8:00 AM GMT (winter time) and at 7:00 AM GMT (summer time) when the London session begins, marking the start of significant trading activity due to London's central role in the global currency arena.
What Time Does the Forex Market Open on Sunday in the UK?
The forex market opens on Sunday at 9:00 PM GMT (winter time) and at 10:00 PM GMT (summer time) in the UK, coinciding with Sydney’s opening and marking the beginning of the trading week.
What Time Does the Forex Market Close on Friday in the UK?
The forex market closes at 10:00 PM GMT (winter time) and at 9:00 PM GMT (summer time) on Friday in the UK, concluding with the end of the New York session and wrapping up the trading week.
Can You Trade Forex on Weekends?
Currency trading on weekends is not possible as the market is closed. Trading resumes with the opening of the Sydney session on Sunday at 9:00 PM GMT (winter time) and at 10:00 PM GMT (summer time).
This article represents the opinion of the Companies operating under the FXOpen brand only. It is not to be construed as an offer, solicitation, or recommendation with respect to products and services provided by the Companies operating under the FXOpen brand, nor is it to be considered financial advice.

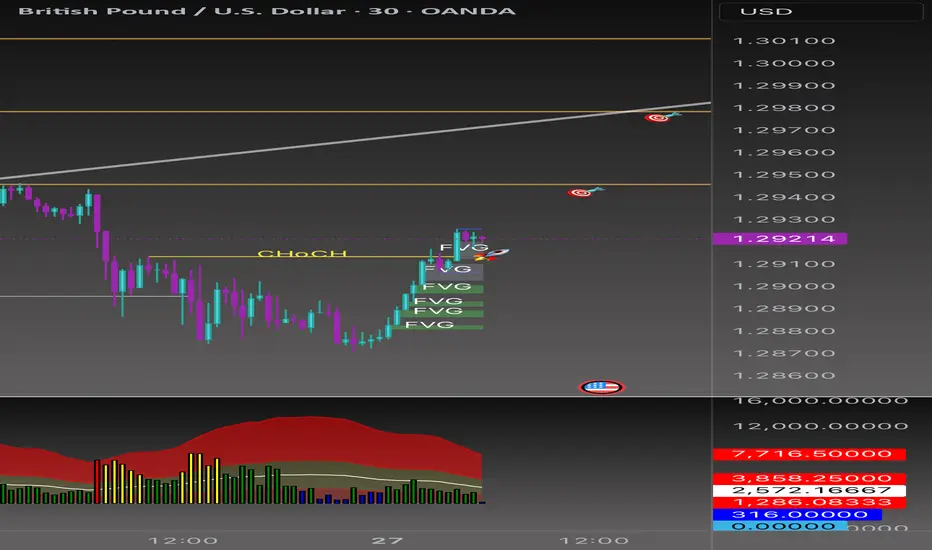
GBPUSD Technical Analysis by TradingDONIf OANDA:GBPUSD this candle closes on the 30-minute chart with FVG confirmation and a strong bullish body, I’m setting my target at the first Fibonacci level of 1.29451. And if that level gets broken by a bullish candle, I’m aiming for the trendline crossover at 1.29800.
Shorting GUDaily and 4h time frame showing bearish order flow.
Potential internal range to external range move on both 4h and 1h time frame.
SMT divergence w EU

GBPUSD(20250327)Today's AnalysisToday's buying and selling boundaries:
1.2897
Support and resistance levels:
1.2974
1.2945
1.2927
1.2868
1.2849
1.2821
Trading strategy:
If the price breaks through 1.2897, consider buying, the first target price is 1.2927
If the price breaks through 1.2868, consider selling, the first target price is 1.2849

GU - Buy limitThis is my buy limit order set up. This is a 1:5 R:R with this set up. We will be looking to fill the imbalanced market, filling the gap & also respecting the breaker block simultaneously. This setup is based off of the M2 timeframe for a more precise entry.

GBPUSD to meltGBPUSD is for the downside, don't miss out.
From a technical and fundamental standpoint, at least a correction to 1.29180 is guaranteed
Safe trading

GBPUSD Wave Analysis – 26 March 2025
- GBPUSD reversed from resistance area
- Likely to fall to support level 1.2800
GBPUSD recently reversed down from the resistance area between the resistance level 1.3035 (which has been reversing the price from October), resistance trendline of the daily up channel from January and the upper daily Bollinger Band.
The downward reversal from this resistance area created the daily Japanese candlesticks reversal pattern Evening Star which started the active wave 3.
GBPUSD can be expected to fall to the next support level 1.2800, the former monthly high from December.

GBP/USD Potential Bear Momentum...I couldn't resist the GBP/USD bear opportunity here displaying a broadening pattern.
I'm already in established shorts on the EUR/USD at 1.0891 but decided to jump in on GBP/USD at 1.2916 considering the price movements can be more pronounced.
Right now, my cap on whether this trade works or not is 1.3000. if we, for whatever reason, pop back up to 1.3000, I'd close this trade but for now, I think this trade looks good and will target 1.2750 however, using chart pattern percentages, I wouldn't be surprised to see 1.2600.
We'll see how this one looks going forward, especially with trump announcing more tariffs later today.
As always, Good Luck & Trade Safe.


CHECK GBPUSD ANALYSIS SIGNAL UPDATE > GO AND READ THE CAPTAINBaddy dears friends 👋🏼
(GBPUSD) trading signals technical analysis satup👇🏼
I think now (GBPUSD) ready for( BUY )trade ( GBPUSD ) BUY zone
( TRADE SATUP) 👇🏼
ENTRY POINT (1.28900) to (1.28850) 📊
FIRST TP (1.29100)📊
2ND TARGET (1.29300)📊
LAST TARGET (1.29500) 📊
STOP LOOS (1.28600)❌
Tachincal analysis satup
Fallow risk management

GBPUSD SELL 100 PIPS LIVE TRADE AND BREAKDOWN GBP/USD retests the 1.2870 zone, or two-week lows
The Greenback's upside impulse is now gathering extra steam and motivates GBP/USD to recede to the area of new two-week troughs around 1.2870.

GBP/USDHello friends
You can see that a trend continuation triangle pattern is forming, which we can enter into a trade if it fails.
The targets are also specified.
*Trade safely with us*

GBP/USD Breakdown – Bearish Momentum Ahead?This 4-hour chart of GBP/USD shows a clear bearish setup:
🔹 Rising Wedge Breakdown – The pair has broken below a rising wedge pattern, signaling potential downside pressure.
🔹 Support and Resistance Levels –
Resistance at 1.29206 - 1.30275
Support at 1.28000 - 1.28437
Strong support at 1.27539
🔹 Sell Confirmation – A sell signal is indicated, suggesting further downside movement towards the target zone.
📉 Trading Plan:
✅ Possible short entries below the 1.28956 level.
✅ Target price: 1.27539
✅ Stop-loss above 1.29206 for risk management.
⚠️ Risk Note: Always manage risk properly and watch for any trend reversals before entering trades.
What are your thoughts? Are you bearish or bullish on GBP/USD? 🤔💬

UK inflation cools more than expected, GBP/USD loses groundUK inflation for February rose 2.8% y/y, below the market esti mate of 2.9%. This was lower than the 3% gain in January. The main contribution to the drop in inflation was lower prices for clothing and housing. On a monthly basis, CPI rose 0.4%, up from 0.1% in January but lower than the market estimate of 0.5%. Core CPI also eased, falling from 3.7% to 3.5%.
The drop in inflation is good news, but the Bank of England remains concerned about the upside risk of inflation. Services inflation, which has been sticky, was unchanged at 5%.
The BoE will consider a rate cut at the next meeting in May, but will be monitoring the effects of increased employer taxes starting in April as well as today's Spring Statement.
At last week's meeting, the BoE expressed concern over worsening "global trade policy uncertainty" and pointedly mentioned US tariffs. The Trump administration's new trade policy has raised trade tensions and a global trade war would hurt growth and boost inflation.
The slight drop in inflation is also good news for Finance Minister Rachel Reeves, who is delivered the budget update earlier today. The update did not contain any further tax increases and announced deep spending cuts. Borrrowing a phrase from the Bank of England at last week's meeting, Reeves said "increased global uncertainty" had increased borrowing costs and led to economic instability.
GBP/USD has pushed below support at 1.2940. The next support level is 1.2864
There is resistance at 1.2940 and 1.2991

How to Spot Potential Price Reversals - Part 1: GBPUSD ExampleA subject within technical analysis that many traders find difficult to apply to their day-to-day trading is the ability to spot reversals in price.
The misreading of price activity when a reversal is materialising can often lead to incorrect decisions, such as entering a trade too early, which can result in being stopped out of a potentially successful trade before price activity moves in the intended direction.
In this piece today, and part 2 tomorrow, we want to look at 2 types of reversal in price – the Head and Shoulders/Reversed Head and Shoulders and the Double Top/Double Bottom.
The intention is to help you understand why price activity is reversing and highlight how knowledge of this may be applied within your own individual trading strategies.
The Head and Shoulders Pattern
This pattern highlights the potential,
• reversal of a previous downtrend in price into a more prolonged period of upside strength
• reversal of a previous uptrend in price into a phase of weakness
In this example, we are going to outline in more detail a bullish reversal in price, which is called a ‘Reversed Head and Shoulders’.
Points to Note: Reversed Head and Shoulders
• A downtrend in price must have been in place.
• A Reversed Head and Shoulders is made up of 3 clear troughs on a price chart.
• The middle trough (called the Head) is lower than the 2 outer price troughs (called the
Left Hand Shoulder and the Right Hand Shoulder).
• The 3rd low in price (Right Hand Shoulder) being higher than the Head, reflects the
inability of sellers to be able to break under a previous low in price. This is regarded as a
‘weak test’ of a previous price extreme, suggesting buyers may be gaining the upper hand,
readying for a potential positive sentiment shift and price strength.
• A trendline connecting highs in price that mark the upper extremes of the Head is drawn.
This highlights the Neckline of the pattern, which if broken on a closing basis, completes
the reversal, to represent a positive shift in sentiment and the potential of further price strength.
Point to Note: To understand a bearish reversal, known as a ‘Head and Shoulders Top’ please simply follow the opposite analysis of what is highlighted above.
GBPUSD Example:
In the chart below, we look at the recent activity of GBPUSD, which formed a bullish Reversed Head and Shoulders Pattern between December 20th 2024 and February 13th 2025, when the pattern was completed.
As with any bullish reversal in price, a clear downtrend and extended price decline must have been seen previously, for the reversal pattern to be valid. On the chart above, this was reflected by the decline from the September 20th 2024 high at 1.3434, into the January 13th price low at 1.2100.
The Head and Shoulders pattern is made up of 3 troughs in price and in this example, these are marked by the period between December 30th 2024 to January 7th 2025 which forms the Left Hand Shoulder , between January 7th to February 5th 2025 which was the Head developing , and between February 5th to February 13th 2025, which then formed the Right Hand Shoulder .
The Neckline of the pattern is drawn connecting the December 30th 2024 high and the February 5th 2025 highs, which was broken on a closing basis on February 13th 2025. It was on this day, the Reversed Head and Shoulders Pattern was completed with potential then turning towards a more extended phase of price strength.
Does the Head and Shoulders offer an Insight into a Potential Price Objective?
Yes, it does, by measuring the height from the bottom of the Head to the level of the Neckline at the time that low was posted, we can project this distance higher from the point the neckline was broken. This suggests a possible minimum objective for any future price strength.
In the example above, a low of 1.2100 was registered on January 13th 2025, at which time the Neckline stood at 1.2576. This means the height of the Head was 0.0476 (476 pips). On February 13th when the Neckline was broken on a closing basis, the Neckline stood at 1.2529.
As such…
1.2529 + 0.0476 = 1.3005, which would be the minimum potential price objective for the Reversed Head and Shoulders. This level was in fact achieved on March 18th 2025.
Of course, while the Head and Shoulders pattern is regarded as one of the most reliable patterns within technical analysis, it is not a guarantee of a significant price movement, as much will still depend on future sentiment and price trends.
Therefore, if initiating a trade based on a Reversed Head and Shoulders pattern, you must ALWAYS place a stop loss to protect against any unforeseen event or price movement.
The stop loss should initially be placed just under the level of the Right Hand Shoulder, as any break of this point negates the pattern, meaning we were wrong to class the pattern as we did.
However, if prices rise after completion of the pattern, you can consider moving a stop loss higher, keeping it just under higher support levels to protect your position.
We highlighted the formation of the potential GBPUSD reversed Head and Shoulders pattern on February 13th 2025, so please take a look at our timeline for further details.
Remember to watch out for tomorrow’s Part 2 post
The material provided here has not been prepared in accordance with legal requirements designed to promote the independence of investment research and as such is considered to be a marketing communication. Whilst it is not subject to any prohibition on dealing ahead of the dissemination of investment research, we will not seek to take any advantage before providing it to our clients.
Pepperstone doesn’t represent that the material provided here is accurate, current or complete, and therefore shouldn’t be relied upon as such. The information, whether from a third party or not, isn’t to be considered as a recommendation; or an offer to buy or sell; or the solicitation of an offer to buy or sell any security, financial product or instrument; or to participate in any particular trading strategy. It does not take into account readers’ financial situation or investment objectives. We advise any readers of this content to seek their own advice. Without the approval of Pepperstone, reproduction or redistribution of this information isn’t permitted.

GBPUSDI'm currently short on GBP/USD because the 1-hour trend is clearly bearish. The price had been consolidating within a range, but it has now broken both the support level and the lower channel with a strong bearish candle, indicating a potential continuation of the downtrend

GBP/USD Set for a Potential Decline as UK CPI Eases to 2.8%GBPUSD Set for a Potential Decline as UK CPI Cools to 2.8%
GBP/USD has been consolidating within a narrow range since the beginning of March, struggling to establish a definitive direction. This prolonged indecision suggests that the pair may require a correction before resuming any upward movement.
The latest data from the UK further supports this outlook.
February’s Consumer Price Index (CPI) revealed inflation cooling to 2.8% year-over-year, slightly below the forecasted 2.9%. Additionally, retail sales data fell short of expectations, coming in at 3.4% compared to the projected 3.6%.
As a result, market sentiment could weigh on GBPUSD, potentially driving the pair into a deeper correction.
Key support levels to watch include 1.2865 and 1.2800
You may find more details in the chart!
Thank you and Good Luck!
❤️PS: Please support with a like or comment if you find this analysis useful for your trading day❤️
Disclosure: I am part of Trade Nation's Influencer program and receive a monthly fee for using their TradingView charts in my analysis.

GBP/USD Trade Analysis: Bullish Reversal from Support ZoneExponential Moving Averages (EMAs):
200 EMA (Blue) at 1.29309: Represents the long-term trend.
30 EMA (Red) at 1.29122: Represents the short-term trend.
Price is currently below both EMAs, suggesting a bearish trend.
Support and Resistance Zones:
Resistance Zone (Purple at the top): Price previously reacted strongly at this level.
Support Zone (Purple at the bottom): A potential demand area where price is currently bouncing.
Trade Setup:
Entry Point: Near 1.28875 (highlighted on the chart).
Stop Loss: Set around 1.28714-1.28856, below the support zone.
Target Point: 1.29730, above the resistance and near the 200 EMA.
Risk-to-Reward Ratio: The setup aims for a higher reward than risk.
Trade Idea:
Bullish Reversal Trade: The price is reacting at a support zone, and the target aligns with a previous resistance level.
A confirmation (strong bullish candle or break of 30 EMA) could indicate a move toward 1.29730.
EMA Crossover Watch: If the 30 EMA crosses above the 200 EMA, it may confirm a stronger uptrend.
Potential Risks:
If price breaks below 1.28714, the bullish idea is invalid.
Resistance at 1.29309 (200 EMA) could slow the move upward.

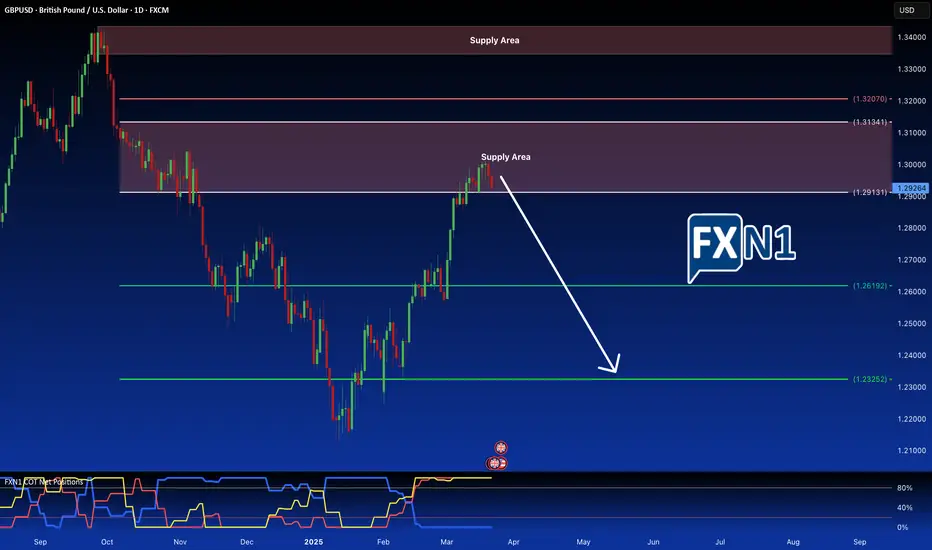
GBP/USD: Technical Signals Point to Potential Bearish ReversalIn the early stages of the European session on Friday, GBP/USD is struggling to maintain its footing, trading below the 1.2925 mark as I compose this article. The pair faces pressure from a robust demand for the US dollar amid a backdrop of cautiousness from the Federal Reserve and prevailing economic uncertainties. This selling pressure persists despite the Bank of England's recent hawkish stance.
As market participants await insights from Federal Reserve officials as well as a speech from US President Trump in the Oval Office, attention is heightened. From a technical perspective, the currency pair has entered a supply zone, prompting expectations for a potential reversal and the commencement of a bearish trend.
✅ Please share your thoughts about GBP/USD in the comments section below and HIT LIKE if you appreciate my analysis. Don't forget to FOLLOW ME; you will help us a lot with this small contribution.
GBPUSD LONGS CONCEPTWe had an inside bar on yesterday's price action on pound dollar.
I want to see a smart money reversal and the the market delivers liq to the Asian level.
But I would like to see a clear liq sweep @ the prev weekly lows and the see the reversal model form.
I think on a 15 min/5 min t.f, we might have completed the ongoing AMD /power of 3 setup and that's why I'm longs' biased
Follow and boost the idea if you agree and want to see more of such content

GBPUSD: Forecast & Technical Analysis
The recent price action on the GBPUSD pair was keeping me on the fence, however, my bias is slowly but surely changing into the bullish one and I think we will see the price go up.
Disclosure: I am part of Trade Nation's Influencer program and receive a monthly fee for using their TradingView charts in my analysis.
❤️ Please, support our work with like & comment! ❤️
