The Day Ahead Key Data Releases:
US: NY Fed 1-year inflation expectations (March) – Closely watched for signs of shifting inflation trends that could impact Fed rate outlook.
China: Trade Balance (March) – Insight into global demand and China’s export strength; potential impact on commodities and risk sentiment.
Japan: Capacity Utilization (Feb) – Secondary data, but relevant for assessing industrial activity in Japan.
Central Bank Speakers:
Fed’s Harker & Waller – Any hints on rate cuts, inflation stance, or economic outlook could move markets, especially USD and rates.
Earnings to Watch:
Goldman Sachs (GS) – Key read on investment banking, trading, and overall market health. Could set tone for broader financials.
This communication is for informational purposes only and should not be viewed as any form of recommendation as to a particular course of action or as investment advice. It is not intended as an offer or solicitation for the purchase or sale of any financial instrument or as an official confirmation of any transaction. Opinions, estimates and assumptions expressed herein are made as of the date of this communication and are subject to change without notice. This communication has been prepared based upon information, including market prices, data and other information, believed to be reliable; however, Trade Nation does not warrant its completeness or accuracy. All market prices and market data contained in or attached to this communication are indicative and subject to change without notice.
GBPUSD.1.MINI trade ideas

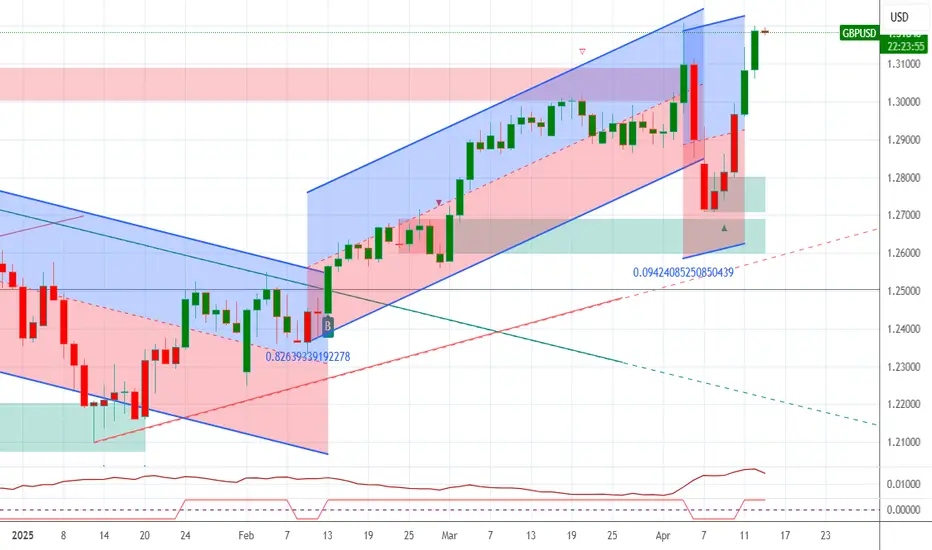
GBPUSDGBPUSD still showing some strength and needs more upside before any drop.
Disclosure: We are part of Trade Nation's Influencer program and receive a monthly fee for using their TradingView charts in our analysis.

GBPUSD Long - 80% probabilityWeekly candle bullish will reach weekly highs
Stop behind H4 Swing SR Level
80% probability trade, 1.9:1 RR trade.

GBPUSD Are the Bears back? I closed my previous long trade at 1.32274 after assessing the historical price action, fundamental data, and technical indicators. Now, I’m shifting my focus to waiting for bearish signals before entering a short position.
Key Market Analysis
Fundamental Overview
U.S. Jobless Claims data came in stronger than expected (215K vs. 225K forecast), reinforcing USD strength, which could pressure GBP/USD lower.
Continuing Jobless Claims were higher (1885K vs. 1870K forecast), showing some softness, but overall, labor market data supports a stronger dollar.
Housing Starts dropped sharply (1.324M vs. 1.42M forecast), but Building Permits beat expectations (1.482M vs. 1.45M). This mixed housing data isn’t enough to offset USD’s strength from labor numbers.
Technical Overview
Immediate Resistance: 1.3245 – GBP/USD has struggled to break this level, indicating sellers are defending it.
Major Resistance: 1.3265 – If price breaks above 1.3245, this would be the next selling opportunity before further upside.
Immediate Support: 1.3225 – Holding this level is critical for bulls; failure could accelerate a move downward.
Major Support: 1.3205 – If price falls below 1.3225, this will be the next logical downside target.
My New Trade Plan: Waiting for Bearish Confirmation
Now that I’ve closed my long trade, I’m waiting for a short entry based on the following setup:
Best Bearish Entry: Between 1.32350–1.32450, close to resistance where sellers have been active.
Confirmation Needed: I’ll wait for price rejection near 1.3245, along with weak momentum indicators before entering a short position.
Next Steps
I’ll monitor price action closely to confirm a strong rejection at 1.3245 before entering a short trade.
If GBP/USD pushes above 1.3245 and holds, I’ll wait for a better short entry near 1.3265.
If price breaks below 1.3225, I’ll assess the strength of the downward momentum and potentially enter a trade with 1.3205 as my first target.
At this point, I’m patiently watching the market to ensure I have the strongest bearish setup before committing to a new position.

GBPUSD - its breakout? what's next??#GBPUSD.. as you know guys our area was 1.3035 and in first go market boke that area but then drop towards bottom due to tariff implantation.
now market again break our area in today so if that is clear breakout then we can expect a further bounce towards 3400 and 1.3500
good luck
trade wisely

GBPUSD BIG DROP ?Market Structure Overview
Previous Trend: Strong bullish move after a long bearish trend.
Current Behavior: Price has entered a higher-timeframe supply zone (highlighted in green) and is showing signs of rejection.
Supply Zones:
Major Supply: 1.31750 – 1.32000
Minor Supply: 1.31000 – 1.31300
Demand Zones:
First Demand Zone: ~1.30380
Second Demand Zone: ~1.29919
📉 Trade Setup & Plan
🅰️ Primary Bias: Bearish Rejection from Supply
🔹 Scenario 1: Ideal Short Setup
Entry: Around current price (~1.30824) or after a retest of the 1.31000–1.31300 zone.
TP1: 1.30380 (first demand zone)
TP2: 1.29919 (second demand zone)
TP3 (extension): Below 1.29000 if momentum continues
SL: Above 1.31300 (to avoid fakeouts in supply)
🧩 Reasoning:
Price failed to break above supply with strong rejection wicks.
Break of structure + liquidity taken above local highs = possible start of bearish leg.
🔹 Scenario 2: Pullback Before Continuation Lower
Wait for Break of 1.30380, then look for pullback entries (break & retest).
Entry: On bearish confirmation after price retests 1.30380 zone from below.
TP: 1.29919, and if broken, continue to trail toward 1.2900s
✅ Extra Notes
Watch for rejection patterns (e.g., pin bars, engulfing candles) on the 15M or 30M to confirm entries.
Avoid entries during high-impact news, especially UK or US CPI, interest rate decisions, or NFP.
Manage risk wisely: Max 1-2% per trade.

Buy!Hello guys.. if the first leg happen, the second leg will be happen for near 100%. be happy and have a great trade(wink)

Potential Sell Opportunity on GBPUSDReasons I think this pair will drop:
- Bearish RSI divergence on daily chart.
- RSI Overbought on Daily Timeframe
- Confirmed Trend line may mean harder breakout
- Lower high on daily timeframe
What do you think?

British pound keeps rolling as UK GDP shinesThe British pound is up sharply on Friday, extending its rally for a fourth straight day. In the European session, GBP/USD is trading at 1.3088, up 0.94% on the day. The pound has surged 2.9% since Monday.
UK GDP higher than expected February with a gain of 0.5% m/m. This followed a revised 0% reading in January and beat the market estimate of 0.1%. This was the fastest pace of growth since March 2024. Services, manufacturing and construction all recorded gains. For the three months to January, GDP expanded 0.6%, above the revised 0.3% gain in January and higher than the market estimate of 0.4%.
The strong GDP data is welcome news amid all the uncertainty created by US President Trump's tariff policy. The UK's largest trading partner is the US and the 10% tariffs on UK products will hurt the UK export sector (Trump has suspended an additional 10% tariff for 90 days).
Bank of England expected to lower rates in May
The turmoil in the financial markets and escalating trade tensions has the Bank of England worried. The markets have priced in a rate cut in May, betting that the BoE will ease policy in order to support the weak economy, even with inflation above the 2% target. The BoE kept rates unchanged in March and meets next on May 8.
The US-China trade war rose up a notch on Friday, as China announced it would raise tariffs on US goods to 125% from 84%. This move was in response to the US lifting tariffs on China by 125% this week, for a total tariff rate at 145%. The trade war will dampen China's economy and Goldman Sachs has lowered its 2025 GDP forecast for China to 4.0% from 4.5%.

GBP/USD at a Crossroads: Imminent Breakout or Bull Trap?The weekly chart of GBP/USD shows a strong recovery following the late-April correction, which brought the price down to a key demand zone between 1.2550 and 1.2600. The bounce was sharp and decisive, but the pair is now facing resistance between 1.3000 and 1.3150 — a previously sold area marked by a visible supply block in red.
The current weekly candle reflects a bullish reaction, but the overall structure suggests a potential exhaustion zone for upward momentum. Price action reveals a series of lower highs in the short term, and while the RSI is bouncing, it remains far from overbought, hinting that this move may be just a technical rebound.
From a trading perspective, a confirmed weakness around the 1.3000–1.3150 zone could offer short opportunities with an initial target near 1.2700 and, if extended, down to 1.2550 — a key dynamic support area. On the flip side, a clean breakout above 1.3150 with strong volume and a weekly close would open the door for a new bullish leg toward 1.3300–1.3400.
Conclusion: GBP/USD is currently at a critical juncture. The next directional move will depend on how price reacts to this resistance zone: a confirmed rejection could trigger renewed selling pressure, while a confirmed breakout may reignite the bullish trend.

GBPUSD potential buy zone in inverted head & shoulder!GDP in GBPUSD had spike in actual value with the forecast has boost in this pair. Prior to data release this instrument had a break of structure has given strong liquidity grab as it has broken from long term trend line. As the market structure remain intact we may see the price to bounce back to the daily resistance line. 15m timeframe already has formed an inverted head & shoulder which signaling potential breakout. Any liquidity grab may give us potential entry in this lower timeframe.

possibility of uptrendConsidering the price behavior in the current resistance range, possible scenarios have been identified.
The upward trend is expected to continue to the green resistance range.

GBPUSD Buy opportunityGBPUSD can have a good opportunity for buy position.
For these reasons :
1. the bullish trend line shows the bullish trend. and price can reaction to the trend line again.
2. intersection of the support zone and the trend line can make the bullish movement more strong.
3. RSI divergence shows that the price will decrease and then we can see the price hitting whit the support level and the trend line.
Trigger : after that price hitting the support level and the trend line we can open a buy position whit a candle stick.
Stop loss : the stop loss can be below the candle stick or below the trend line.
It's just my personal analysis and I have no responsibility for your trades. thanks for your attention.

GBPUSD can be bearish🔹In weekly timeframe we observe the pin bar on the resistance level that show the power of the sellers.
🔹also if we analysis the price waves or legs we'd notice that the bullish legs became weaker and smaller and the bearish legs became stronger and bigger. It's show the power of the sellers too.
🔸 Anyway, for got entry trigger we need the trendline to break with a daily or weekly time frame candle.
🔺Targets can be the support levels on the chart (1.23629 - 1.21064 - 1.19348) and stoploss can be above the break candle or the last price high in daily or weekly timeframe.
P.S : I suggest use this analysis for detecting trend direction and open position whit your personal strategy.
It's just my personal analysis and I have no responsibility for your trades. thanks for your attention.

GBPUSD SELL 1.2908On the hourly chart, GBPUSD stabilized in the short term. Currently, we can pay attention to the upper 1.2908 area, which is a potential short position of the bearish bat pattern. At the same time, this position is in the previous supply area. If shorting near 1.2908, the downward target will look at the 1.2750-1.2800 area.

Explosive Breakout Setting Up on GBP/USD – Here's the Roadmap🔥 GBP/USD Technical Analysis – 4H Timeframe | Market Poised for Breakout or Breakdown?
Key Support: 1.26888
Key Resistance: 1.28829
Market Structure: Consolidation with bullish undertones
Bias: Neutral-to-bullish (pending confirmation)
🧠 Market Overview:
The GBP/USD pair is currently consolidating within a well-defined horizontal channel on the 4-hour chart, oscillating between 1.26888 (major support) and 1.28829 (key resistance). This prolonged range-bound behavior reflects a market in balance, where buyers and sellers are cautiously awaiting a catalyst to drive the next impulsive move.
The price action suggests that this consolidation phase may be coming to an end soon. A breakout or breakdown from this tight range is likely to set the tone for the next major trend. Market participants should be alert to early breakout signals and volume surges as confirmation triggers.
📊 Price Structure and Key Observations:
The market has printed a series of higher lows within the consolidation range, indicating a subtle bullish pressure beneath the surface.
Price is hovering near the mid-range zone, consolidating after multiple failed breakout attempts at 1.28829.
A squeeze in volatility is evident from narrowing candlesticks and declining ATR, often preceding explosive directional moves.
🔍 Technical Indicators Breakdown:
✅ RSI (14):
Currently trading around the neutral zone at 50, showing no clear directional bias. However, higher lows on RSI suggest potential bullish divergence forming, which could be an early signal of upward momentum building up.
✅ MACD:
A recent bullish crossover below the zero line indicates potential for a shift in momentum. Histogram bars are starting to turn positive, supporting a near-term bullish scenario if price confirms with a breakout.
✅ Moving Averages:
Price is trading above the 50-period SMA, which has acted as dynamic support on several occasions.
The 200-period SMA remains below current price levels, indicating a medium-term bullish structure remains intact unless support is broken decisively.
🔮 Potential Scenarios:
✅ Bullish Breakout Scenario:
If price breaks and closes above 1.28829 on strong bullish volume, it would represent a major breakout from the current range. This could open the door for a new impulsive leg to the upside.
Upside Targets:
🎯 1.29650 – Short-term resistance level from previous highs
🎯 1.30300 – Psychological round number and previous supply zone
🎯 1.31000 – Extended target aligned with Fibonacci 1.618 projection
Confirmation Factors:
Break + retest of 1.28829 as new support
RSI holding above 60
MACD expanding positively
❌ Bearish Rejection / Breakdown Scenario:
Should the pair fail to break above 1.28829 and print a strong bearish rejection candle (e.g., Shooting Star, Bearish Engulfing), the pair could retest the lower support of 1.26888.
A clean break below 1.26888 with a decisive bearish close could signal a trend reversal, shifting sentiment toward the downside.
Downside Targets:
📉 1.26000 – Near-term psychological support
📉 1.25200 – Previous demand area and key fib level (61.8%)
📉 1.24400 – Long-term trendline support (if applicable)
⚙️ Trade Strategy & Risk Management:
Breakout Traders: Wait for a confirmed candle close outside the range (either above 1.28829 or below 1.26888) before entering. Avoid false breakouts by validating with volume and momentum indicators.
Range Traders: Continue fading the range boundaries (buy near 1.26888, sell near 1.28829) while the channel remains intact. Use tight stop-losses just beyond the range to mitigate whipsaw risks.
Swing Traders: A successful breakout presents excellent risk-reward setups for multi-day trades, especially if accompanied by high volatility and news catalysts (e.g., NFP, BoE/Fed announcements).
🧭 Conclusion:
The GBP/USD pair is coiling tightly within a critical decision zone between 1.26888 and 1.28829. The tightening price structure, supportive indicators, and market indecision suggest that a major breakout is imminent.
Whether bulls take control or bears force a breakdown will largely depend on macroeconomic catalysts and institutional order flow. Traders are advised to stay patient, let the market reveal its hand, and execute only on high-probability setups with clear confirmations.
This is not the time to chase the market—this is the time to prepare for the move.
💬 Let me know in the comments how you're positioning yourself on GBP/USD this week!
🔔 Follow for more real-time setups, macro breakdowns, and professional market insights.
📈 Stay sharp, stay technical.
Would you like me to generate a matching TradingView chart snapshot with drawn zones and notes to go with this analysis for posting?

GBP-USD Strong Breakout! Sell!
Hello,Traders!
GBP-USD made a bearish
Breakout of the key wide horizontal
Level of 1.2851 then made a
Pullback so we are bearish
Biased and a further bearish
Continuation is to be expected
Sell!
Comment and subscribe to help us grow!
Check out other forecasts below too!
Disclosure: I am part of Trade Nation's Influencer program and receive a monthly fee for using their TradingView charts in my analysis.

Possible Setup for GBPUSDGBPUSD is trending in uptredn channel and is likely to go up with possible Support level. let us see...

GBPUSD - Support becomes ResistanceHello Traders !
The GBPUSD failed to break the resistance level (1.30490 - 1.29990).
The price broke the support (1.27592 - 1.28116).
This key level becomes new resistance !
So, I expect a bearish move📉
_____________
TARGET: 1.25900🎯

GBP/USD Long🟢 Bullish Play (High Probability)
Plan: Break-and-Retest Strategy
Entry: Wait for daily close above 1.3200, then set buy limit at 1.3060
SL: 1.2890
TP1: 1.3300
TP2: 1.3600
TP3: 1.4000 (macro breakout target)

GBPUSD → False break of weekly support + DXY fallFX:GBPUSD is going through a shakeout phase relative to the trading range. Last week was very challenging in terms of unpredictable moves and volatility.
A strong NFP report on Friday allowed the dollar to strengthen, but the reaction from the opening of the new trading week has already exhausted itself as traders are still watching the tariff war, which simply crashed the stock, futures markets.
Technically, the currency pair on this background can win out, as the pound sterling within the ascending trend, the fall of the dollar can continue the growth phase.
On the chart, the price forms a false breakdown of the support conglomerate, which in general may push the price up due to the imbalance of liquidity and interests of money moving away from the dollar
Resistance levels: 1.2932, 1.3010
Support levels: 1.2828, 1.2811
If the bulls will keep the price above 1.2868 and will be able to consolidate above 1.2932, in the short term the market can show growth up to the next target - resistance 1.3010.
Regards R. Linda!

What I'm expecting on the new week open..This is basically what my gut is telling me that is going to happen on Monday's open based on technical factors thought by ICT and my own spin on it.
TLDW; It looks like we are just going to start going up with very little retracement at the start of the week.
- R2F Trading
