GBPUSD - Buy/longpersonal journaling purposes.
78.6 support. low risk entering into European session and probability that it will retrace to 61.8 creates a great risk reward
GBPUSD.1.MINI trade ideas

GBP/USD "The Cable" Forex Bank Heist Plan (Swing / Day Trade)🌟Hi! Hola! Ola! Bonjour! Hallo! Marhaba!🌟
Dear Money Makers & Robbers, 🤑 💰💸✈️
Based on 🔥Thief Trading style technical and fundamental analysis🔥, here is our master plan to heist the GBP/USD "The Cable" Forex Market. Please adhere to the strategy I've outlined in the chart, which emphasizes long entry. Our aim is the high-risk Red Zone. Risky level, overbought market, consolidation, trend reversal, trap at the level where traders and bearish robbers are stronger. 🏆💸"Take profit and treat yourself, traders. You deserve it!💪🏆🎉
Entry 📈 : "The heist is on! Wait for the MA breakout (1.30500) then make your move - Bullish profits await!"
however I advise to Place Buy stop orders above the Moving average (or) Place buy limit orders within a 15 or 30 minute timeframe most recent or swing, low or high level.
📌I strongly advise you to set an "alert (Alarm)" on your chart so you can see when the breakout entry occurs.
Stop Loss 🛑: "🔊 Yo, listen up! 🗣️ If you're lookin' to get in on a buy stop order, don't even think about settin' that stop loss till after the breakout 🚀. You feel me? Now, if you're smart, you'll place that stop loss where I told you to 📍, but if you're a rebel, you can put it wherever you like 🤪 - just don't say I didn't warn you ⚠️. You're playin' with fire 🔥, and it's your risk, not mine 👊."
📍 Thief SL placed at the recent/swing low level Using the 4H timeframe (1.27000) Swing/Day trade basis.
📍 SL is based on your risk of the trade, lot size and how many multiple orders you have to take.
🏴☠️Target 🎯: 1.35000 (or) Escape Before the Target
🧲Scalpers, take note 👀 : only scalp on the Long side. If you have a lot of money, you can go straight away; if not, you can join swing traders and carry out the robbery plan. Use trailing SL to safeguard your money 💰.
💰💵💸GBP/USD "The Cable" Forex Market Heist Plan (Swing/Day) is currently experiencing a bullishness,., driven by several key factors. 👇👇👇
📰🗞️Get & Read the Fundamental, Macro, COT Report, Quantitative Analysis, Sentimental Outlook, Intermarket Analysis, Future trend targets... go ahead to check 👉👉👉🔗🔗
⚠️Trading Alert : News Releases and Position Management 📰 🗞️ 🚫🚏
As a reminder, news releases can have a significant impact on market prices and volatility. To minimize potential losses and protect your running positions,
we recommend the following:
Avoid taking new trades during news releases
Use trailing stop-loss orders to protect your running positions and lock in profits
💖Supporting our robbery plan 💥Hit the Boost Button💥 will enable us to effortlessly make and steal money 💰💵. Boost the strength of our robbery team. Every day in this market make money with ease by using the Thief Trading Style.🏆💪🤝❤️🎉🚀
I'll see you soon with another heist plan, so stay tuned 🤑🐱👤🤗🤩

Fri 11th Apr 2025 Daily Forex Charts: 8x New Trade SetupsGood morning fellow traders. On my Daily Forex charts using the High Probability & Divergence trading methods from my books, I have identified 8x new trade setups this morning. As usual, you can read my notes on the charts for my thoughts on these setups. The trades being a AUD/JPY Buy, XAU/USD Buy, AUD/USD Buy, XAG/USD Buy, NZD/USD Buy, NZD/CAD Buy, GBP/AUD Sell & GBP/USD Buy. I also discuss some trade management. Enjoy the day all. Cheers. Jim

GBPUSD - ANALYSIS👀 Observation:
Hello, everyone! I hope you're doing well. I’d like to share my analysis of GBP-USD with you.
Looking at the GBP-USD chart, I expect a small price decline towards the 1.29336 level. After reaching this price, I anticipate a price increase toward the 1.3500 level.
📉 Expectation:
Bearish Scenario: A small decline to 1.29336.
Bullish Scenario: After hitting 1.29336, expect a rise to 1.3500.
💡 Key Levels to Watch:
Support: 1.29336
Resistance: 1.3500
💬 What are your thoughts on GBP-USD this week? Let me know in the comments!
Trade safe


GBP/USDHello friends
According to the trend and price drop, we see that a flag pattern has formed, which we can enter into a trade with capital and risk management.
*Trade safely with us*

Gbp/Usd LongGbp/Usd looks to commit to upside after long time ranging and uncertainty around tarrifs. Now with Us cpi news behind, uptrend can continue. If price can break above resistance at 1.29760 it's very good sign for this trade.
SL under monthly lows.
TP: 1.42660

GBPUSD Analysis week 16Fundamental Analysis
The USD recovered somewhat after President Donald Trump announced a 90-day pause on tariffs and increased import tariffs on Chinese goods to 125%. This development limited the upside momentum of GBP/USD.
Despite the tariff suspension, investors are still concerned about the US economic outlook due to escalating trade tensions between the two countries. This continues to put downward pressure on the USD and supports GBP/USD to regain momentum.
Technical Analysis
GBPUSD is recovering significantly at the end of the week. and is facing a reaction at the old peak as well as Fibonacci. This pullback is noticeable at two Fibonacci zones and an old breakout zone around 1.30000 and 1.28900. The first two resistances to watch at last week's high around 1.31500 and next week's most important Resistance at 1.32900 will ensure GBPUSD avoids a sudden spike.

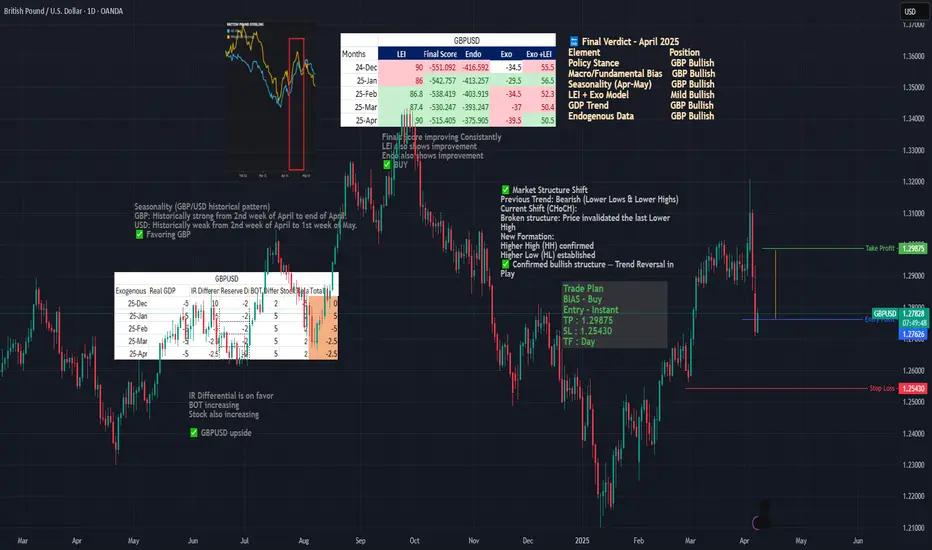
GBP/USD Bullish Reversal – April Seasonality + CHoCH + Macro SetI'm going long on GBP/USD based on a confluence of:
Bullish market structure shift (CHoCH) – Higher High & Higher Low confirmed on the daily chart
Strong April seasonality – GBP tends to rally mid-to-late April, while USD shows weakness
Macro divergence – BOE is hawkish, Fed is dovish; USD flagged as “Strong Sell”
📊 Supporting Fundamentals
GBP GDP improving (1.6%), USD slowing (2.2%)
LEI + Exo model shows stable bullish-neutral momentum
GBP LONG FOR SWINGI took this trade yesterday. Even entered a few lots at the second setup shown. This is my personal view for swing traders.

GBPUSD: Short Trade Explained
GBPUSD
- Classic bearish formation
- Our team expects fall
SUGGESTED TRADE:
Swing Trade
Sell GBPUSD
Entry Level - 1.3065
Sl - 1.3132
Tp - 1.2929
Our Risk - 1%
Start protection of your profits from lower levels
Disclosure: I am part of Trade Nation's Influencer program and receive a monthly fee for using their TradingView charts in my analysis.
❤️ Please, support our work with like & comment! ❤️

GBP/USD Bullish Breakout Setup – Entry, Target & Stop Loss AnalyEMA 200 (blue line): 1.28423 – typically used to define long-term trend direction.
EMA 30 (red line): 1.28253 – shorter-term trend indication.
Currently, the price is above the 30 EMA and slightly above the 200 EMA, suggesting short-term bullish momentum with potential for trend reversal or continuation.
🟪 Key Zones and Levels:
Entry Point Zone: Around 1.28242–1.28423 (highlighted in purple).
Stop Loss: Set slightly below the purple demand zone at 1.27931.
Target (EA TARGET POINT): Marked around 1.29809.
🧠 Trade Setup Summary:
Risk/Reward: Good – aiming for a ~1.19% gain (~152.5 pips), with a relatively tight stop loss.
Structure:
The price has broken above a consolidation range (demand zone) and retested the zone (potential bullish retest).
EMA crossover could soon occur if the 30 EMA crosses above the 200 EMA, confirming bullish sentiment.
✅ Bullish Confirmation Signs:
Higher lows forming.
Break and retest of previous resistance (now support).
EMA proximity breakout is occurring.
Strong bullish candles near the entry level.
⚠️ Things to Watch:
If price closes strongly above 1.2860–1.2870, that could signal momentum continuation.
Failing to hold 1.2824–1.2800 might invalidate the setup and trigger the stop loss.
Watch for fundamental events (economic news, especially from UK/US) that could cause sudden volatility.

GBPUSD Long term Draw on LiquidityBuyside has been raided now we look to the sell side liquidity at the Equal lows

Will 3 Times Be The Charm For GBPUSD??We can see FX:GBPUSD retrace a tad further up to the Volume Imbalance that was created over the weekend of April 4th - 7th. After Price made its High @ 1.3207, it was immediately rejected back down below the Past Level of Support that is now showing signs of Resistance!
- Following that Higher High not only resulted in a Lower Low but also sent the RSI under 50 into Bearish Territory!
Now in the ICT Methodology of Volume Imbalances, Price is likely to Test or Fill the Imbalance, then once satisfied, has a high potential to turn the opposite direction. Now a Pullback to Fill the Imbalance would land Price right at the 38.2% Fibonacci Level @ 1.28984 where if Bulls are unable to push Price back above, would be an excellent Shorting Opportunity for Bears to overcome.
- RSI is now below the 50 suggesting Bulls have lost steam and strengthens the potential for more downside to occur but that would call for a Break and Retest Scenario on the Rising Support.
Fundamentally, the Federal Reserve will be releasing the CPI y/y and m/m results where analysts believe there to be a .3% decrease in inflation forecasting a 2.5% CPI for March from the previous 2.8% for February. Given this, the FOMC " do not plan to come to rescue Trump with rate cuts" and insist that all the Tariff pressure will actually be a reasoning for Inflation to Rise! So if CPI ends up printing Hotter than Expected (Higher), we could see a renewed strength in the USD.

Sell GBPUSDGBPUSD looks good for sells now. After a strong push upwards during the course of the week, price will retrace until market close, then continue down on MONDAY

GBP/USD - Weekly Elliott Wave Forecast | Potential B-Wave Trap!Pattern: Completed 5-Wave Impulse + ABC Zigzag Correction
Current Price: 1.3056
Forecast: Bearish B-Wave Reversal Incoming?
Technical Breakdown:
Major impulse from 2007 to 2022 marked as 1 to 5
A corrective ABC move completed at the key resistance zone
Price currently facing rejection from the C wave top
High probability of a B-Wave trap forming before a drop to the 1.14 zone
Strong confluence with historical structure and Fibonacci retracement
Next Move:
Watch for a weekly candle close below 1.28 to confirm the reversal. Bears may target the 1.14 zone in the next leg down.
Wave Structure Visualized (Top-Right Inset):
Shows possible B-Wave drop before bullish C continuation — a perfect trap zone for early bulls.
Trade Plan:
Short bias below 1.30 with SL above 1.32
Target: 1.18–1.14 zone
Re-assess price action near 1.14 for long opportunities
Stay Sharp, Stay Green!

GBPUSD Breaks Key Support: Trump's Tariffs Trigger a Bigger DropGBPUSD Breaks Key Support: Trump's Tariffs Trigger a Bigger Drop
Since early March 2025, GBP/USD entered an accumulation phase, trading within a 145-pip range between 1.2870 and 1.3015. The first breakout attempt was bullish, but on April 3rd, a sharp sell-off occurred, triggered by Trump’s newly imposed tariffs.
GBP/USD has now broken below the 1.2870 support zone, a level where the price had held firm for a month. If the pair remains below 1.2870, the likelihood of a larger downward move increases.
Based on current data, GBP/USD might retest 1.2870 before continuing downward, but this is uncertain. The pair’s movement is highly dependent on Trump's tariffs, and any new statements or policy shifts could quickly change its direction
You may find more details in the chart!
Thank you and Good Luck!
❤️PS: Please support with a like or comment if you find this analysis useful for your trading day❤️
Disclosure: I am part of Trade Nation's Influencer program and receive a monthly fee for using their TradingView charts in my analysis.

GBP/USD Faces Crucial Resistance – Will the Uptrend Continue?📊 GBP/USD Daily Technical Outlook – April 10, 2025
GBP/USD is currently trading around 1.2696, facing significant resistance near the 1.2800 level. After a recent decline from the 1.3434 peak, the pair has been consolidating, forming a range between 1.2740 and 1.2860. The market's reaction to these levels will be crucial in determining the next directional move.
📈 Current Market Structure:
The recent price action indicates a neutral to bearish trend for GBP/USD. The pair has formed lower highs and higher lows, creating a symmetrical triangle pattern, suggesting indecision in the market. A breakout from this pattern, either above 1.2860 or below 1.2740, will likely set the tone for the next significant move.
🔹 Key Resistance Levels:
1.2800: Immediate resistance. A break above this level could signal a potential bullish move.
1.2860: Upper boundary of the current range. A decisive break above this level would confirm the continuation of the uptrend.
1.2933: Significant resistance zone. If the price manages to break above this level, it could lead to further gains.
🔸 Key Support Levels:
1.2740: Lower boundary of the current range. A break below this level could indicate a bearish reversal.
1.2720: Short-term support. Failure to hold above this level might lead to a deeper correction.
1.2580: Major support zone. A drop below this level would confirm a bearish trend.
📐 Price Action Patterns:
The formation of a symmetrical triangle suggests that the market is awaiting a catalyst for the next move. Traders should watch for a breakout from this pattern, as it will likely lead to increased volatility and a clear directional bias.
🧭 Potential Scenarios:
✅ Bullish Scenario:
A breakout above 1.2860, especially with strong volume, could lead to a rally toward 1.2933 and potentially higher levels.
❌ Bearish Scenario:
A break below 1.2740 could trigger a decline toward 1.2720, with further downside potential if the support at 1.2580 is breached.
📌 Conclusion:
GBP/USD is currently consolidating within a defined range, with key levels at 1.2740 and 1.2860. The next significant move will depend on a breakout from this range, providing clarity on the market's direction. Traders should monitor these levels closely and prepare for increased volatility as the pair approaches these boundaries.
💬 What’s your outlook for GBP/USD? Will the pair break above 1.2860, or is a bearish reversal imminent? Share your thoughts below 👇

GBP/USD For Bearish as Pull-Backyou can go short now
or
wait for pull-back near by entry point and then go short
general trend is up trend
current phase is pull-back and may be finish at target 3
have fun :)

gbpusd buy tradeThe Relative Strength Index (RSI) is showing an upward trend, indicating increasing momentum. Additionally, the Moving Average Convergence Divergence (MACD) is showing a bullish crossover, further supporting the potential for an upward move.

GBPUSD H4 | Bearish Fall Based on the H4 chart analysis, we can see that the price is testing our sell entry at 1.3013, which is a pullback resistance aligning with the 61.8% Fibo retracement.
Our take profit will be at 1.2909, a pullback support level.
The stop loss will be placed at 1.3165. a swing high resistance.
High Risk Investment Warning
Trading Forex/CFDs on margin carries a high level of risk and may not be suitable for all investors. Leverage can work against you.
Stratos Markets Limited (tradu.com):
CFDs are complex instruments and come with a high risk of losing money rapidly due to leverage. 63% of retail investor accounts lose money when trading CFDs with this provider. You should consider whether you understand how CFDs work and whether you can afford to take the high risk of losing your money.
Stratos Europe Ltd (tradu.com):
CFDs are complex instruments and come with a high risk of losing money rapidly due to leverage. 63% of retail investor accounts lose money when trading CFDs with this provider. You should consider whether you understand how CFDs work and whether you can afford to take the high risk of losing your money.
Stratos Global LLC (tradu.com):
Losses can exceed deposits.
Please be advised that the information presented on TradingView is provided to Tradu (‘Company’, ‘we’) by a third-party provider (‘TFA Global Pte Ltd’). Please be reminded that you are solely responsible for the trading decisions on your account. There is a very high degree of risk involved in trading. Any information and/or content is intended entirely for research, educational and informational purposes only and does not constitute investment or consultation advice or investment strategy. The information is not tailored to the investment needs of any specific person and therefore does not involve a consideration of any of the investment objectives, financial situation or needs of any viewer that may receive it. Kindly also note that past performance is not a reliable indicator of future results. Actual results may differ materially from those anticipated in forward-looking or past performance statements. We assume no liability as to the accuracy or completeness of any of the information and/or content provided herein and the Company cannot be held responsible for any omission, mistake nor for any loss or damage including without limitation to any loss of profit which may arise from reliance on any information supplied by TFA Global Pte Ltd.
The speaker(s) is neither an employee, agent nor representative of Tradu and is therefore acting independently. The opinions given are their own, constitute general market commentary, and do not constitute the opinion or advice of Tradu or any form of personal or investment advice. Tradu neither endorses nor guarantees offerings of third-party speakers, nor is Tradu responsible for the content, veracity or opinions of third-party speakers, presenters or participants.

Bearish reversal?GBP/USD is risng towards the resistance level which is a pullback resistance that aligns with the 61.8% Fibonacci retracement and could reverse from this level to our take profit.
Entry: 1.3009
Why we like it:
There is a pullback resistance level that lines up with the 61.8% Fibonacci retracement.
Stop loss: 1.3106
Why we like it:
There is a pullback resistance level that lines up with the 78.6% Fibonacci retracement.
Take profit: 1.2875
Why we like it:
There is an overlap support level.
Enjoying your TradingView experience? Review us!
Please be advised that the information presented on TradingView is provided to Vantage (‘Vantage Global Limited’, ‘we’) by a third-party provider (‘Everest Fortune Group’). Please be reminded that you are solely responsible for the trading decisions on your account. There is a very high degree of risk involved in trading. Any information and/or content is intended entirely for research, educational and informational purposes only and does not constitute investment or consultation advice or investment strategy. The information is not tailored to the investment needs of any specific person and therefore does not involve a consideration of any of the investment objectives, financial situation or needs of any viewer that may receive it. Kindly also note that past performance is not a reliable indicator of future results. Actual results may differ materially from those anticipated in forward-looking or past performance statements. We assume no liability as to the accuracy or completeness of any of the information and/or content provided herein and the Company cannot be held responsible for any omission, mistake nor for any loss or damage including without limitation to any loss of profit which may arise from reliance on any information supplied by Everest Fortune Group.

Gbpusd signal buy GBP/USD tested higher on Wednesday, climbing back over the 1.2800 handle after broad-market sentiment recovered across the board. The Trump administration has once again pivoted away from its own “no exceptions, no delays” tariff policy, and has again delayed tariffs, this time for 90 days.
The Relative Strength Index (RSI) indicator on the 4-hour chart stays below 50 despite the latest rebound, suggesting that buyers remain reluctant to commit to a steady recovery in Pound Sterling.
Gbpusd signal buy
