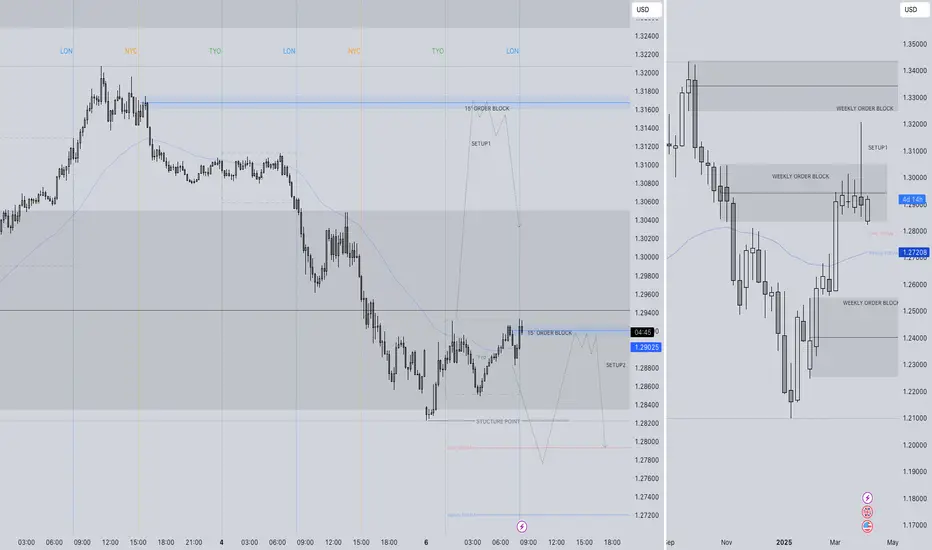
GBP/USD Bearish Setup Summary
Bias: Bearish (confirmed by break of structure)
Entry Zone: Price is retracing into a supply zone + FVG
Confluence:
Bearish BOS
Price filling FVG before dropping
Target: TP1 at the next low (liquidity pool)
TP2 1H lower side liquidity
SL: Just above the FVG/supply zone
GBPUSD.P trade ideas

GBP_USD LONG SIGNAL|
✅GBP_USD made some crazy
Moves last week and was eventually pushed
Back down to the horizontal support of 1.2874
From where we will be expecting a local
Rebound, therefore we can go long on
The pair with the TP of 1.2946
And the SL of 1.2849
LONG🚀
✅Like and subscribe to never miss a new idea!✅
Disclosure: I am part of Trade Nation's Influencer program and receive a monthly fee for using their TradingView charts in my analysis.


Bullish rebound?The Cable (GBP/USD) has bounced off the pivot which is a pullback support and could rise to the 1st resistance which acts as a pullback resistance.
Pivot: 1.2717
1st Support: 1.2570
1st Resistance: 1.2875
Risk Warning:
Trading Forex and CFDs carries a high level of risk to your capital and you should only trade with money you can afford to lose. Trading Forex and CFDs may not be suitable for all investors, so please ensure that you fully understand the risks involved and seek independent advice if necessary.
Disclaimer:
The above opinions given constitute general market commentary, and do not constitute the opinion or advice of IC Markets or any form of personal or investment advice.
Any opinions, news, research, analyses, prices, other information, or links to third-party sites contained on this website are provided on an "as-is" basis, are intended only to be informative, is not an advice nor a recommendation, nor research, or a record of our trading prices, or an offer of, or solicitation for a transaction in any financial instrument and thus should not be treated as such. The information provided does not involve any specific investment objectives, financial situation and needs of any specific person who may receive it. Please be aware, that past performance is not a reliable indicator of future performance and/or results. Past Performance or Forward-looking scenarios based upon the reasonable beliefs of the third-party provider are not a guarantee of future performance. Actual results may differ materially from those anticipated in forward-looking or past performance statements. IC Markets makes no representation or warranty and assumes no liability as to the accuracy or completeness of the information provided, nor any loss arising from any investment based on a recommendation, forecast or any information supplied by any third-party.

Falling towards pullback support?GBP/USD is falling towards the support level which is a pullback support that aligns with the 161.8% Fibonacci extension and the 61.8% Fibonacci retracement and could bounce from this level to our take profit.
Entry: 1.2677
Why we like it:
There is a pullback support level that lines up with the 161.8% Fibonacci retracement and the 61.8% Fibonacci retracement.
Stop loss: 1.2677
Why we like it:
There is a pullback support level that is slightly below the 71% Fibonacci retracement.
Take profit: 1.2875
Why we like it:
There is a pullback resistance level.
Enjoying your TradingView experience? Review us!
Please be advised that the information presented on TradingView is provided to Vantage (‘Vantage Global Limited’, ‘we’) by a third-party provider (‘Everest Fortune Group’). Please be reminded that you are solely responsible for the trading decisions on your account. There is a very high degree of risk involved in trading. Any information and/or content is intended entirely for research, educational and informational purposes only and does not constitute investment or consultation advice or investment strategy. The information is not tailored to the investment needs of any specific person and therefore does not involve a consideration of any of the investment objectives, financial situation or needs of any viewer that may receive it. Kindly also note that past performance is not a reliable indicator of future results. Actual results may differ materially from those anticipated in forward-looking or past performance statements. We assume no liability as to the accuracy or completeness of any of the information and/or content provided herein and the Company cannot be held responsible for any omission, mistake nor for any loss or damage including without limitation to any loss of profit which may arise from reliance on any information supplied by Everest Fortune Group.


GBPusd Scenario 08/04/2025English : According to our analysis, we anticipate a Bearish scenario.
Morocan Darija : kanchofo d'apres l'analyse dyalna antsanaw hbot
ATENTION : I only share my ideas, not signals.

GBPUSD to recoverCCI convergence at the current levels.
I see 1.2715 holding the low and attempt to recover ground for a test higher at 1.2935 in the near-term

GBPUSD - ANALYSIS👀 Observation:
Hello, everyone! I hope you're doing well. I’d like to share my analysis of GBP-USD with you.
Looking at the GBP chart, I expect a slight price increase, possibly up to 1.29625. After reaching this level, I anticipate a price decline towards 1.27161.
📉 Expectation:
Bullish Scenario: A small increase to 1.29625.
Bearish Scenario: After reaching 1.29625, price declines towards 1.27161.
💡 Key Levels to Watch:
Support: 1.27161
Resistance: 1.29625
💬 What do you think about GBP-USD this week? Let me know in the comments!
Trade safe

GBPUSD Broke the channel support, Fake breakdown? GBPUSD was moving within an upward trend channel, but last week it broke through the lower support line. It is now testing this support, which has become its resistance. Will it decline further, or was this a false breakout? Let's find out.

GBPUSD Sellers In Panic! BUY!
My dear friends,
Please, find my technical outlook for GBPUSD below:
The price is coiling around a solid key level - 1.2800
Bias - Bullish
Technical Indicators: Pivot Points Low anticipates a potential price reversal.
Super trend shows a clear buy, giving a perfect indicators' convergence.
Goal - 1.2936
About Used Indicators:
The pivot point itself is simply the average of the high, low and closing prices from the previous trading day.
Disclosure: I am part of Trade Nation's Influencer program and receive a monthly fee for using their TradingView charts in my analysis.
———————————
WISH YOU ALL LUCK

GU-Mon-7/04/25 Top down analysis-Huge liquidity grab on GU!Analysis done directly on the chart
You don't have to be a genius to understand
macro economically what's happening in the market.
Use economic calendar, FinancialJuice to stay up to date.
Not financial advice, DYOR.
Market Flow Strategy
Mister Y

GBPUSD BUY Well let's try another idea for today, i can see gbpusd make 3rd wave up to make HnS pattern and then massive sell if powell doesnt cut rates(emergency) , Monday is scary day and there is chance to lose trades as there is no structure yet , let's see if this plays out !
3 RRR
GL Traders
Not advice !

Bullish Rectangle of CableChart Shapes Work Very Well When News and Financial Indicators also Confirm Them. You See Here a Bullish Rectangle in GBPUSD Day Chart. For Long Time Holders It is A Good Trade Time.

GBPUSD selloffWe wait for this retest and then hope for best, overrall markets should still head downwards as Tariffs are in play, but you always never know what will happen, this will be my play today , I think it was called ''silver bullet'' pattern.
2.7 RRR
GL Traders
Not advice !

GBPUSD SHORT FORECAST Q2 W15 Y25 MONDAY 7TH APRIL 2024GBPUSD SHORT FORECAST Q2 W15 Y25 MONDAY 7TH APRIL 2024
First and full most, It looks good! However, it's important to approach with caution... much like always.
Pay attention to the previous weekly closure. Yes is it showing a rejection BUT in terms of us always expecting a wick fill prior trading in the opposing direction, Would an immediate short make sense?
We need to see clear price action showing us that it is not interesting in retracting the previous weekly wick with clear bearish movement.
More on the set up descriptions later in terms of text but I trust the chart analysis speaks 1000 words.
FRGNT X
GBP/USD Technical Outlook – April 7, 2025GBP/USD Technical Outlook – April 7, 2025 📊
🔹 Current Price: 1.29116
🔹 Timeframe: 15-Minute Chart
📌 Bullish Scenario (Primary & Alternate Paths):
🟢 Price is approaching a minor resistance at 1.29144, and a break above could lead to a push toward:
📍 1.29620 – Short-term resistance
📍 1.30295 – Key target zone
📌 Demand Zones (Support):
🟩 1.29144 - 1.29307 – Retest zone (potential bullish continuation)
🟩 1.27850 - 1.28350 – Major support for rebound if price rejects near-term structure
🛠️ Game Plan:
✅ Look for confirmations (bullish engulfing or breakout retest) around 1.29144 for long setups.
❗ If price breaks below both demand zones, reassess for bearish pressure.
#GBPUSD #PriceAction #ForexAnalysis #FXFOREVER #SmartMoneyConcepts #DemandZone #SupplyAndDemand #15MAnalysis

GBP/USD BUY ENTRY @1.28580 H4 chart analysisEntry Point: Around 1.28580
Stop Loss (SL): Around 1.27183
Take Profit (TP): Approximately 1.31000 (based on the green target zone)
Support Zone: Between 1.27183 and 1.28580 (highlighted in red)
Resistance Zone: Around 1.31000
The setup shows a potential bullish move with a Risk/Reward Ratio of 2.71, indicating a favorable trade opportunity. Let me know if you'd like additional details or tips for presenting this to your client.

GBPUSD H1 | Bullish Bounce Off the127.2% Based on the H1 chart analysis, the price is falling toward our buy entry level at 1.2796, a pullback support that aligns with the 127.2 Fibonacci extension
Our take profit is set at 1.2883, a pullback resistance.
The stop loss is placed at 1.2675, an overlap support.
High Risk Investment Warning
Trading Forex/CFDs on margin carries a high level of risk and may not be suitable for all investors. Leverage can work against you.
Stratos Markets Limited (fxcm.com/uk):
CFDs are complex instruments and come with a high risk of losing money rapidly due to leverage. 63% of retail investor accounts lose money when trading CFDs with this provider. You should consider whether you understand how CFDs work and whether you can afford to take the high risk of losing your money.
Stratos Europe Ltd (fxcm.com/eu):
CFDs are complex instruments and come with a high risk of losing money rapidly due to leverage. 63% of retail investor accounts lose money when trading CFDs with this provider. You should consider whether you understand how CFDs work and whether you can afford to take the high risk of losing your money.
Stratos Trading Pty. Limited (fxcm.com/au):
Trading FX/CFDs carries significant risks. FXCM AU (AFSL 309763), please read the Financial Services Guide, Product Disclosure Statement, Target Market Determination and Terms of Business at fxcm.com/au
Stratos Global LLC (fxcm.com/markets):
Losses can exceed deposits.
Please be advised that the information presented on TradingView is provided to FXCM (‘Company’, ‘we’) by a third-party provider (‘TFA Global Pte Ltd’). Please be reminded that you are solely responsible for the trading decisions on your account. There is a very high degree of risk involved in trading. Any information and/or content is intended entirely for research, educational and informational purposes only and does not constitute investment or consultation advice or investment strategy. The information is not tailored to the investment needs of any specific person and therefore does not involve a consideration of any of the investment objectives, financial situation or needs of any viewer that may receive it. Kindly also note that past performance is not a reliable indicator of future results. Actual results may differ materially from those anticipated in forward-looking or past performance statements. We assume no liability as to the accuracy or completeness of any of the information and/or content provided herein and the Company cannot be held responsible for any omission, mistake nor for any loss or damage including without limitation to any loss of profit which may arise from reliance on any information supplied by TFA Global Pte Ltd.
The speaker(s) is neither an employee, agent nor representative of FXCM and is therefore acting independently. The opinions given are their own, constitute general market commentary, and do not constitute the opinion or advice of FXCM or any form of personal or investment advice. FXCM neither endorses nor guarantees offerings of third-party speakers, nor is FXCM responsible for the content, veracity or opinions of third-party speakers, presenters or participants.

GBPUSD BUY offered to you on a platter!!Dont miss out on this move guys. The tariff will bring dxy down first before we go up. Dont use because the news seems bullish for dollar and miss out this move.
Noone knows what the tariffs mean, I can only interpret the chart and all I'm seeing now is bullishness. BUYYY

Falling towards pullback support?The Cable (GBP/USD) is falling towards the pivot which is a pullback support and could bounce tot he 1st resistance which acts as a pullback resistance.
Pivot: 1.2771
1st Support: 1.2551
1st Resistance: 1.3100
Risk Warning:
Trading Forex and CFDs carries a high level of risk to your capital and you should only trade with money you can afford to lose. Trading Forex and CFDs may not be suitable for all investors, so please ensure that you fully understand the risks involved and seek independent advice if necessary.
Disclaimer:
The above opinions given constitute general market commentary, and do not constitute the opinion or advice of IC Markets or any form of personal or investment advice.
Any opinions, news, research, analyses, prices, other information, or links to third-party sites contained on this website are provided on an "as-is" basis, are intended only to be informative, is not an advice nor a recommendation, nor research, or a record of our trading prices, or an offer of, or solicitation for a transaction in any financial instrument and thus should not be treated as such. The information provided does not involve any specific investment objectives, financial situation and needs of any specific person who may receive it. Please be aware, that past performance is not a reliable indicator of future performance and/or results. Past Performance or Forward-looking scenarios based upon the reasonable beliefs of the third-party provider are not a guarantee of future performance. Actual results may differ materially from those anticipated in forward-looking or past performance statements. IC Markets makes no representation or warranty and assumes no liability as to the accuracy or completeness of the information provided, nor any loss arising from any investment based on a recommendation, forecast or any information supplied by any third-party.

GBP/USD Long using Fib levelsI will keep analysis brief. I believe we will raid the lower channel then sweep above liquidity and then let the dollar decide it's move based on equity sentiment in the US market.
2.23 R:R trade. I will not be continuing to trade FX - I want to attempt given gold has been so volatile and that is usually the only asset which I trade.
Dark purple lines are major weekly Fib levels.
Dashed light red / pink lines are Fib levels on shorter time zones.
Trade set up is marked out in the picture shown here.
Best of luck if you take this set up and please give feedback on what you think of the idea or the market itself. Big week ahead for the dollar - we will see whether SPX takes a further dive or capital is introduced and market starts to recover.
Best of luck and remember once you get stopped out walk away. This is not a casino!

