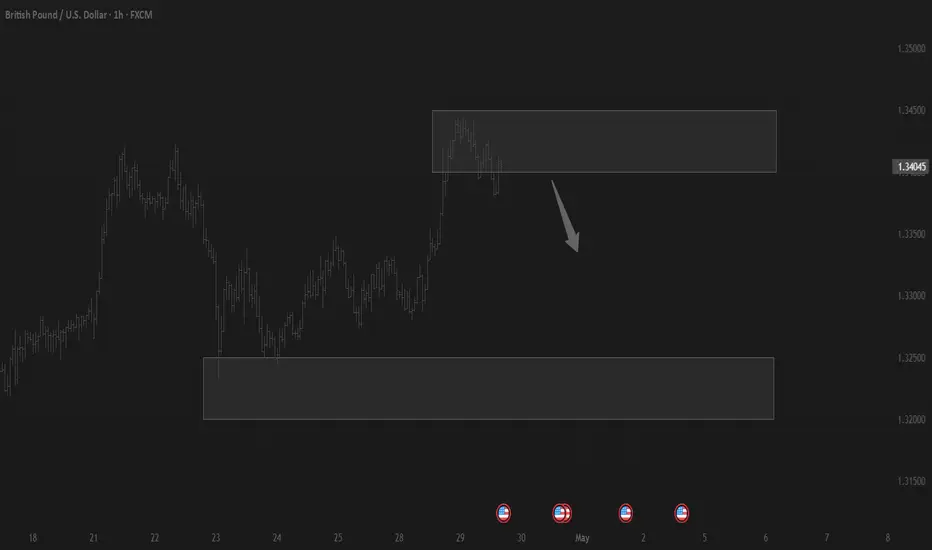
CABLE May Likely Struggle to Rally Above ResistanceGBPUSD previously been rejected and likely to be rejected again to drag pair to its mean before another impulsive movt above the resistance...
N.B!
- GBPUSD price might not follow the drawn lines . Actual price movements may likely differ from the forecast.
- Let emotions and sentiments work for you
- ALWAYS Use Proper Risk Management In Your Trades
#gbpusd
GBPUSD.P trade ideas
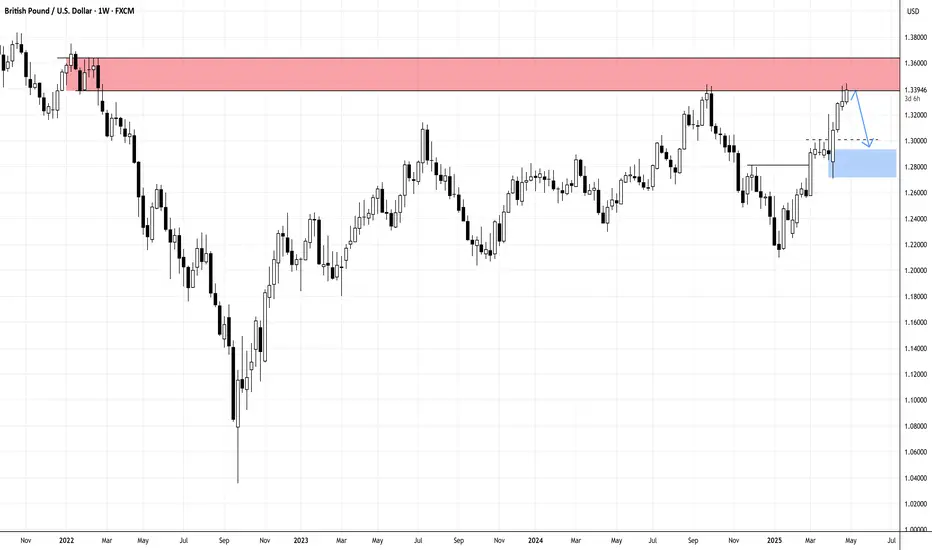
Trading balanceTrading balance The price of the asset has rebounded from the balance zone. With the prospect of growth into the resistance zone.
GBP/USD SELL until NOV 2028Notes in the chart, possibly the 2.61 Stopped out on the last chart , but I didn't factor in Tarrifs

GBPUSD(20250429)Today's AnalysisMarket news:
The U.S. Treasury Department raised its second quarter debt forecast to $514 billion. U.S. Treasury Secretary: The "X Day" for the debt ceiling issue will be announced soon.
Technical analysis:
Today's buying and selling boundaries:
1.3387
Support and resistance levels:
1.3549
1.3488
1.3449
1.3325
1.3286
1.3225
Trading strategy:
If the price breaks through 1.3449, consider buying, the first target price is 1.3488
If the price breaks through 1.3387, consider selling, the first target price is 1.3325

GU-Tue-29/04/25 TDA-Interesting GBP strength yesterday!Analysis done directly on the chart
Interesting GBP strength yesterday compared to its peers
USD, EUR. What could possibly fueled this move up?
Amid of US-China trade war potential negotiation and ahead
of next important week of interest rate decisions.
Comment down below your thoughts!
Not financial advice, DYOR.
Market Flow Strategy
Mister Y

GBPUSD sell biasPrevious resistance was broken thus giving me a bearish bias. I'm waiting for a pullback then enter a short and target the next zone

GBP/USD Price Action Update – April 29, 2025📊GBP/USD Price Action Update – April 29, 2025
🔹Current Price: 1.34082
🔹Timeframe: 15M
📌Key Demand Zone (Support):
🟢1.33837 – Fresh Bullish Base (potential bullish re-entry zone)
📌Key Resistance Level:
🔴Near recent highs (above 1.34600 area – untested liquidity zone)
📈Bullish Outlook:
Price is pulling back after a strong bullish move and is now approaching the 1.33837 demand zone. A clean bullish reaction from this zone can lead price back toward the previous highs. Watch for bullish engulfing or break of structure confirmation.
📉Bearish Outlook:
Failure to hold above 1.33837 could trigger a deeper correction. A break below this zone would weaken the bullish momentum and open the door for a retest of lower intraday levels.
⚡Trade Setup Tip:
✅Look for bullish confirmations near 1.33837
✅Target partial profits near previous highs
✅Use tight SL under demand zone lows for strong risk management
#GBPUSD #ForexTrading #SmartMoneyConcepts #PriceAction #SupplyAndDemand #FXFOREVER #BreakOfStructure #IntradaySetups #MarketUpdate #TechnicalAnalysis

My analysis for GBPUSDPrice was consolidating, then we had a breach to the upside, meaning the big boy are not filled. The cant continue to buy at higher price, they need cheaper price to continue their business.
So we will wait for a pullback(discount) from the seller, before we will continue to buy with the big boy. OANDA:GBPUSD

GU Potential Short to form LTF CorrectionGU Failed to develop into a H&S Structure price now near previous highs failed to break higher
indicating possible larger TF Correction forming
Very possible breakdown of the price to form the LTF Structure

Emerging Swing Trade OpportunityHello,
GBPUSD sees more downside as the dollar stays strong as doubts about fed rate cuts grow so the UK struggles to find a way out of the market slump that it is currently in.Early gains of +0.15% were seen as the USD came under pressure late in NY, following a +0.05% close. Trump advisors considering gradual tariff hikes led to USD selling in late NY. A survey shows UK firms reduced headcount late last year in response to a tax hike. Mixed daily momentum studies and expanding 21-day Bollinger bands are noted in charts. The 5, 10, and 21-DMAs are sliding, with weeklies remaining bearish, indicating a strong negative slip. The focus is on testing the 1.2038 low from October 2023, followed by the 1.1805 low in March 2023. Friday's high of 1.2322 and the well-tested 1.2465 21 DMA are the first resistance levels. Bulls need a close above the 1.2465 21-DMA to gain excitement. A swing trade opportunity is emerging, with strong daily and weekly resistance at 1.226201/1.241555 which have to confirm upside along the way and act as supports. Ultimately, we want the monthly initial support at 1.24809 to hold, ensuring a guaranteed upside.
No Nonsense. Just Really Good Market Insights. Leave a Boost
TradeWithTheTrend3344

GBPUSD- it's breakout? What's next??#GBPUSD... market broke his ultimate resistance and trade above from last week.
So keep close specially pound because if that is a clear breakout then we will go for a longest leg to upside.
Good luck
Trade wisley

Long trade
1Hr TF overview
📈 GBP/USD – Buy-Side Trade
🗓 Date: Wednesday, 23rd April 2025
🕕 Time: 6:00 PM (New York Time)
📍 Session: NY to Tokyo Overlap (PM)
⏱ Entry Timeframe: 5-Minute TF
Trade Parameters
Entry Price: 1.32709
Take Profit: 1.34232 (+1.15%)
Stop Loss: 1.32511 (–0.15%)
Risk-Reward Ratio (RR): 7.69
Reasoning Narrative
This GBP/USD trade was built on a clear short-term bullish structure, observed into the New York close, where price respected a key demand zone from earlier in the day.

Weekly Forex Market Analysis:GBPUSD– Issue 208(Free access)The analyst predicts that the GBP/USD rate will increase within the time specified on the countdown timer. This prediction is based on a quantitative analysis of the price trend
___Please note that the specified take-profit level does not imply a prediction that the price will reach that point. In this framework of analysis and trading, unlike the stop-loss, which is mandatory, setting a take-profit level is optional. Whether the price reaches the take-profit level or not is of no significance, as the results are calculated based on the start and end times. The take-profit level merely indicates the potential maximum price fluctuation within that time frame.

GU Liquidity Game—Institutional Absorption vs. Breakout MomentumGBP/USD Hourly Analysis & Trade Execution
I’ve been closely tracking GBP/USD, and now price is sitting at 1.34208, testing the critical resistance zone at 1.34250. Bulls have maintained control, but I’m watching closely for institutional absorption or signs of exhaustion.
Market Structure & Key Zones
Major Resistance: 1.34250-1.34500 → If buyers hold, price could extend toward 1.34500.
Support at 1.33800-1.33950 → A possible demand zone if price pulls back before pushing higher.
Liquidity Trap Below 1.33650 → A quick dip below 1.33800, followed by aggressive buying, would indicate institutional positioning.
Momentum & Trend Confirmation
RSI (1-hour): 66.38 → Bullish, but nearing exhaustion territory.
Stochastic RSI (1-hour): 61.27 → Buyers are in control but watching for signs of slowing momentum.
Stochastic Fast (1-hour): 60.54 → Trend is intact, but reversal signals could emerge near resistance.
Trade Management Strategy
Setup: Bullish Breakout Continuation
Since price is testing 1.34250, I’ll hold my long position if buyers show sustained strength.
Entry: Holding long if price stabilizes above 1.34250.
Stop Loss: Adjusted to 1.33950 to lock in gains.
Target 1: 1.34500, strong resistance level.
Target 2: 1.34650, extended play if volume supports the breakout.
Setup: Liquidity Sweep & Reversal
If price rejects 1.34250, I’ll look for a pullback setup before re-entering long.
Entry: If price dips below 1.33800 but aggressively reclaims 1.34000, re-enter long.
Stop Loss: Below 1.33650, ensuring tight risk control.
Target 1: 1.34150, reclaiming previous resistance.
Target 2: 1.34350, profit zone if buyers remain strong.
Institutional Activity & Order Flow Considerations
Liquidity Sweeps Below 1.33850 → If price dips but quickly recovers, it could be a stop-hunt before continuation.
Absorption Near 1.34250 → If price holds steady here without sharp rejection, buyers may be absorbing sell-side liquidity.
Volume Confirmation at 1.34150 → If volume remains strong, further upside toward 1.34500 is likely.
Final Execution Adjustments
Monitoring order flow to assess whether institutions are accumulating or distributing positions near resistance.
Watching volume absorption and candle behavior near 1.34250.
Right now, GBP/USD is at a pivotal level—if buyers sustain above 1.34250, the trend continuation toward 1.34500-1.34650 is in play. However, failure to hold may signal institutional selling, triggering a pullback before another bullish attempt.

GBPUSD...LONGOANDA:GBPUSD
Market structure suggests is preparing for its next move. The AND level will likely play a critical role in the upcoming direction.
If structure breaks and confirms the shift, a new bias might form after the retest.

GBPUSD Analysis 10:37am 4/28. Happy Monday! GBP/USD Hourly Analysis & Day Trading Perspective
I’m looking at GBP/USD on the hourly timeframe, where price is now sitting at 1.339, confirming strong bullish momentum after breaking past key resistance. Here's how I'm approaching today's trading plan:
Market Structure & Key Levels
Resistance at 1.33850-1.34000 – Price is testing this level, and volume confirmation will determine whether we continue upward.
Support at 1.33650-1.33700 – If we see a pullback, this zone could act as a strong bounce area.
Institutional Interest at 1.33250-1.33300 – A liquidity zone where major players may absorb sell-side pressure.
Momentum & Trend Strength
RSI (1-hour): 88.88 → Overbought, meaning we might see consolidation or a retrace before another leg up.
CCI (1-hour): 81.81 → Still bullish, but exhaustion signs are creeping in.
Stochastic RSI (1-hour): 83.32 → Buyers are still in control, but reversals become more likely at extreme readings.
Directional Strength & Trend Confirmation
ADX (1-hour): 13.38 → Weak trend strength, suggesting that price could start ranging.
DX (1-hour): 79.92 → A strong push confirms market participation.
Day Trading Plan
Setup: Bullish Breakout Continuation
Since price has cleared 1.33650, the breakout play is already in motion. Here’s how I’m managing the setup:
Entry: Holding long as price remains above 1.33850, with strong buying pressure.
Target 1: 1.34000, a psychological barrier where liquidity may sit.
Target 2: 1.34250, next significant resistance.
Setup: Liquidity Sweep & Reversal
If price retraces, I’ll look for signs of institutional absorption before considering re-entry.
Entry: If price dips below 1.33650 but quickly reclaims 1.33800, I’ll look for confirmation of a reversal.
Target 1: 1.33950, previous high.
Target 2: 1.34200, extended move.
Order Flow & Volume Profile Considerations
Institutional Absorption: If price briefly drops below 1.33800 but quickly reclaims it, institutions could be absorbing liquidity.
Liquidity Trap: A sharp sell-off into 1.33650 could trigger stop losses before a potential bounce.
Volume Confirmation: If buyers remain strong at 1.33850, the move toward 1.34000-1.34250 is more likely.
Risk Management & Execution Strategy
I’ll monitor candle closures above 1.33850 before committing to further upside targets.
If volume increases, I’ll hold for 1.34000; if it slows down, I’ll consider partial profit-taking.
Watching institutional behavior near 1.33650 will be key for catching potential liquidity grabs.
Right now, GBP/USD is at a critical decision point—either continuation toward 1.34000, or a pullback to absorb liquidity before the next push. The key is watching volume flow and price absorption for confirmation before executing further moves.

GBPUSD(20250428)Today's AnalysisMarket news:
The Fed's subsequent policy path considers two scenarios: First, there is no substantial progress in the negotiations between the United States and its trading partners. After 90 days, the US tariffs are still high. Weakened economic demand may prompt the Fed to cut interest rates starting in July, and the annual rate cut may reach 100 basis points; second, the negotiations are fruitful, tariffs are reduced, and the demand shock is small, but inflationary pressure continues. The Fed may postpone easing and only cut interest rates slightly in December. For the market, although the easing comes early in the first scenario, the "recession-style" rate cut may suppress risky assets.
Technical analysis:
Today's buying and selling boundaries:
1.3309
Support and resistance levels:
1.3379
1.3353
1.3336
1.3282
1.3265
1.3239
Trading strategy:
If the price breaks through 1.3309, consider buying, the first target price is 1.3336
If the price breaks through 1.3282, consider selling, the first target price is 1.3265


GU-Mon-28/04/25 TDA-GU is cooling down!Analysis done directly on the chart
What's one lesson you learned through
hard way that you want to share?
Comment down below!
Not financial advice, DYOR.
Market Flow Strategy
Mister Y

Update on GBPUSD to 1.34I had GU pushing to 1.34 on my last Post, we did not got the retest of of 1.30 or 1.28 level but i still capitalized on the move i was expecting, the market has been slow this past couple weeks hopefully this next month coming in we can see a lot more volume / volatility in the market. Overall successful trade.

GBPUSD ANALYSIS In this video we see that the previous week was bullish and we could expect that momentum to continue seeing that the daily and 4hr timeframes all indicate that buyers are currently pushing the market

Strong sell area's for gbpusdNow it's almost completed bullish correction, now we waiting for changing the trend
Market following rhe monthly supply levels
Daily amd weekly oversold pair
Wait to sweep high then sell after confirmation

(GBP/USD) Potential Long Play Position Price currently sits at a double bottom formation. Prices are also at an all time low for this market. When this exact range were first tested it showed a strong and stiff resistance. Going Long here.
