GBPUSD.P trade ideas

#gbpusdThe price can return to the signal range and we enter the trade there. There are two levels, one with low risk and the other with higher risk, and you can enter at both levels.

GBP/USD Hourly Analysis & Scalping Perspective 4/24 10:37pmI’m looking at GBP/USD on the hourly timeframe, where price is currently hovering around 1.33074, showing mild volatility but respecting key levels. Here’s what I see:
Market Structure & Key Zones:
Resistance at 1.33350-1.33490 has been holding firm, with multiple failed breakout attempts. If buyers can finally push through, we might see momentum extend toward 1.33700.
Support at 1.32850-1.32900 has been a demand zone, where price has reacted in the past—this could be an area of institutional absorption before a reversal.
Price is consolidating between 1.33050-1.33350, suggesting indecision and potential liquidity traps.
Momentum Indicators:
RSI (1-hour): 21.69 → Deep in oversold territory, which suggests price could be setting up for a reversal.
CCI (1-hour): -184.71 → Extreme bearish pressure—sellers are in control, but exhaustion may come soon.
Stochastic RSI (1-hour): 0.0 → Completely oversold, signaling a possible bottom formation.
Directional Strength:
ADX (1-hour): 26.10 → Moderate trend strength, meaning price isn’t ranging but also isn’t aggressively trending.
DX (1-hour): 69.10 → Strong directional push, supporting the current bearish move.
Scalping Plan:
Bullish Breakout: If price successfully breaks 1.33490, the next upside target is 1.33700, potentially 1.34000 if buyers hold control.
Bearish Play: If price fails 1.33050, sellers could take control and push it toward 1.32850-1.32900.
Liquidity Trap Setup: A sweep below 1.32850, followed by a sharp reclaim, could signal a fakeout before a reversal.
Right now, I’m closely watching how price reacts around 1.33050—if buyers step in aggressively, a scalp toward 1.33350 could be viable. However, if momentum stays weak and price fails to hold above 1.33050, it’s likely we’re heading into deeper support zones near 1.32850 before institutions re-enter the market.
I’d like to check order flow and volume profile next to see if liquidity is building up at these key zones. That would help confirm whether buyers are genuinely absorbing sell pressure or if we’re in for another wave down before a reversal.

GBPUSD is bearish (selling)GBPUSD has clearly rejected the 1,34235 monthly resistance level, a key area that previously in September 2024 acted as our major zone. Using price action my entry confirmation was after the formation of a Bearish signal ( DOUBLE TOP ) on H1

MMSMA clear sweep of liquidity and a break of structure making it a transactional liquidity. Main focus will be the order block

GBPUSD AnalysisGBP could potentially start its next bearish leg from the current level.
Price has reacted off a lower timeframe IFVG, which is currently acting as support.
If we get a clean close below this IFVG, along with proper short confirmation,
I'll be looking for bearish setups to target lower levels

The Day AheadThursday, April 24 – Market Focus
US Economic Data:
Chicago Fed National Activity Index (March)
Durable Goods Orders
Existing Home Sales
Kansas City Fed Manufacturing (April)
Initial Jobless Claims
International Data:
Japan PPI Services (March)
Germany Ifo Business Climate (April)
France Consumer Confidence (April)
EU New Car Registrations (March)
Central Bank Speakers:
Fed: Kashkari
ECB: Nagel, Simkus, Rehn, Lane
BoE: Lombardelli
Earnings Highlights:
Alphabet, P&G, T-Mobile, Merck, PepsiCo, Gilead, Union Pacific, Comcast
Sanofi, BNP Paribas, SK Hynix, Intel, Dassault Systèmes
Bristol-Myers, Fiserv, Digital Realty, Freeport-McMoRan, Keurig Dr Pepper
Eni, Nasdaq, L3Harris, Vale, PG&E, Orange, Valero, Nokia, Dow
US Treasury Auction:
7-Year Note
This communication is for informational purposes only and should not be viewed as any form of recommendation as to a particular course of action or as investment advice. It is not intended as an offer or solicitation for the purchase or sale of any financial instrument or as an official confirmation of any transaction. Opinions, estimates and assumptions expressed herein are made as of the date of this communication and are subject to change without notice. This communication has been prepared based upon information, including market prices, data and other information, believed to be reliable; however, Trade Nation does not warrant its completeness or accuracy. All market prices and market data contained in or attached to this communication are indicative and subject to change without notice.


GBP/USD Price Action Update – April 24, 2025📊GBP/USD Price Action Update – April 24, 2025
🔹Current Price: 1.32984
🔹Timeframe: 1H
📌Key Supply Zone (Resistance):
🔴1.34128–1.34346 – High-Interest Supply Zone (potential reversal area)
📌Key Demand Zone (Support):
🟢1.32026–1.32138 – Strong Demand Zone (clean rally-base-rally formation)
📈Bullish Outlook:
GBP/USD is pushing upward from the 1.32026–1.32138 demand zone with strong bullish momentum. A clean break above 1.33000 could lead price toward the major supply at 1.34128–1.34346. Look for continuation signals like bullish engulfing or break of structure.
📉Bearish Outlook:
If price fails to break the 1.33000 psychological resistance and starts rejecting, we could revisit the 1.32100 zone. A break below this demand area may open room for deeper correction.
⚡Trade Setup Tip:
✅Buy on retest of demand or confirmation candle
✅Target supply zone with partial profits before 1.34128
✅Keep SL below recent swing low for proper risk control
#GBPUSD #ForexTrading #PriceAction #SmartMoneyConcepts #SupplyAndDemand #FXFOREVER #BreakOfStructure #IntradaySetups #MarketUpdate #TechnicalAnalysis

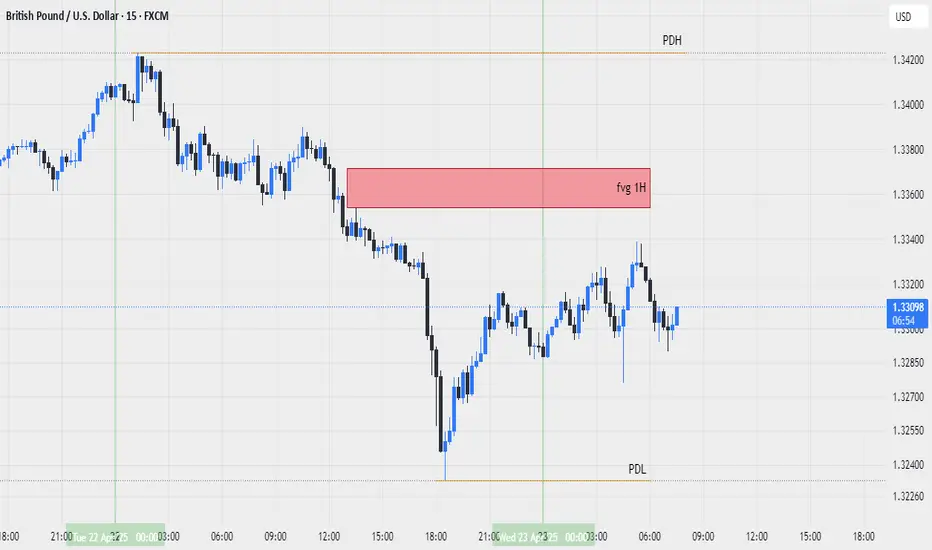
gbpusd 2025-04-24we have some level that we can trade on it .
some level like hunt , pdh and fvg 1hour on top
some level like hunt , pdl and ssl on bottom
we wait to reach price to this level and
if find setup on top for sell and setup on bottom for buy

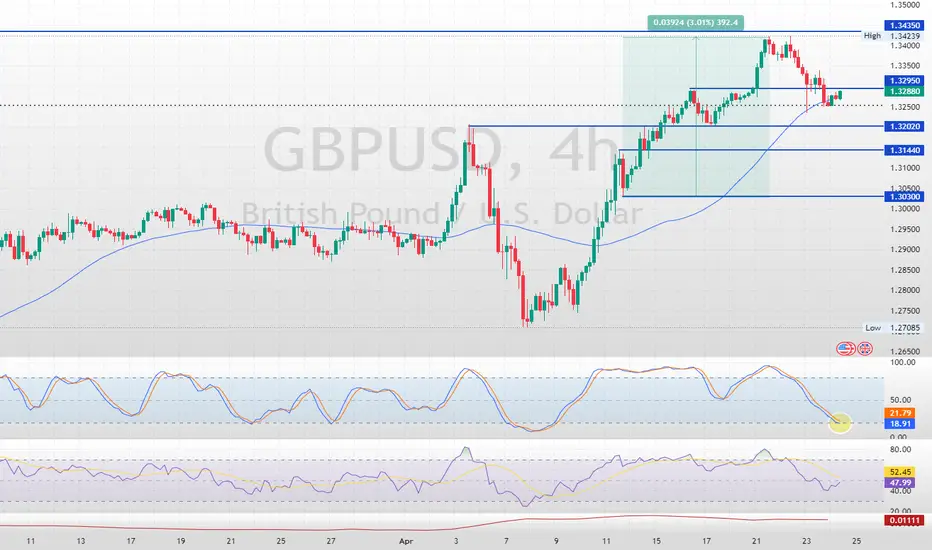
GBP/USD is Bullish: This Breakout Triggers the UptrendFenzoFx—GBP/USD fell from $1.3435, testing the 50-period simple moving average near $1.3276. The Stochastic Oscillator is nearing the 20 level, suggesting the US dollar is overbought in the short term.
Support lies at $1.3202. The outlook remains bullish while above this level, though a close above $1.3295 is needed to confirm upward momentum. A retest of $1.3435 could follow.
Bearish Scenario: A drop below $1.3202 would invalidate the bullish view, potentially extending the decline to $1.3144 or even $1.3030 under sustained selling pressure.
GU-Thu-24/04/25 TDA-GU starting to consolidate!Analysis done directly on the chart
Do you trade more than two pairs?
What's your trading style and how do approach
to markets?
Comment down below!
Not financial advice, DYOR.
Market Flow Strategy
Mister Y

GBPUSD(20250424)Today's AnalysisMarket News:
The United States hit a 16-month low in April. The total number of new home sales in the United States in March was an annualized to a new high since September 2024.
Technical analysis:
Today's buying and selling boundaries:
1.3274
Support and resistance levels:
1.3379
1.3340
1.3314
1.3234
1.3209
1.3170
Trading strategy:
If the price breaks through 1.3274, consider buying, the first target price is 1.3314
If the price breaks through 1.3234, consider selling, the first target price is 1.3209

GBPUSD - SHORT - BREAKDOWNAs you can see that GBPUSD Breakdown and looking for support for rejection
Entry - 1.332 reached
TP : 1.321
SL : 1.337
my OP opened and waiting to entry

Long trade
15min TF Overview
📈 Buyside Trade – GBPUSD
Date: Wednesday, 23rd April 2025
🕘 Time: 8:55 AM (New York Time)
📊 Session: London Session AM
⏱ Entry Timeframe: 5 Minutes
🔹 Entry Price: 1.33029
🔹 Take Profit: 1.33829 (0.60%)
🔹 Stop Loss: 1.32958 (0.05%)
🔹 Risk-Reward Ratio: 11.27
🧠 Trade Rationale & Execution Notes: (Market Context)
Identified a strong bullish structure in the LND session with price respecting prior demand zones.
📉 Volume & Price Spread Insight: Medium to higher volume consistency shows on the Volume spread analysis indicator, providing additional validation of buying interest to add confluence to the directional bias.
5min TF

GBPUSD Analysis 10:06AM. Are the Bear's stepping in? I’ve been watching GBP/USD closely as price continues to slide, now reaching 1.32848. The initial rejection near 1.33250 confirmed institutional sell pressure, and the breakdown below 1.32950 suggests further downside movement.
At this stage, price is sitting just above the 1.32750–1.32800 support zone, which could act as a temporary demand level. If buyers step in here, we might see a corrective bounce toward 1.33050–1.33250, but only with solid confirmation. However, fundamentals remain bearish—UK Services PMI dropped to 48.9, signaling economic contraction, adding further weight to GBP downside.
Technical indicators reinforce the sell-side momentum. MACD remains weak, indicating sellers still control the market. RSI near 41.70 suggests there’s room for further declines but signals that price is approaching oversold territory. The ADX at 29.52 confirms a developing trend, though not yet fully directional.
Given these conditions, my plan remains focused on a sell setup near 1.32950, using it as a retest level. If price rejects this zone, it strengthens the short bias toward 1.32700, a key liquidity target. On the other hand, if price stabilizes at 1.32750–1.32800, I'll reassess whether institutional players are absorbing sell orders for a potential reversal.
Right now, my focus is on price reaction near support. If sellers keep control, this drop could extend further, but if signs of buy-side defense appear, a temporary bounce may develop. I'll wait for clear confirmation before executing my next position.

gbpusd 2025-4-23 updateafter some times new fvg 1hour create , now we waite to reach the price to this level and create down setup

gbpusd 2025-4-23we have two level for trading
fvg 1h hour on top , if price go up and acchive to this level we wait for down setup.
pdl level on down , if price go down and acchive to this level we wait for up setup.
GBPUSD 23.04.2025If price clearly rejects the 1.3335 level (with a strong bearish M15 candle), one might consider a SELL setup with a potential stop-loss above 1.3350 and targets around 1.3310 / 1.3300.
If M15 closes above 1.3345, this could indicate a potential BUY opportunity, aiming for 1.3375 with a stop-loss placed below 1.3320.
Disclaimer: This is not financial advice, just a personal opinion based on chart analysis.

GBP/USD Rejection off the daily 1.32800
I would predict this to buy back up to 1.33200 area , 1.33400 is the next major resistance level

BullI was trained to trade what I see and not what I think. It’s all type of confluences that say a sell. But my break and retest is playing strong , so I did put in a buy for this pair because it broke my consolidation and res tested it so I believe it will go up now but let’s see. I’m prepared for anything.

Bear This pair is going down, that’s my bias for this week . It keeps hitting the top of my consolidation, but all that is , is fake outs . I’m waiting for it to break my consolidation going down .

TECHNICAL ANALYSIS After more than 50% retracement, GU maybe willing to go up to the upside again. Let see what will unfold in some days to come.
