GBPUSD - NEXT STOP @1.34343?1. MARKET OVERVIEW
GU has been on a very strong uptrend since January so i'm expecting that momentum to continue this week aiming for the old high @1.34343 which is also the Previous Year's High (PYH) and a Key Level.
2. KEY LEVELS I'M WATCHING
* Draw On Liquidity(DOL): 1.34343
* Point Of Interest(POI): 1.32411 - 1.32500
3. TRADE BIAS & SCENARIOS
I'll stick on being bullish for the rest of the week until price gets to my target which is the PYH(Previous Year High). I'll execute on my buys only if price trades to my POI before trading to my target, on the condition that price trades higher early in the week and gets to my target(without first trading to my POI) i'll cancel my trade order and switch neutral on my BIAS.
4. FINAL NOTE
Patience is key, i'll wait for price to come to me and not chase price.
Tell me what you guys think about this in the comment.
GBPUSD.P trade ideas

GBPUSD Analysis 4/22 4:51pmGBP/USD Analysis – Institutional Liquidity, Price Action & Trade Setup
Right now, I'm analyzing GBP/USD at 1.33287 in the context of institutional behavior, technical indicators, and upcoming economic events. My focus is on institutional liquidity absorption at resistance, monitoring key levels for an optimal entry.
Technical Overview
Resistance Zone: 1.33895–1.34234 has been a critical level where price struggled to break higher, suggesting institutional absorption.
Support Zone: 1.33200–1.33150 remains an area where buyers could step in, but if it fails, the next downside target is 1.32677–1.32864.
Momentum Indicators: RSI (66.15 on the hourly) signals strong momentum, but MACD shows slight bearish divergence, hinting at trend exhaustion.
ADX Strength: The 30-minute ADX at 73.43 confirms trend momentum, but the hourly ADX at 17.12 indicates slowing movement, signaling potential institutional positioning.
Price Action Insights
Lower Highs Forming: Each successive high has been failing, reinforcing the idea that sellers are stepping in at resistance.
Liquidity Absorption at 1.33895–1.34234: Institutional players might be taking the other side of buy orders, meaning a trap for retail longs before a drop.
Bearish Rejection at 1.33450–1.33600: If price pulls back to this zone and prints a long upper wick, it confirms sell-side control.
Volume Profile & Institutional Activity
Volume Clustering at Resistance: Previous highs show volume absorption rather than continuation, reinforcing a bearish bias.
Delta Imbalance Considerations: Watching sell-side aggression near key levels to confirm institutional pressure.
Accumulation/Distribution Patterns: Weekly AD is negative, indicating some distribution rather than accumulation.
This approach ensures I'm trading with institutional positioning rather than chasing price movements. I remain patient, watching key zones for liquidity absorption before executing.

GBPUSD | 21.04.2025SELL 1.33800 | STOP 1.34600 | TAKE 1.33000 - 1.32500 | We expect the price to decline from the local highs to the formed support.

GBPUSD Analysis 4/22 11:22amJust FYI i entered my last trade too early. Ill make sure all the signals align next time. I took my losses and kept it moving.
GBP/USD Analysis – Institutional Liquidity & Price Action Setup
Over the past few weeks, GBP/USD has been in a steady uptrend, posting higher highs and higher lows. However, 1.34234 remains a critical resistance level, and price is showing signs of absorption, suggesting institutions may be stepping in.
Technical Overview
Recent Highs & Lows: Price peaked at 1.34234, with recent support around 1.33750.
Momentum Indicators: The daily RSI remains elevated near 67.8, signaling strong buying interest, but MACD and stochastic fast readings indicate fluctuations.
ADX Strength: The 30-minute ADX at 72.4 confirms trend strength, but a fading Aroon Oscillator hints that past bullish waves might be losing steam.
Price Action Insights
Higher Highs Forming: The past few days show price continuously pushing up, but rejection wicks near 1.33895–1.34234 suggest sell-side pressure building.
Potential Lower High Formation: If institutions are absorbing liquidity here, they could be preparing to push price down—meaning a short trade setup is forming.
Key Levels to Watch: A break below 1.33750 would confirm bearish momentum, while a clean move above 1.34234 with volume would signal continuation.
Volume Profile & Institutional Activity
Liquidity Absorption at Resistance: Institutions may be letting retail traders push price up while absorbing their buy orders. If volume clusters at the highs without a breakout, this suggests a reversal could be incoming.
Delta Imbalance Considerations: Watching order flow, if sell-side aggression picks up near resistance, it strengthens the bearish case.
Volume Spikes & Clustered Activity: If liquidity at 1.33895–1.34234 shows tapering buy-side volume without a breakout, institutions may be trapping longs before driving price down.
Trade Plan
Given all of this data, my best entry setup is a sell near 1.33895–1.34234, waiting for confirmation:
Hourly Rejection Candles: A long upper wick or bearish engulfing candle near resistance would confirm sellers stepping in.
Target: A downside move toward 1.33200, where prior liquidity sits, would be a strong take-profit zone.
On the flip side, if price breaks above 1.34234 with strong bullish volume, I’ll reassess and look for a buy on a retest, confirming institutional accumulation.
This analysis helps me stay disciplined, tracking institutional positioning and liquidity traps rather than chasing impulsive moves. For now, I’m watching hourly candles and volume behavior at resistance before executing my next trade.

DOW Theory GBPUSD 1 HOUR CHART Higher Highs and Higher LowsDOW Theory GBPUSD 1 HOUR CHART Higher Highs and Higher Lows

GbpUsdlow prop but possible
reason for low prop is the consolidation we in and also just a few pips to last High (24)
good things is price action and time seem to be better today and also its a scalpe targeting within yesterday
range


TRADE IDEIA WORKED OUT. 1.10 RRThe trade idea played out well on GBPUSD with a 1:10 risk-reward. Yesterday, I spotted a shift in structure on the 1H and 4H charts, which led me to switch my bias from buy to sell. Today, I waited for a mitigation at the supply zone to trigger the entry, and I took the trade about 30 minutes before the London open.

GBP/USD is Overbought at Critical Resistance LevelFenzoFx—GBP/USD climbed to $1.3435, a key resistance near the September 2024 high. While the trend remains bullish, overbought signals from Stochastic and RSI-14 suggest limited upside.
If the pair stays below $1.3435, it may retreat to 1.3295 or even 1.3202.
>>> No Deposit Bonus
>>> %100 Deposit Bonus
>>> Forex Analysis Contest
All at FenzoFx Decentralized Forex Broker

Fundamental Market Analysis for April 22, 2025 GBPUSDGBPUSD:
The GBP/USD pair is trading in positive territory around 1.3370 during the early Asian session on Tuesday. Concerns over slowing growth in the United States (US) and worries over the independence of the Federal Reserve (Fed) are driving the US Dollar (USD) lower and creating a tailwind for the major pair.
US President Donald Trump condemned Powell for continuing to maintain a “wait-and-see” monetary policy until there is clarity on how the new tariff policy will affect the economic outlook. In a Truth social media post, Trump warned that the US economy will slow down if Powell doesn't cut interest rates immediately.
Heightened uncertainty surrounding Trump's tariffs and rising trade tensions between the U.S. and China are undermining the U.S. dollar across the board.
On the other hand, softer UK consumer price index (CPI) inflation data for March and global uncertainty paved the way for an interest rate cut by the Bank of England (BoE) at its May meeting. Financial markets are now betting on an interest rate cut at the Bank of England's May meeting, estimating an 86% probability of this happening, according to LSEG data. This, in turn, could affect the Pound Sterling (GBP) exchange rate against the US Dollar.
Trading recommendation: BUY 1.3425, SL 1.3395, TP 1.3510


GBP/USD London Session
📌 Timeframe:1H
📌 Bias: Bullish
📌 Key Levels:
- Sell-side Liquidity Target: 1H SIBI at 1.33930
- Bullish Entry Zone: Consequent Encroachment of the imbalance
- Final Target: 1.34300
Market Context & Analysis
- Asian Session Recap: Price opened and traded higher, leaving behind a **1H SIBI**, which was later tapped into.
- Liquidity Sweep: Price made a higher high before pulling back, now targeting sell-side liquidity at 1.33930.
- Bullish Setup Plan: Expecting price to sweep the **sell-side liquidity**, tap into the Consequent Encroachment of the imbalance, and confirm bullish momentum.
- Final Target: Anticipating a rally toward 1.34300, which aligns with a strong resistance level.
Execution Strategy
1. Wait for Price Action Confirmation
- Look for bullish rejection wicks or strong engulfing candles at the Consequent Encroachment zone.
- Avoid early entries; wait for liquidity grab and clear directional shift.
2. Entry & Stop-Loss Considerations
- Ideal Entry: Once bullish confirmations are observed post-liquidity sweep.
- Stop-Loss: Below the recent **liquidity sweep low** to ensure risk protection.
3. Risk-to-Reward & Position Management
- Aim for R:R ratio of at least 1:3, securing partial profits as price approaches 1.34300
- Monitor market conditions and adjust if necessary based on order flow dynamics.

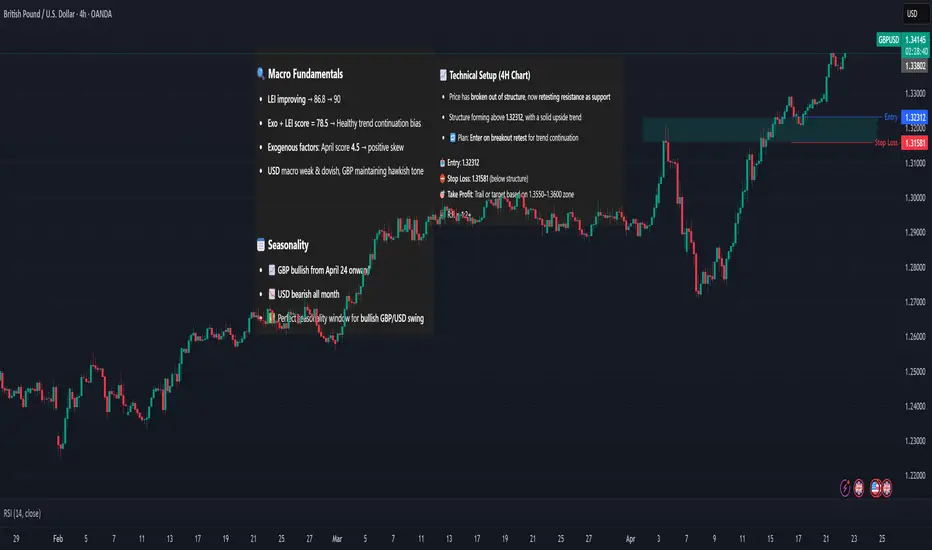
GBP/USD – Breakout Retest Setup🔍 Macro Fundamentals
LEI improving → 86.8 → 90
Exo + LEI score = 78.5 → Healthy trend continuation bias
Exogenous factors: April score 4.5 → positive skew
USD macro weak & dovish, GBP maintaining hawkish tone
📅 Seasonality
📈 GBP bullish from April 24 onward
📉 USD bearish all month
✅ Perfect seasonality window for bullish GBP/USD swing
📊 COT Sentiment
Both GBP and USD = ⚖️ Neutral
→ No positioning pressure, clean technical entry expected
📈 Technical Setup (4H Chart)
Price has broken out of structure, now retesting resistance as support
Structure forming above 1.32312, with a solid upside trend
🔁 Plan: Enter on breakout retest for trend continuation
📥 Entry: 1.32312
⛔ Stop Loss: 1.31581 (below structure)
🎯 Take Profit: Trail or target based on 1.3550–1.3600 zone
🧮 R:R ≈ 1:2+
Week 17 GBPUSD analysis 21042025We keep this analysis simple by looking at the higher time frame and identifying our resistance as around 1.42, while our support is 1.21. Price has been ranging between these two price levels. We see that there is a supply level at 1.34, and we have to wait to see if the price will break above 1.345 either on Wednesday or after NFP next month.
Entry price with pending orders
Buy stop 1.34500
Take profit 1.40
Disclaimer: Not a trading advice, for educational use only. Trade it on demo
If you like my analysis, please give it a boost or let me know how you want to trade it in the comment section.

GBP/USD bulls to mitigate @1.32500 handle as we start the month with trade wars which the cable possibly will not be part of, optimism has grown around a potential Ukraine peace plan reinforcing Britain’s support. Sterling also has gained strength from the expectations that UK interest rates will remain higher for longer. Bank of England Deputy Governor Ramsden highlighted that persistent wage pressures could keep inflation above target, though he noted future rate cuts may not be gradual. This outlook, combined with geopolitical developments, has boosted investor confidence in the pound and so am hoping for a retest to my fair value price @ 1.27000 handle before the bulls comes in and drives the price to my unmitigated zone
1st Tp @1.32500

GBPUSD ANALYSISAfter seeing the week continue the bullish move from last week without any gaps, we could expect the pair to continue to the upside into 1.3500

GBPUSDGBPUSD is sustaining its bullish trend while making new higher highs and higher lows.After some sideways sessiond it is expected to maintain its bullish trend and make new higher highs.

GBPUSD buy setup m15Hello! Friends,
Greetings. Please leave a Like if you like the idea.
Before start talking about technical Let's share your LOVE by giving me LIKES to support this work. Thanks in advance.

GBP/USD For Bullishwait for pull-back near by entry point and then go long
general trend is up trend
have fun :)

correctionThe upward trend is expected to end at the resistance levels. Then the start of a correction wave is likely.

Sell level gbpusdStill buyers dominated don't try to sell till our mentioned selling levels
Gbpusd moving on monthly time frame

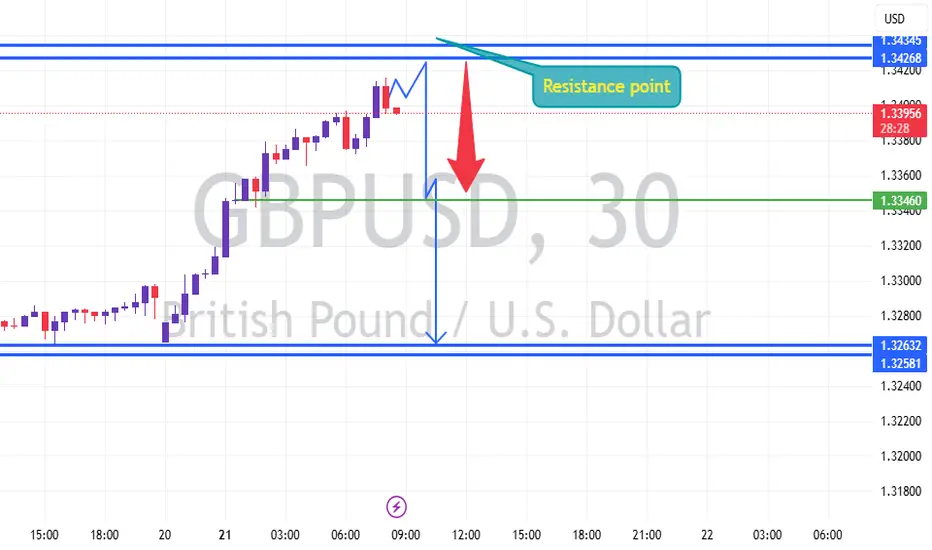
.GBPUSD (M30) ANALYSIS UPDATES
** GBP/USD – 30-Minute Chart**
The GBP/USD pair is currently facing a strong **resistance zone** near the 1.34268 – 1.34345 levels, as marked on the chart. The price has recently rallied but is now showing signs of hesitation below this resistance point.
**Key Observations:**
- The pair is approaching a **resistance level**, suggesting a potential reversal or pullback.
- A **bearish move** is anticipated from this resistance, with a target towards the **1.33460 support** and potentially extending to the **1.32632 – 1.32581 zone**.
- The red arrow indicates the expected downward momentum if the price fails to break above the resistance.
**Trading Strategy:**
- **Sell Zone:** Near 1.34200–1.34345
- **First Target:** 1.33460 (green line)
- **Second Target:** 1.32632
- **Stop Loss:** Above 1.34450 (to stay protected in case of a breakout)
**Note:** Watch for bearish confirmation signals like rejection candles or divergence before entering the trade.