Cable H4 | Falling toward a pullback supportCable (GBP/USD) is falling towards a pullback support and could potentially bounce off this level to climb higher.
Buy entry is at 1.3290 which is a pullback support.
Stop loss is at 1.3192 which is a level that lies underneath an overlap support.
Take profit is at 1.3515 which is a resistance that aligns with the 161.8% Fibonacci extension.
High Risk Investment Warning
Trading Forex/CFDs on margin carries a high level of risk and may not be suitable for all investors. Leverage can work against you.
Stratos Markets Limited (tradu.com):
CFDs are complex instruments and come with a high risk of losing money rapidly due to leverage. 63% of retail investor accounts lose money when trading CFDs with this provider. You should consider whether you understand how CFDs work and whether you can afford to take the high risk of losing your money.
Stratos Europe Ltd (tradu.com):
CFDs are complex instruments and come with a high risk of losing money rapidly due to leverage. 63% of retail investor accounts lose money when trading CFDs with this provider. You should consider whether you understand how CFDs work and whether you can afford to take the high risk of losing your money.
Stratos Global LLC (tradu.com):
Losses can exceed deposits.
Please be advised that the information presented on TradingView is provided to Tradu (‘Company’, ‘we’) by a third-party provider (‘TFA Global Pte Ltd’). Please be reminded that you are solely responsible for the trading decisions on your account. There is a very high degree of risk involved in trading. Any information and/or content is intended entirely for research, educational and informational purposes only and does not constitute investment or consultation advice or investment strategy. The information is not tailored to the investment needs of any specific person and therefore does not involve a consideration of any of the investment objectives, financial situation or needs of any viewer that may receive it. Kindly also note that past performance is not a reliable indicator of future results. Actual results may differ materially from those anticipated in forward-looking or past performance statements. We assume no liability as to the accuracy or completeness of any of the information and/or content provided herein and the Company cannot be held responsible for any omission, mistake nor for any loss or damage including without limitation to any loss of profit which may arise from reliance on any information supplied by TFA Global Pte Ltd.
The speaker(s) is neither an employee, agent nor representative of Tradu and is therefore acting independently. The opinions given are their own, constitute general market commentary, and do not constitute the opinion or advice of Tradu or any form of personal or investment advice. Tradu neither endorses nor guarantees offerings of third-party speakers, nor is Tradu responsible for the content, veracity or opinions of third-party speakers, presenters or participants.
GBPUSD.P trade ideas

Institutional Supply: GBP/USD shortsHey,
Beautiful areas of value are being reached across the board.
First one is this over-extended pound chart, which just reached value.
The 4-hour chart is likely to decelerate today and slowly roll-over.
Kind regards,
Max Nieveld

GBP/USD in terminal phase? This zone could flip everything!📊 Technical Analysis
Price is currently trading in a strong weekly/monthly resistance zone around 1.3390–1.3400, marked by a dense multi-layer supply area. Historically, this level has caused sharp rejections.
From the lows, price completed a steep bullish leg, breaking through several structures. However:
Momentum seems overstretched.
RSI shows potential overbought signals.
There's a likely bearish target zone between 1.2950 and 1.2850, which is a key demand area.
📌 Trade Setup:
I’m watching for exhaustion signals or bearish confirmations on H1 to short from the current resistance, targeting the grey and turquoise zones below 1.30.
🧾 COT Report – GBP
Large Speculators (Asset Managers) still hold a net short position, although they've reduced exposure in recent months.
Leverage Funds remain slightly long, but without strong conviction.
💵 COT Report – USD
Leverage Funds have turned significantly net long on the dollar (strong green line upward since March).
This supports a bearish view on GBP/USD, as USD strength returns.
📉 Summary:
Price is at a key decision zone. A technical correction is possible. COT data supports this view:
GBP remains weak on the institutional side.
USD is regaining strength.

Do or die for gbpusd??I’m closely watching gbpusd once it reaches these highs I see no means for any trades .. keeping in mind it’s also a bank holiday for Europe I’d like to wait and see what happens at this 1.34319 point of reaction along with a demand zone . If I see a nice close on a daily candle or any bearish formation ( besides the weekly double top) I’d consider sells .. a break above that and the 1.35 psychological level , I’d like to believe the bulls are still in control .. nevertheless , this point seems to hold weight . We’ll just wait and see 😎

GBPUSD Happy Easter Traders! 4/20 6:33pm. I’m currently holding a sell position on GBP/USD at 1.32480, and despite price climbing to 1.32942, I see several technical and fundamental factors that support my trade idea.
Fundamental Perspective
Looking ahead, this week presents major economic events that could drive volatility in GBP/USD.
UK PMI (April 23): Manufacturing PMI is expected to drop to 44.1, while Services PMI may soften to 51.0—both indicators suggest economic slowdown, potentially putting downward pressure on GBP.
US Durable Goods (April 24): Forecasts show mixed numbers—headline durable goods is projected at +1.8%, but ex-transportation and ex-defense figures are negative, meaning uncertainty surrounding USD demand.
UK Retail Sales (April 25): The monthly figure is expected at -0.3%, signaling weaker consumer spending. This aligns with my sell bias, as deteriorating UK economic conditions could contribute to pound weakness.
If the UK data disappoints while US figures remain mixed or slightly stronger, GBP/USD could face renewed selling pressure, validating my position.
Technical Analysis - Historical & Indicator Confirmation
Looking at the daily chart, there’s strong alignment between price action and indicator readings that suggest a potential reversal:
Resistance Holding at 1.330–1.331:
The Stochastic at 74.88 suggests GBP/USD is nearing overbought conditions.
The Williams %R at -22.24 reinforces the idea that price is pushing into exhaustion territory.
Support Structure (Where Downside Pressure Could Build):
Immediate Support at 1.326–1.327: Previous lows from April 20 confirm this zone as a critical level for sellers.
Secondary Support at 1.321: Multiple recent price reactions suggest this area could serve as a strong downside target.
Deeper Support at 1.316–1.318: If bearish momentum strengthens, this area represents a key swing low.
Additionally, while price is pushing higher in the short term, it’s trading well above long-term daily EMAs, suggesting the rally is a temporary overextension rather than a sustained breakout. If GBP/USD fails to break above 1.330–1.331, momentum could shift in favor of my sell trade.
Trade Management & Outlook
Despite the recent push higher, I remain confident in my sell position as long as GBP/USD does not break and hold above 1.330–1.331. If price starts rejecting this level, the next downside target could be 1.326, followed by 1.321, where I’d consider taking partial profits.
With fundamental catalysts ahead, volatility will likely increase. If bullish momentum persists beyond 1.331, I may need to re-evaluate my position, but until that happens, my trade setup remains valid.
Final Thoughts
My sell at 1.32480 is built on strong reasoning—key fundamental risks, extended technical levels, and a solid structure of resistance all favor a potential reversal. If sellers step in soon, I’ll have the opportunity to secure profits on a well-planned move. Now, it’s a waiting game to see how price reacts to resistance and upcoming data.

GBPUSD 1H FORECASTHello guys here weekly outlook I hope you are well let me tell you that the price is going to drop, we can enter the sell from here and our target order will remain until the block.

GBPUSD Trade IdeaPlan: Wait for retest for safer trade.
This is just an idea. Please trade safely and use proper management.

Weekly Analysis for GBP/USD Weekly Analysis for GBP/USD
🔍 Technical Outlook by Shaker Trading
✅ Reasons for the Bullish Outlook:
Upward Price Channel (Weekly Chart):
The pair is moving inside a strong ascending channel, confirming a longer-term bullish trend.
Strong Bullish Momentum:
Price action is showing clear bullish strength, with higher highs and higher lows.
Fresh Demand Zones Identified:
Multiple demand zones have formed, offering strong support areas for potential buy setups.
📌 Trading Idea:
We expect a correction from current levels toward one of the nearby demand zones, followed by a bullish continuation.
The area around 1.2700–1.2800 could offer ideal buy opportunities for swing traders aiming for higher targets.
🔥 Copy Trading for Free
Join our Copy Trading system and follow top-performing strategies – absolutely free. No commissions, no subscriptions.

GBPUSD: Bearish Continuation
The recent price action on the GBPUSD pair was keeping me on the fence, however, my bias is slowly but surely changing into the bearish one and I think we will see the price go down.
❤️ Please, support our work with like & comment! ❤️

GBPUSD: Start shorting
GBPUSD has reached a key resistance level, and shorting can start next week
All trading signals are accurate. I will keep sending signals. Don't miss them.
GBPUSD sell@1.3300-1.3350
tp:1.3200-1.3100


Anybody in for a reversal with me?Well, starting with the downtrend structure we had from the 1.34xx seems broken. Apparently, our beloved cable had to take all those early bulls out before it could go back reclaiming money it left at supply.
There are multiple evidences why I think we should be buying GBPUSD. Amongst the most prominent ones, we have:
1- Price being protected (twice) at the demand area
2- BOE held the rates, it does not mean UK is doing great at other variables such as inflation, trade balance, debt, job market etc., it just means they plan to maintain the burden on businesses and public with relatively higher mark ups on public lending. It might be a double edged sword but that is pretty much how capitalist economies maintain and control their inflation rates.
3- Market has not claimed the liquidity at marked supply area ever since it started dropping, so this might be a good start
4- This one might not have matured just yet, but it is diverging bullish here
This is my idea for adding small long positions starting Monday post intraday pullback, if you think I might be wrong, please let me know in the comments with proper reasoning. (saying because I need a reason to reconsider which I might be unable to see lol)
Cheers!

Replay tooling for funJust some friendly backtesting in the morning using some of ICT concepts. The replay tool is great, but limited compared to other platforms in that it shows entire candles before one should see them.
- R2F Trading

UPDATE ON GBP/USD TRADEGBP/USD 1H - Update for those of you who are still in on this trade, as you can see price did in-fact go on to set a new bullish leg after breaking structure to the upside.
A big well done to anyone who jumped in on some additional trades from the previous analysis, I will now be leaving this pair to go on to take profit and once it does, reassess the market and see how we can tackle it moving forward.
This trade is currently running + 144 pips. (+ 6%) 6RR
A big well done to those of you who got involved in this market originally and those of you who may still be in it or got involved with a re-entry.
If you have any questions with regards to the analysis for this trade or the trade itself then drop me a message or comment below and I will get back to you as soon as possible.

GBPUSD(20250418)Today's AnalysisMarket news:
The European Central Bank cut interest rates by 25 basis points as expected, the seventh rate cut in the past year, and this decision was unanimous.
Technical analysis:
Today's buying and selling boundaries:
1.3246
Support and resistance levels:
1.3316
1.3290
1.3273
1.3219
1.3202
1.3176
Trading strategy:
If the price breaks through 1.3273, consider buying, the first target price is 1.3290
If the price breaks through 1.3246, consider selling, the first target price is 1.3219

correctionThe trend change is expected to form in the current resistance range and the start of a downward trend. A break of the support trend line will be a confirmation of the downward trend.

GBPUSD LONDON LONGwhat can i say? i dont have much, i am just tape reading with my knowledge on price action

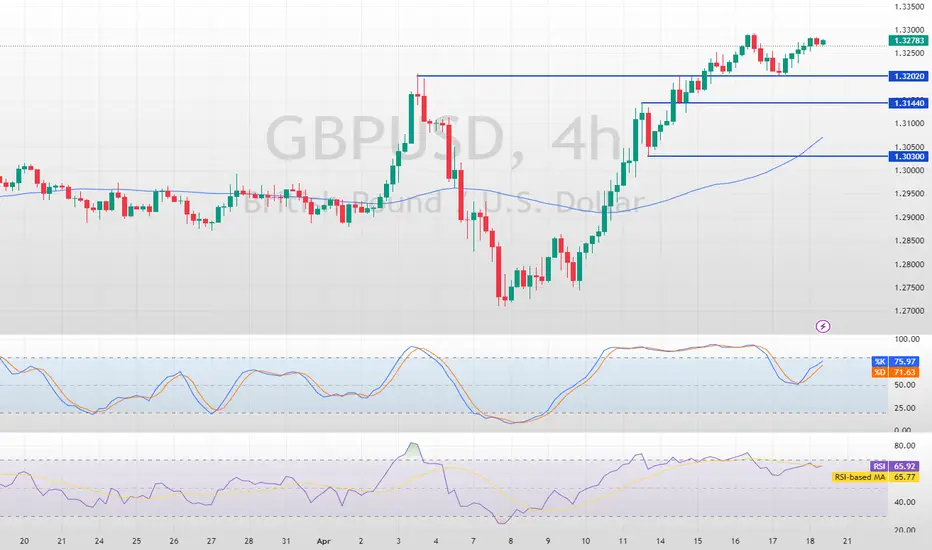
GBP/USD AnalysisFenzoFx—The GBP/USD pair rebounded from $1.3202 support, currently trading around $1.3277 and continuing its bullish trend.
As long as it stays above $1.3144, the next target could be $1.3435. On the flip side, a break below $1.3144 may trigger a bearish move towards $1.3030.
>>> No Deposit Bonus
>>> %100 Deposit Bonus
>>> Forex Analysis Contest
All at F enzo F x Decentralized Forex Broker
GUWe have multiple confluences to look for short positions here. We have some liquidity/equal lows that need to be taken out. We would also be entering a key demand zone as well.

GBP_USD WILL GO UP|LONG|
✅GBP_USD already made a
Retest of the horizontal support
Of 1.3200 and is making a bullish
Rebound so as the pair is in the
Uptrend we are bullish biased
And we will be expecting the
Pair to go further up
LONG🚀
✅Like and subscribe to never miss a new idea!✅
Disclosure: I am part of Trade Nation's Influencer program and receive a monthly fee for using their TradingView charts in my analysis.

GBPUSD:SIGNALHello friends
Given the good growth we had, we can buy within the specified support ranges with capital and risk management because buyers reacted well after the price correction and this could be the beginning of a good growth.
*Trade safely with us*

GBP/USD: The Bear's Ride Down the TrendAs I assess the GBP/USD market today, I see that the current price is 1.32466, and I’ve taken a sell position at 1.32480, which is moving well. Based on recent fundamentals, technical indicators, and historical weekly data, here’s my full market breakdown:
Fundamentals & Economic Outlook
Recent US economic data has provided mixed signals for the dollar:
Initial & 4-Week Jobless Claims: Came in lower than expected, signaling a stronger labor market, which supports USD strength.
Continuing Jobless Claims: Higher than expected, showing some lingering unemployment pressure.
Housing Starts: Significantly below expectations, hinting at weakness in real estate.
Building Permits: Surpassed expectations, suggesting future construction remains strong.
Looking ahead to next week, key events will shape price action:
UK S&P Global PMIs: If manufacturing and services figures improve, GBP may gain traction.
US PMIs & Home Sales: Expected to trend lower, possibly weakening USD momentum.
UK Retail Sales (Friday): Anticipated to drop significantly, which could weigh on GBP.
US Michigan Consumer Sentiment: Forecasted to decline, potentially putting USD under pressure.
With these fundamental factors, GBP/USD faces mixed conditions—potential volatility ahead.
Momentum readings show caution for bulls:
Short-term (1-minute to 15-minute) indicators suggest mild consolidation.
The 1-hour and daily charts indicate GBP/USD is overextended compared to historical averages.
Weekly and monthly averages are much lower (~1.27047 and 1.23141), signaling the risk of mean reversion.
Trading Strategy & Considerations
Since I’m already in a sell position, I’m watching support levels closely for profit-taking zones.
If price dips near 1.3100, I might secure partial profits before assessing further downside potential.
I’ll keep an eye on daily EMA (~1.25176) as a deeper support that might act as a turning point.
Technical divergences (such as the Accumulation Distribution Oscillator) hint at distribution pressure, reinforcing my bearish bias.
With all this being said, i'm looking for a new pair to dive deep into. What do you recommend and why? Im all ears! also dont hesitate to reach out id love to talk about forex! :) im in the works of creating a youtube page and maybe a X account. Hope to reach some of you there as well.
p.s i love this shit!

GBPUSD – Liquidity Sweep & Bearish Market Structure ShiftGBPUSD is showing signs of a potential liquidity grab above a key high. Just above that liquidity area, there’s a Fair Value Gap (FVG), which adds confluence for a potential bearish reversal.
Once the buy-side liquidity is swept, I’m anticipating a bearish Market Structure Shift (MSS). If price returns to the FVG after the shift, that zone would be a potential area for a short entry.
Confluences:
Liquidity above a key high
FVG located just above the liquidity zone
Expected bearish MSS after the sweep
Looking for price to revisit the FVG to confirm a short setup with clean risk management.
