[_] ONENTRYGBPUSD - ‘2FIB Strategy’ by ONENTRY
Timeframe: 30 Minutes
Session: London & New York
---
### **Step 1: Identify the Overnight Range**
- Mark the **high** and **low** of the price range between **00:00 - 06:30 (+2GMT)**.
- Mark up **50% of the overnight range**:
- Wait for a **clear breakout** with a candle *closing* above (for longs) or below (for shorts) the range.
---
### **Step 2: Apply Fibonacci Levels**
- After the breakout, use the **Fibonacci retracement tool**:
- **Anchor Point 1 (Start):** Close of the breakout candle body.
- **Anchor Point 2 (End):** Drag to the **50% level of the overnight range**
- Key retracement levels for entry: **0.5 and 0.35 Fibonacci**.
---
### **Step 3: Trade Execution**
- **Entry:** Enter on a pullback to **0.5 or 0.35 Fib level** after the breakout.
- **Stop Loss:**
- *Long trades:* Below the **low of the breakout candle**.
- *Short trades:* Above the **high of the breakout candle**.
- **Take Profit Targets:**
- **TP1:** 1.0 Fib extension (initial target).
- **TP2:** 1.25 Fib extension.
- **TP3:** 1.6 Fib extension.
- **TP4:** 2.3 Fib extension (runner position).
---
### **Step 4: Trade Management**
- Move SL to breakeven when price hits **TP1**.
- Close all remaining positions before midnight.
GBPUSD.P trade ideas

GBPUSD buy :)This is my trade what i took today, lets see how market plays out , daily timeframe we have strong momentum , we could be bearish only when we see some daily confluence that price will reverse, but for now buys should smash sellers
7 RRR
GL Traders
Not advice !!!

GBPUSD MARKET OUTLOOK AHEAD OF UK INFLATION RATE REPORT.GBPUSD has been performing well so far this week. Today we anticipate uk inflation rate report. A positive outcome can further boost the confidence of buyers to push price higher.

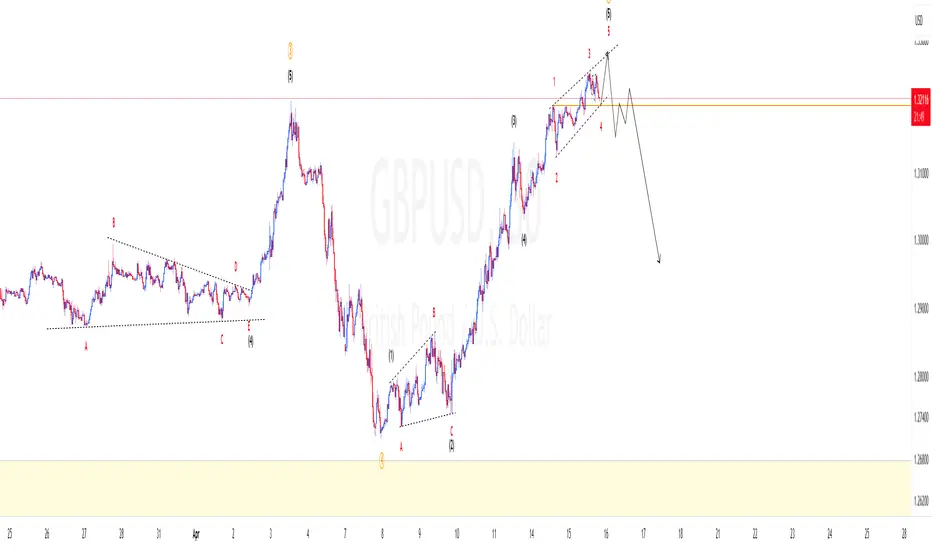
Elliott Wave Confirms That GBPUSD Has Resumed Its Upward MoveGBPUSD has recently broken above its April 3, 2025 peak of 1.3207, which we identified as wave (1) in the chart. This breakout signals a bullish trend starting from the January 13, 2025 low of 1.2705, suggesting more upward movement ahead. The rally from this low follows a five-wave Elliott Wave pattern. This is a common structure in technical analysis indicating a strong trend.
Starting from the January 13 low, the first wave or wave (1) reached 1.3207.,A pullback in wave (2) then followed which ended at 1.2705. This pullback formed a zigzag pattern. Wave A dropped to 1.2823, wave B rose to 1.2934, and wave C fell to 1.2705, completing wave (2).
The pair has now moved higher into wave (3). From the wave (2) low, the first sub-wave (wave ((i))) peaked at 1.2864, followed by a dip in wave ((ii)) to 1.274. The third sub-wave (wave ((iii))) climbed to 1.314, and the fourth (wave ((iv))) dipped to 1.3027. The fifth sub-wave (wave ((v))) is expected to finish soon, completing wave 1 of a larger pattern.
After this, the pair is likely to pull back in wave 2, correcting the upward move from the April 8, 2025 low. This correction could unfold in 3, 7, or 11 smaller swings before the pair resumes its upward trend. In the short term, as long as the 1.27 low holds, any dips should attract buyers in 3, 7, or 11 swings, supporting further gains.

GBPUSD H4 I Bearish Drop Based on the H4 chart analysis, we can see that the price is testing our sell entry at 1.3260, which is a pullback resistance.
Our take profit will be at 1.3166, an overlap support level.
The stop loss will be placed at 1.3368, above the 127.2% Fibo extension.
High Risk Investment Warning
Trading Forex/CFDs on margin carries a high level of risk and may not be suitable for all investors. Leverage can work against you.
Stratos Markets Limited (tradu.com):
CFDs are complex instruments and come with a high risk of losing money rapidly due to leverage. 63% of retail investor accounts lose money when trading CFDs with this provider. You should consider whether you understand how CFDs work and whether you can afford to take the high risk of losing your money.
Stratos Europe Ltd (tradu.com):
CFDs are complex instruments and come with a high risk of losing money rapidly due to leverage. 63% of retail investor accounts lose money when trading CFDs with this provider. You should consider whether you understand how CFDs work and whether you can afford to take the high risk of losing your money.
Stratos Global LLC (tradu.com):
Losses can exceed deposits.
Please be advised that the information presented on TradingView is provided to Tradu (‘Company’, ‘we’) by a third-party provider (‘TFA Global Pte Ltd’). Please be reminded that you are solely responsible for the trading decisions on your account. There is a very high degree of risk involved in trading. Any information and/or content is intended entirely for research, educational and informational purposes only and does not constitute investment or consultation advice or investment strategy. The information is not tailored to the investment needs of any specific person and therefore does not involve a consideration of any of the investment objectives, financial situation or needs of any viewer that may receive it. Kindly also note that past performance is not a reliable indicator of future results. Actual results may differ materially from those anticipated in forward-looking or past performance statements. We assume no liability as to the accuracy or completeness of any of the information and/or content provided herein and the Company cannot be held responsible for any omission, mistake nor for any loss or damage including without limitation to any loss of profit which may arise from reliance on any information supplied by TFA Global Pte Ltd.
The speaker(s) is neither an employee, agent nor representative of Tradu and is therefore acting independently. The opinions given are their own, constitute general market commentary, and do not constitute the opinion or advice of Tradu or any form of personal or investment advice. Tradu neither endorses nor guarantees offerings of third-party speakers, nor is Tradu responsible for the content, veracity or opinions of third-party speakers, presenters or participants.

GBPUSD: Buy Entry Win. HOW LOL
SO I was able to win this. idk how. but..
oh wait I know.
Here's what I did right.
0. I checked the Levels (W>D>HR>KEY LEVELS) of the Forex Market pairs on Saturday.
-I plan to keep re-assessing this every week, as practice, and to see how price is moving.
1. I assessed day bias & market intention. I guess I hit the nail on the head here.
2. Saw price trending up, so I plotted my fib and frvp. Confluenced with FVG.
3. Instead of entering on the OTE Zone, I waited to see if it would be respected. It did.
4. Instead of putting a limit entry, I set an alarm on my intended entry zone. So when it got hit, I setup my buy limit.
-I think I can improve this by putting a buy stop limit on the OTE ZONE as entry trigger, and the actual buy stop at the intended entry zone. So, if OTE is HIT, then activate LIMIT ENTRY @ price breakout(the choch line)
5. I looked farther to the left to see what's a probable target. I found one, so I targeted it. It was the weekly & daily FVGs above.
It's more or less lucky that I hit it? Price really just had a strong momentum... and before the momentum, it hit a bullish fvg below.
What happens after price rebalances an FVG? It seeks liquidity on the opposite side. This is what happened. And I caught it right this time.

GBPUSD: So the highest high would break soon?So strong bullish that keeps everyone out of the trade except the big sharks :) 2 scenarios ready for entry, but I'm skeptical if the sharks would let me tag along...
by the way congrats to anyone catch that big bullish move. look at the volume and I'm so jealous :D
GBPUSD Analysis – Bearish Setup From Premium ZoneAfter a strong bullish rally, GBPUSD is now tapping into a premium zone just below 1.32800–1.33000, an area aligned with an FVG (Fair Value Gap) and potential liquidity grab. The pair looks set for a short-term correction before any further continuation.
🔍 Key Elements of This Analysis:
Premium Price Zone: Price has entered a high-probability reversal zone after a sustained bullish move, reacting within a supply/FVG area.
Liquidity Consideration: Buy-side liquidity above recent highs is likely to be swept before any downside move gains momentum.
Bearish Bias: My short bias is based on exhaustion near premium levels and the potential for a correction into previous demand zones.
🎯 Target Levels:
TP1: 1.3050 (first structure break zone)
TP2: 1.2957 (imbalance fill level)
TP3: 1.2846 (golden retracement zone / higher timeframe demand)
🛡️ Risk Management:
The stop-loss is placed above the previous high at 1.3374, protecting against unexpected breakouts. Entry is based on confirmation of price rejection inside the FVG area.
This trade idea follows my model combining liquidity sweeps, FVGs, and price action within premium zones — staying aligned with macro structure and clean execution.
— Emerson Massawe

GBP/USD Daily AnalysisPrice is in a strong bullish trend.
After 6 bullish candles, we may now see a correction back towards the moving averages as profit taking occurs.
This is just an idea of what may happen. Always trade with a profitable strategy and good risk management.

strict stoploss these type of trades are very good to win the prop firm challenges .high chances or very high chances for markets to go up

short cable , tuesday ny closewith dxy finding its ground poising upside, both eu and gu have begun to exhibit bearish orderflow. looking for cable to reprice lower from the m15 fvg and draw on the orderblock resting below london open SSL

ups of Tuesday, April 15, 2025, the exchange rate between the British Pound (GBP) and the US Dollar (USD) is approximately:
1 GBP ≈ 1.31 - 1.32 USD
Here are some specific rates from different sources found

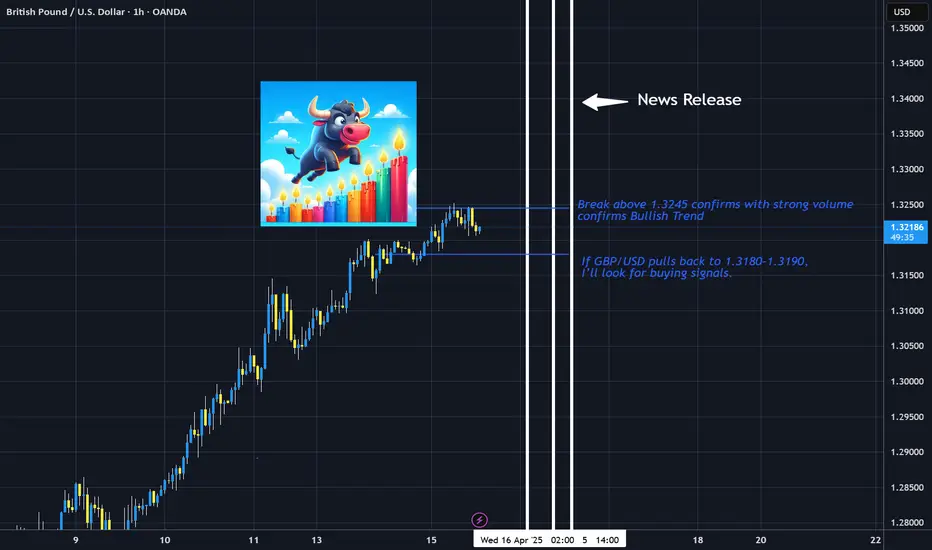
GBPUSD Release the Bulls! 4/15 at 1:09pmHello this is my take on GBPUSD. Given the broader bullish trend in GBP/USD, I believe a long trade is the best play right now, but I’ll be watching key technical levels and upcoming news events to time my entry properly.
Technical Indicators Supporting a Long Trade
Trend Confirmation:
The daily moving averages (EMA, MA, and TEMA) continue to show an upward trajectory, meaning GBP/USD remains in a solid bullish structure. The price is consistently trading above key averages, reinforcing the trend.
The Aroon Oscillator (AROONOSC) on the 4-hour chart is at 85.71, showing strong bullish control. This suggests upward momentum is likely to persist.
Momentum Indicators:
Relative Strength Index (RSI) on the daily timeframe is 76—this does suggest overbought conditions, but in a strong trend, RSI can stay elevated for long periods. Instead of treating this as a reversal signal, I take it as confirmation that buying pressure remains high.
Stochastic RSI (StochRSI) is also at 100 across multiple timeframes, indicating price exhaustion. While this could lead to a short-term pullback, it doesn’t necessarily mean a trend reversal—just that entering on a dip might provide a better price.
Volatility and Market Conditions:
Average True Range (ATR) is rising, meaning market volatility is picking up. This can be useful for timing entries—if I see a pullback within the rising ATR environment, it may be a good chance to enter before the next leg up.
Fundamental Factors to Watch
UK Employment Change (Feb) Beat Expectations:
The UK added 206K jobs, smashing the consensus forecast of 95K. A strong labor market fuels economic stability and consumer spending, which in turn supports the British Pound.
With employment data coming in hot, GBP could remain strong leading into the next major report.
Upcoming GBP Inflation Data (Apr 16):
UK inflation is forecast at 2.7% YoY for March, down slightly from 2.8%. If inflation remains stable or surprises higher, it could further support GBP, as traders anticipate possible moves from the Bank of England (BoE).
US Retail Sales and Powell’s Speech (Apr 16):
The US Retail Sales MoM is expected at 1.3%, but if it underperforms, it could signal weakening consumer demand and hurt the USD.
Fed Chair Powell’s speech could be a major volatility driver—if he hints at slower rate hikes or economic softness, USD could weaken, lifting GBP/USD higher.
US Jobless Claims (Apr 17):
Initial jobless claims forecast at 225K—if this number comes in higher, it might reinforce concerns about a weakening labor market and put more pressure on the Fed to ease policy.
My Trade Plan
Given all of this, I’m looking for a long entry but waiting for confirmation on the hourly chart before entering.
Ideal Entry:
If GBP/USD pulls back to 1.3180–1.3190, I’ll look for buying signals (such as bullish candlestick formations or divergence in momentum indicators).
If it breaks above 1.3245 with strong volume, that could confirm further upside, and I might enter on the breakout instead.
Final Thoughts
The uptrend is strong, but I don’t want to enter at the peak of an overbought rally. Instead, I’ll wait for a pullback or a breakout confirmation before committing to the trade. Additionally, I’m keeping an eye on how the UK inflation numbers and Powell’s speech shape market sentiment over the next 48 hours.
All signs point toward GBP/USD continuing higher, but patience will be key in timing the best entry.
GBPUSD update: Is wave 1 completed?It looks like price is making the 5th wave of the final phase of wave 1 of higher degree. If we are correct we should expect price to drop to create corrective wave 2. To take a chance one should find confirmation possible decline.
GBP/USD For Bearishyou can go short now
general trend is up trend
current phase is pull-back
have fun :)

GBP/USD.. 30M chart patren..GBP/USD short trade setup summarized clearly:
---
Trade Setup:
Pair: GBP/USD
Direction: SELL
Entry: 1.32150
Resistance (Stop-Loss Area): 1.32500
Target 1: 1.31690 (approx. +46 pips)
Target 2: 1.31000 (approx. +115 pips)
---
Risk/Reward Analysis (R:R):
Stop-loss: 1.32500 (−35 pips)
Target 1 R:R: ~1.3:1
Target 2 R:R: ~3.3:1
This setup has a solid R:R if price reacts from the 1.32150 level and respects 1.32500 as resistance.
Would you like a quick technical chart analysis or fundamental outlook to back the trade?

GBPUSD buy Break of structure to the upside .We have been on a buy trend .Market moves to respect the Break and retest and now the we gotta go back to our demand to take more orders to the sky

Short GBPUSDHello Traders,
we are back with our short term investment view in GU, we are seeing potential reversal in GBPUSD till 1.28500 by next two three weeks. We have initiated our shorts from 1.32388 and holding it for TP 1.28500.
Thanks,
Minters


4/15/2025 GBPUSDPossible quick scalp, Price has touched HTF POI but price seems still bullish to reach higher. Used 1 hr BUllish POI for area for entry with ltf refinement. Not my highest probability since price did touch htf POI but i'll risk %.50 since it still looks good/ getting close to end of NY. TP is 50% of the HTF POI

GBPUSD ShortWe have a lot of wicks which indicates slowdown in price and an bearish engulfing, we have an 5m imbalance where my entry is and i can cover the highs with the 10 pip stop.
75% will be taken off at 3RR, rest will go to 8RR asia low or breakeven.

GBPUSD SHORT FORECAST Q2 W16 D15 Y25GBPUSD SHORT FORECAST Q2 W16 D15 Y25
Morning Traders!
Let's await price action to tap into the weekly order block!
From then on, eyes open for 15' breaks of structure. Ensure that key higher low areas and double doubles for potential longs are broken before looking to short a fairly strong looking pound!
We simply await the pull back into s 15' order block that should be created post bearish move we have spoken of above. Upon the turn around in price action, we can be satisfied the bullish trend has exhaust somewhat.
Let's await the setup. No positions on GBPUSD until the above.
FRGNT X

GBPUSD Will Go Up From Support! Long!
Take a look at our analysis for GBPUSD.
Time Frame: 9h
Current Trend: Bullish
Sentiment: Oversold (based on 7-period RSI)
Forecast: Bullish
The market is testing a major horizontal structure 1.308.
Taking into consideration the structure & trend analysis, I believe that the market will reach 1.320 level soon.
P.S
The term oversold refers to a condition where an asset has traded lower in price and has the potential for a price bounce.
Overbought refers to market scenarios where the instrument is traded considerably higher than its fair value. Overvaluation is caused by market sentiments when there is positive news.
Disclosure: I am part of Trade Nation's Influencer program and receive a monthly fee for using their TradingView charts in my analysis.
Like and subscribe and comment my ideas if you enjoy them!
