GBPUSD BULLISH OR BEARISH DETAILED ANALYSIS ??GBPUSD is looking extremely bullish on the daily timeframe, showing strong signs of continuation after a healthy pullback. Currently trading around 1.33000, the pair has respected key Fibonacci levels and is now building momentum to target 1.37000. The structure remains intact with higher highs and higher lows, indicating strong buyer control and potential for further upside movement.
From a fundamental perspective, the British pound continues to outperform as the Bank of England maintains a relatively hawkish tone amid sticky inflation pressures, while the US dollar shows signs of weakening with softer economic data and growing expectations of Fed rate cuts later this year. This divergence between the monetary policies is creating a favorable environment for GBPUSD buyers to dominate.
Technical analysis also supports the bullish bias as price action remains well above the 0.786 Fibonacci retracement level, holding strong support near 1.31650. If price maintains above this zone and breaks past minor resistance near 1.33500, it could ignite a fresh bullish rally toward the psychological level of 1.37000, offering excellent risk-reward opportunities for trend-following traders.
Overall, GBPUSD is positioned perfectly for a strong bullish wave. Traders should stay focused on potential breakout confirmations and capitalize on the momentum, as current market conditions and fundamentals are aligned with a profitable bullish move. This setup remains one of the most attractive trending opportunities on the board right now.
GBPUSD.P trade ideas

GBPUSD SCENARIO 27/04/2025English : According to our analysis, we anticipate a bearish scenario.
Morocan Darija : kanchofo d'apres l'analyse dyalna antsanaw hboot
ATENTION : I only share my ideas, not signals

Potential sell of GBPUSDGBPUSD is currently at a 50% fib retracement area. If it breaks a short term low, it could move to the down-side. News are coming in an hour though so anything could happen. Need more confirmation to enter (a few wicks and a break of a STL).

GBPUSD MUST BUY !You clearly see 8H ( STRONG CANDLE) with so much strenght , i think here we can get easy 100 pip move, ill take this trade and play some video games while it takes my tp :) Stay safe guys and trade what you think is right ! We have chance to take TP in 3 8H candles
4 RRR
GL TRADERS
THIS IS NOT ADVICE !

A short term selling tradeIts the fibs level gives the tp 1 and tp 2 the entry are base on lower timeframe BOS

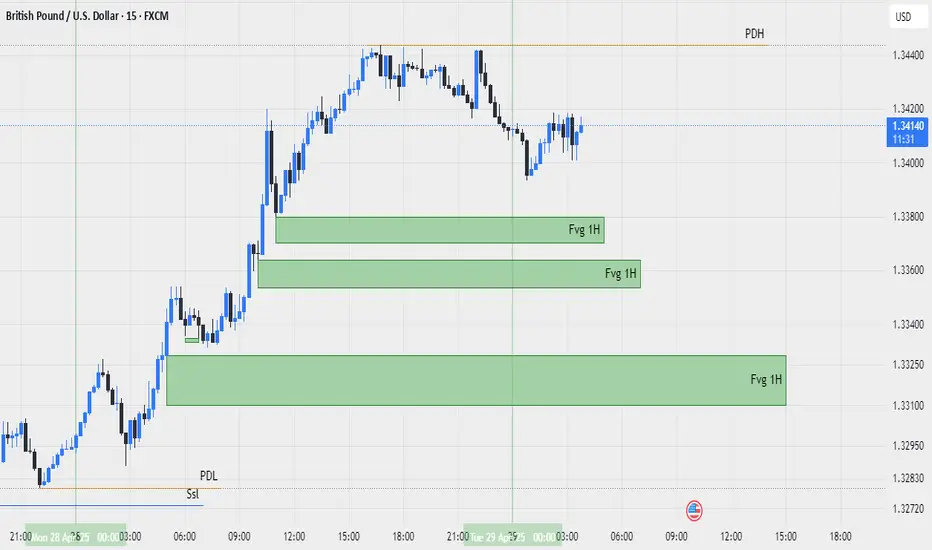
gbpusd 2025-4-29we have some level for trade
on top we have pdh , when price go up and reach to this level we wait to see sell setup
on bottom we have some fvg 1h , when price go down and reach to this level we wait to see buy setup , second fvg is more confident
GBP/USD...1h Chart pattren..My GBP/USD buy signal looks promising. Here's a breakdown:
*Key Points*
1. *Entry Price*: 1.33150
2. *Targets*:
- Target 1: 1.33800
- Target 2: 1.34180
3. *Trend*: Bullish breakout from trendline resistance, indicating potential upward momentum.
*Considerations*
1. *Confirmation*: Ensure the breakout is confirmed with strong volume and a decisive close above the trendline resistance.
2. *Risk Management*: Set a stop loss below the recent support level or trendline to limit potential losses.
3. *Market Sentiment*: Keep an eye on economic news and events that could impact the GBP/USD pair, such as interest rate decisions or economic indicators.
*Next Steps*
- *Monitor the Trade*: Keep a close watch on the trade and adjust your stop loss and take profit levels as the price moves in your favor.
- *Additional Analysis*: Consider using other technical indicators or chart patterns to further validate the trade setup.
Would you like to discuss more about incorporating additional technical indicators or how to handle potential market-moving news?

GBPUSDGBPUSD needs some more messy structure before going to 1.35 level.
Disclosure: We are part of Trade Nation's Influencer program and receive a monthly fee for using their TradingView charts in our analysis.

GBPUSD long to yesterday's London session HighI'm taking a long with a target set at yesterday's London high.
My confluences are
Uptrend in the higher timeframes
Liquidity pool at a 50% fib level
Wick rejections at lower timeframes
Since today has been quite bearish so far this is a riskier trade. The reversal has not established itself yet completely.

Longs after a pullbacklooking to buy i want to see price come down and tag my poi zone before looking to buy

GBPUSD Will Fall! Sell!
Please, check our technical outlook for GBPUSD.
Time Frame: 3h
Current Trend: Bearish
Sentiment: Overbought (based on 7-period RSI)
Forecast: Bearish
The price is testing a key resistance 1.330.
Taking into consideration the current market trend & overbought RSI, chances will be high to see a bearish movement to the downside at least to 1.319 level.
P.S
The term oversold refers to a condition where an asset has traded lower in price and has the potential for a price bounce.
Overbought refers to market scenarios where the instrument is traded considerably higher than its fair value. Overvaluation is caused by market sentiments when there is positive news.
Disclosure: I am part of Trade Nation's Influencer program and receive a monthly fee for using their TradingView charts in my analysis.
Like and subscribe and comment my ideas if you enjoy them!

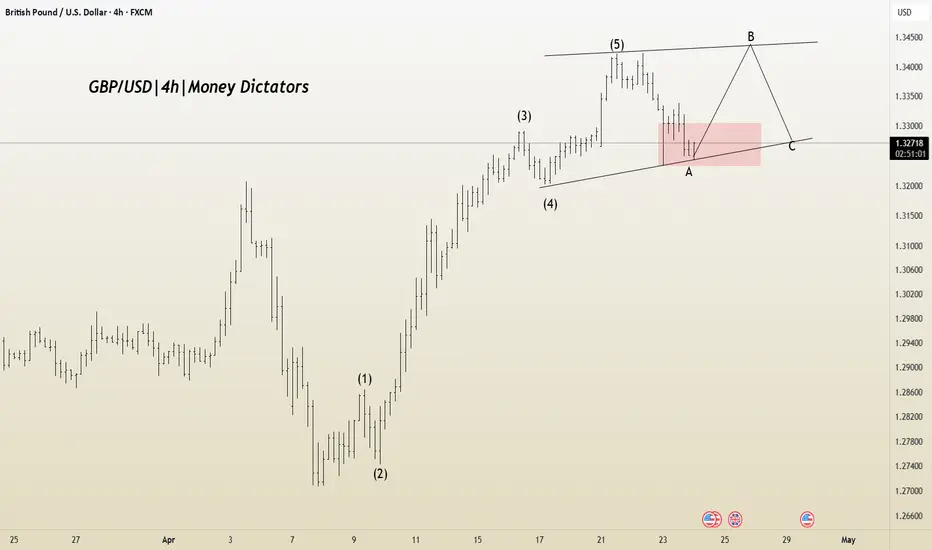
GBP/USD at a Turning Point – Correction Pattern in PlayIt appears that corrective Wave A in the GBP/USD pair is nearing completion, and Wave B may be forming. The Wave 1 to 5 structure seems to have been completed, indicating the beginning of an A-B-C corrective phase.
If the correction unfolds as expected, potential upside targets are 1.32918 and 1.33555. However, if the market faces rejection below the trendline, the stop-loss level would be 1.32021.
GBPUSD - Big Move Setting Up - Elliott Wave AnalysisGBPUSD is currently unfolding a 5-wave impulsive move according to Elliott Wave Theory.
At the moment, we are in Wave 4, which typically corrects against the larger trend.
Key Points:
Wave 2 was a simple correction, so based on alternation, Wave 4 is expected to be more complex (likely an ABC structure).
Wave 4 often retraces to the 38.2% Fibonacci level — in this case, aligning perfectly with a long-term ascending trendline, providing additional confluence for a potential buy zone.
Trade Plan:
- Monitor the ABC correction for completion near the 38.2% retracement.
- Look for bullish confirmation (trendline break, bullish structure shifts, BOS, etc.).
- Entries will be considered after clear signs of bullish pressure.
- Stoploss: Below the lows formed during the Wave 4 correction.
Targets:
First Target: 1.3400 (450 pips)
Second Target: 1.3750 (800 pips)
Summary:
Patience is key during the Wave 4 correction. Once the setup confirms, this could offer a strong risk-reward opportunity within the overall bullish impulsive structure.
See our past GBPUSD setups below:
Swing 1:
Swing 2:
Swing 3:

"GBPUSD Ready for the Kill After Premium Zone Reaction!"⚡ GBPUSD Analysis - 1H Timeframe | April 28, 2025
📈 What's Happening:
GBPUSD just tapped deep into the Premium Zone while simultaneously reacting off a clean Fair Value Gap (FVG).
Signs of bearish rejection are stacking up — Smart Money might be preparing for the kill shot! 🎯
🚨 Key Levels Highlighted:
Strong High = Major invalidation (~1.34317).
Premium Zone = Where sellers ideally step in.
Fair Value Gap (FVG) = Where price imbalance triggered a reaction.
Weak Low = Major liquidity target (~1.32036).
🧠 Key Observations:
Price filled the FVG and immediately showed a reaction = sign of Smart Money stepping in.
Strong High untouched = still valid for bearish play.
Weak Low + Sell Side Liquidity = magnets below.
🎯 2-SCENARIO PLAN:
Plan A — Short Setup (Primary Bias):
✅ Look for bearish confirmation via M15 or M5 structure shift.
✅ Ideal entry around Premium/FVG zone.
✅ TP1 = Minor structure lows around 1.33000. TP2 = Full Weak Low sweep (~1.32036).
✅ SL = Above Strong High (~1.34317).
Plan B — Invalidated if:
✅ Strong High is broken impulsively = setup failed. No chasing!
📊 Risk Management Tip:
"Fair Value Gap reactions inside Premium = sniper-level setups. Focus on confirmations, not assumptions."
🧘♂️ Summary:
✅ Premium Tap ✅ FVG Fill ✅ Bearish Reaction ✅ Weak Low Target
Patience = Power.
This could be the sniper setup you've been waiting for! 🔥
➡️ Save this playbook.
➡️ Comment "SNIPE THE GAP" if you're setting the trap! 🎯

Falling towards overlap support?GBP/USD is falling towards the support level which is an overlap support and could bounce from this level to our take profit.
Entry: 1.3203
Why we like it:
There is an overlap support level.
Stop loss: 1.3056
Why we like it:
There is a pullback support level that lines up with the 50% Fibonacci retracement.
Take profit: 1.3412
Why we like it:
There is a pullback resistance level.
Enjoying your TradingView experience? Review us!
Please be advised that the information presented on TradingView is provided to Vantage (‘Vantage Global Limited’, ‘we’) by a third-party provider (‘Everest Fortune Group’). Please be reminded that you are solely responsible for the trading decisions on your account. There is a very high degree of risk involved in trading. Any information and/or content is intended entirely for research, educational and informational purposes only and does not constitute investment or consultation advice or investment strategy. The information is not tailored to the investment needs of any specific person and therefore does not involve a consideration of any of the investment objectives, financial situation or needs of any viewer that may receive it. Kindly also note that past performance is not a reliable indicator of future results. Actual results may differ materially from those anticipated in forward-looking or past performance statements. We assume no liability as to the accuracy or completeness of any of the information and/or content provided herein and the Company cannot be held responsible for any omission, mistake nor for any loss or damage including without limitation to any loss of profit which may arise from reliance on any information supplied by Everest Fortune Group.

Is the USD strength back or just a pullback??All the information you need to find a high probability trade are in front of you on the charts so build your trading decisions on 'the facts' of the chart NOT what you think or what you want to happen or even what you heard will happen. If you have enough facts telling you to trade in a certain direction and therefore enough confluence to take a trade, then this is how you will gain consistency in you trading and build confidence. Check out my trade idea!!
www.tradingview.com

GBP/USD Pressure Mounts on Weak UK DataThe GBP/USD currency pair faced downward pressure on Wednesday, largely due to disappointing data from the UK’s Purchasing Managers Index (PMI). This index showed a contraction in private sector business activity for April, signaling potential challenges in the UK economy. As a result, the Pound Sterling weakened against its major counterparts during European trading hours, reflecting growing concerns among investors about the economic outlook.
As the day progressed, the focus shifted to the US Dollar (USD), which was buoyed by increasing optimism regarding easing tensions between the United States and China. Investors reacted positively to news surrounding potential diplomatic efforts and economic collaborations, leading to a stronger USD and further pulling the GBP/USD pair lower. This shift in sentiment highlights how geopolitical developments can significantly impact currency markets.
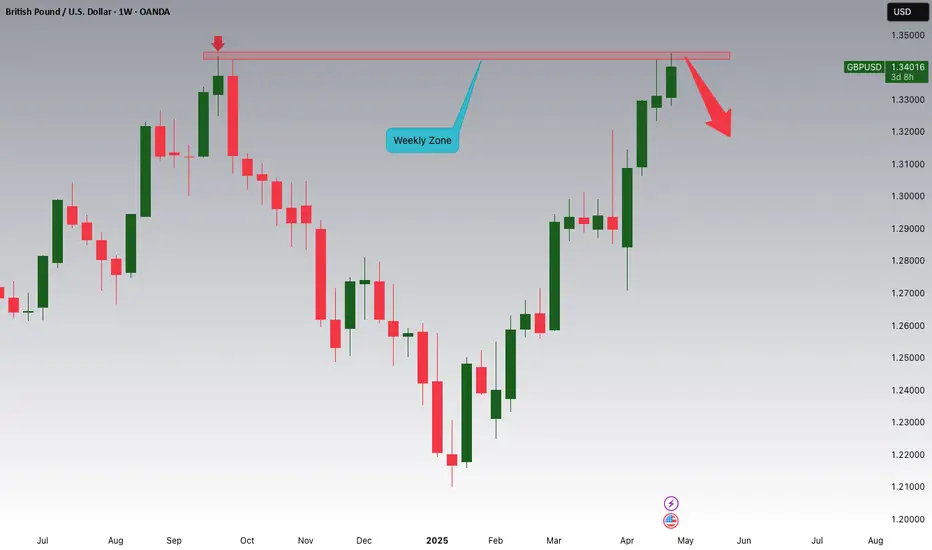
Interestingly, the price action in the GBP/USD pair reached a notable Weekly Supply zone. This area has historically acted as a resistance level, and despite the current bearish trend, many retailers remain bullish on the Pound. This divergence in sentiment suggests that traders are closely monitoring the situation for signs of a reversal. Given the current conditions, there is speculation that the pair could experience a turnaround as it interacts with this important price level.
Overall, the dynamics between the GBP and USD underscore the ongoing volatility in the foreign exchange market, driven by economic data and geopolitical events. Moving forward, market participants will likely keep a close eye on upcoming indicators and developments that could influence the trajectory of this currency pair, particularly in light of the recent fluctuations and the current positioning within the Weekly Supply zone.
Weekly chart 6B1!
✅ Please share your thoughts about GBP/USD in the comments section below and HIT LIKE if you appreciate my analysis. Don't forget to FOLLOW ME; you will help us a lot with this small contribution.

GBPUSD is Forming a Weekly Double Top!!!Hey Traders!
In today's session, we're closely watching GBPUSD for a potential short setup around the 1.34200 level.
The pair is currently forming a double top pattern on the weekly timeframe, a classic reversal signal. Price action is showing signs of rejection at the neckline, suggesting possible downside momentum from this key resistance zone.
Trade safe, Joe.
GBPUSD → A false breakout can trigger a correction FX:GBPUSD is strengthening as part of the rally associated with the fall in the dollar index, but there is a technically strong resistance zone ahead that could trigger a correction...
The dollar index, due to US politics, desire for lower interest rates, tariff war, continues its decline, giving an advantage to the currency pairs of the main basket.
Against this background, the pound sterling is strengthening and is ready to test the key resistance at the moment: 1.343. The huge pool of liquidity, accumulated behind this area may not let the price up at the first time. The last test and confirmation of this level was half a year ago.
Resistance levels: 1.343
Support levels: 1.3292, 1.3207
A sharp approach to resistance, a false breakout without the possibility of growth continuation and consolidation below the resistance 1.3430 may provoke a correction in the imbalance zone or liquidity 1.3292.
Regards R. Linda!

Sell idea!Hello all. after ending the correction market is getting ready to falling sharply as Wave (iii). be happy (wink)

GBPUSD Sell and Buy Trading PlanH4 - We have a clean bullish trend with the price creating a series of higher highs, higher lows structure
This strong bullish move ended with a bearish divergence
While measuring this strong bullish move using the Fibonacci retracement tool we have two key support zones that has formed (marked in green)
So based on this I expect short term bearish moves now towards the Fibonacci support zones and then continuation higher.
If you enjoy this idea, don’t forget to LIKE 👍, FOLLOW ✅, SHARE 🙌, and COMMENT ✍! Drop your thoughts and charts below to keep the discussion going. Your support helps keep this content free and reach more people! 🚀
--------------------------------------------------------------------------------------------------------------------
Disclosure: I am part of Trade Nation's Influencer program and receive a monthly fee for using their TradingView charts in my analysis.

GBPUSD: Eyeing a Bullish Structure Shift - A Wyckoffian ApproachGBPUSD 🚦 Technical Analysis & Trade Plan
📊 Current Market Structure
The GBPUSD 4-hour chart is currently consolidating just below a set of equal highs, indicating a potential liquidity pool above. Price action has shown a series of higher lows, suggesting underlying bullish pressure. The market is in a range, with buyers and sellers in equilibrium, but the clustering of highs signals a likely stop-hunt or breakout scenario.
🧠 Wyckoff Perspective
From a Wyckoff standpoint, the market appears to be in the late stages of accumulation. The equal highs represent a classic “creek” or resistance, where smart money may engineer a breakout to trigger stops and induce breakout traders. A successful breakout, followed by a retrace to retest the broken highs (now support), and a subsequent bullish structure break, would confirm the presence of strong demand and the start of a mark-up phase.
🌍 Fundamental Backdrop
Fundamentally, GBP has been supported by resilient UK economic data and a slightly hawkish tone from the Bank of England, while the USD faces headwinds from softer inflation prints and dovish Fed rhetoric. However, geopolitical risks and global risk sentiment remain key drivers, so any sudden shifts could impact the pair.
📰 Current Sentiment
Market sentiment is cautiously optimistic for GBPUSD. CFTC positioning shows a reduction in net GBP shorts, and recent price action reflects a willingness to buy dips. However, the presence of equal highs suggests that many traders are watching for a breakout, increasing the likelihood of a stop-run before a genuine move higher.
🏦 Trade Idea
Entry: Buy on a confirmed break above the current equal highs (around 1.3340), wait for a retrace to retest the broken highs, and enter long on a bullish structure break (e.g., a higher low and bullish engulfing candle).
Stop Loss: Place stops below the retracement low (e.g., below 1.3300).
Take Profit: Target the next significant resistance zone (e.g., 1.3400–1.3450), scaling out as price approaches these levels.
Risk Management: Risk no more than 1–2% of your trading capital on this setup.
⚠️ Disclaimer
Trading forex involves significant risk and may not be suitable for all investors. The analysis and trade idea provided are for educational purposes only and do not constitute financial advice. Always conduct your own research and consult with a licensed financial advisor before making trading decisions.

GU Re-enter for LONGS. GU Re-enter for LONGS. AFter being stopped in BE Im entering again to this Long trade ideia. I believe we still bullish at this pair. Lets see. Please if ypu take it, put brake even after 1-1RR.
