GBPUSD.P trade ideas

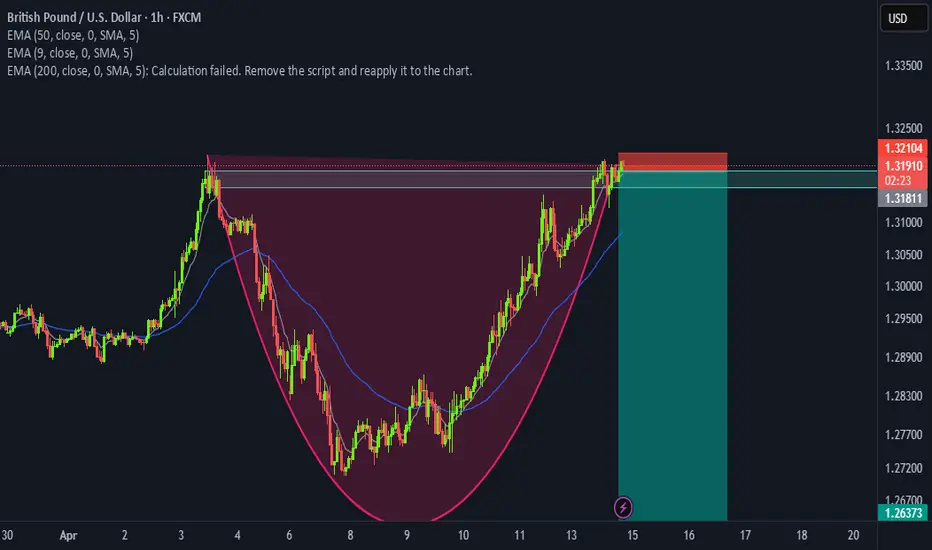
“GBP/USD Long Setup: Demand Zone Bounce Toward 1.35000 Target ”🔍 Trade Setup
🟦 Entry Point: 1.32171
➤ Price is near the 7 EMA – good for a possible bounce.
🟩 Demand Zone: 1.31761 - 1.31500
➤ This is where buyers previously stepped in.
➤ Strong support area – watch for bullish reversal candles here.
🔻 Stop Loss: 1.31141
➤ Below the demand zone to protect against a fakeout.
🎯 Target Point: 1.35000
➤ Big upside target – aiming for a strong rally.
⚖️ Risk to Reward
❌ Risk: 1.32171 → 1.31141 = ~103 pips
✅ Reward: 1.32171 → 1.35000 = ~283 pips
⚖️ R:R Ratio: ≈ 1:2.75 – very favorable!
✅ Summary
🔸 Trend is bullish with strong momentum
🔸 EMA is acting as dynamic support
🔸 Demand zone is clearly respected
🔸 Great R:R setup for a long trade

UPDATE ON GBP/USD TRADEGBP/USD 15M - How we getting on people I hope you are all okay, as you can see price has played out very well for us overnight and we are seeing price really take off.
I have gone ahead and taken another partial here just to bank some profits from the trade which as a result removes risk from the market as well.
This trade is currently running + 100 pips. (+ 4.3%) 4.3RR
A big well done to all of you who jumped in on this position, if you have any questions with regards to the analysis or the trade itself then please drop me a message or comment below.
Its so important that you manage your trade correctly and you take partials throughout the position. As I have mentioned I have taken a partial here for 50% of my position.

GBPUSD approaching Daily Supply ZoneGBPUSD approaching Daily Supply Zone
Expected to take daily supply and retrace before further up journey

Is it yearly bottom?On weekly TF Cable is still bullish, Making a corrective pattern, some would say ABCD, or running flat.
its likely that it could be the bottom of the year 2025 and we see sharp bullish move towards 1.4.

GBPUSD Elliott Analysis The pair seems to complete its 5 wave and start a correction as shown, if this is true then we could expect a long 3 wave.

GBPUSD - In Rising Wedge Reversal PatternObserved that GBPUSD chart in 1h timeframe is breaking Rising Wedge Reversal Pattern in uptrend with Bearish Divergence.
EP: 1.3121
SL: 1.3227
TP: 1.3018

GBP/USD Price Action Update – April 15, 2025📊GBP/USD Price Action Update – April 15, 2025🎯
🔹Current Price: 1.32018
🔹Timeframe: 15M
📌Key Support Levels (Demand Zones):
🟢1.31461 – Major Demand Zone (TP 2 – Wait for Confirmation)
📌Key Resistance Levels (Supply Zones):
🔴1.32575–1.32670 – Supply Zone (Marked on Chart – Watch for Rejection)
📈Bullish Scenario:
Price is showing bullish structure and could push toward the 1.32575–1.32670 supply zone. A clean breakout and close above 1.32670 may signal further upside momentum.
📉Bearish Scenario:
If price reacts bearishly at the supply zone, a reversal could drive GBP/USD down to the demand zone near 1.31461 (TP 2). Watch for confirmation before entering short positions.
⚡Trading Tip:
✅Wait for bearish confirmation (e.g., bearish engulfing or rejection wicks) in the supply zone before shorting.
✅If price breaks the structure with strong bullish momentum, reassess short entries and look for long opportunities.
✅Use strict risk management and a solid risk-reward ratio.
#GBPUSD #ForexTrading #SmartMoneyConcepts #SupplyAndDemand #IntradaySetup #ScalpingStrategy #PriceAction #MarketStructure #FXFOREVER #LiquidityZone #TechnicalAnalysis #TradePlan

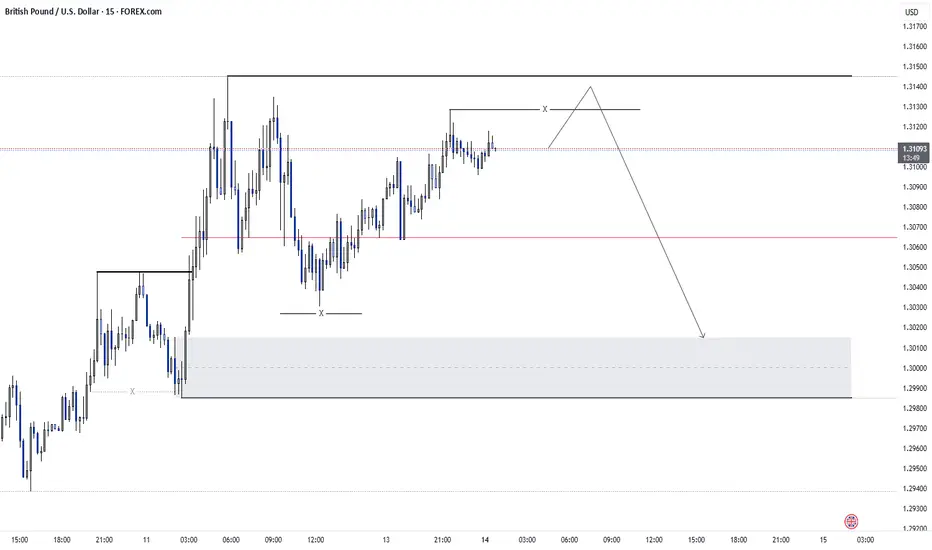
GU-Tue-15/04/25 TDA-Heavy pullback on GU before continuation?Analysis done directly on the chart
Unpopular facts:
Win rate doesn't matter, in the end it always
comes down to how much you win versus how
much you lose. You can have high win rate
with little profits and one big loss to ruin all.
Regardless of win rate, the better trader you are
the more you profits and the less you lose.
Not financial advice, DYOR.
Market Flow Strategy
Mister Y

Eur/Usd Up TrendDaily it clearly a bullish
H1 as well bullish trend
So having that in mind, idealis to see Asian session low as Lq lvl and extreme demand makes sense as POI to continue the trend

Gbpusd support sell signal GBP/USD could face immediate resistance at 1.3200 (static level) ahead of 1.3270 (static level) and 1.3300 (round level). On the downside, first support could be spotted at 1.3150 (static level) before 1.3100 (round level, static level) and 1.3040 (static level).
GBP/USD rose three-quarters of one percent on Monday, climbing for a fifth straight trading session as the Pound Sterling continues to reclaim ground against the softening Greenback.

GBP/USD: Bearish Divergence Flags Pullback Risk Bearish divergence between RSI (14) and price should have GBP/USD traders alert to the risk of a potential partial reversal of the recent bullish move.
Those contemplating the setup could look to sell around current levels or slightly higher, with a stop placed above the recent high of 1.3207 for protection. Bids may emerge around 1.3140—the high set last Friday—although 1.3045 screens as a more appropriate target, given the amount of price action seen either side of it over extended periods last year. While RSI (14) has diverged from price, MACD continues to generate a bullish momentum signal.
If the rally extends beyond 1.3207, the bearish setup would be invalidated.
Even though price and momentum signals favour upside, signs of stability in U.S. Treasuries and stocks—two markets that likely contributed to last week’s U.S. dollar weakness—may support the greenback in the near term.
Good luck!
DS

GBPUSD Analysis 4/14 at 7:11pm I've been closely watching GBP/USD, and as of now, the pair is trading at 1.31771. Based on my technical analysis and upcoming market events, I believe the best trade setup is a short position, but only after confirming a rejection near 1.316–1.317.
Why This Short Trade Makes Sense
Overbought Conditions
The daily RSI is at 76.08, meaning the pair is in overbought territory. This increases the likelihood of a pullback rather than a continued rally.
Other momentum indicators (like Stochastic RSI) show that buying pressure is weakening, further supporting the case for a reversal.
Key Resistance at 1.320
Price has tested 1.320 multiple times but failed to break above it, reinforcing this area as strong resistance.
The recent high at 1.31998 showed rejection, indicating that bullish momentum is struggling.
Upcoming Fundamental Events
The UK retail sales data exceeded expectations, providing some short-term support for GBP.
However, upcoming major US economic releases—including Empire State Manufacturing and Retail Sales—could shift sentiment.
With Fed Chair Powell speaking on April 16, volatility is expected, and I prefer to wait for these catalysts before fully committing to a position.
My Trade Plan
Entry: I’ll wait to sell GBP/USD after confirming rejection at 1.316–1.317.
Final Thoughts
I’m waiting for clear price rejection before entering. If GBP/USD struggles to break higher and starts reversing at 1.316–1.317, that’s my signal to short. At the same time, I’ll watch how the upcoming economic events influence market sentiment—especially the US retail sales data and Powell’s speech.
This approach ensures I’m trading based on confirmation rather than speculation, reducing the risk of entering prematurely.

GBPUSD - Intraday Analysis: Expect a slight correctionIt is true that the order flow is bullish on the daily timeframe, but on this timeframe, the price has reached an order block. Considering the price reaching a P/D array on the 4-hour timeframe, I expect the price to move towards clearing the liquidity of the internal range on the 15-minute timeframe after clearing the liquidity of the external range.
gbpusdpotential opportunity for a short position.
- consolidating around the R zone
- used the arc for extra SR line
- wicks looking bearish
GBPUSD - Longs - Fundamental Analysis My trade idea for GBPUSD:
DXY (USD) News:
On 2nd April 2025, US president Donald Trump announced tariffs of 10% on most imports and up to 145% on Chinese goods. This has led to significant market volatility. Investors are increasingly concerned about the U.S.'s economic direction, prompting a shift away from dollar-denominated assets. This sentiment has been exacerbated by fears of a potential recession, as highlighted by JPMorgan Chase's forecast.
Major foreign investors, including those from China and Japan, are reportedly reducing their holdings in U.S. Treasury bonds. This retreat diminishes demand for the dollar, contributing to its depreciation.
Conclusion: We can expect a further decline in DXY price. Possible opportunity to long XXX/USD pairs.
BXY (GBP) News:
The UK economy grew by a faster-than-expected 0.5% in February, official figures showed.
Conclusion: With US placing tariffs globally, we can expect USD weakness over the next 2-3 weeks. GBP holds its ground with strong economic figures from Q1.
My trade position:
Between 14 - 18 Apr, I will be monitoring price action. Looking to buy below 1.32 with the first target being 1.35. 1.29 offers strong support.

GBPUSD: Continue to riseFor GBP/USD, we still mainly choose to go long during the pullback and go short as a supplement.
GBPUSD trading strategy
buy @:1.31900-1.32100
sl 1.31000
tp 1.32750-1.32850
Today, the trend of GBPUSD basically coincides with what I predicted yesterday. You can click on my personal profile to view the previously published content.

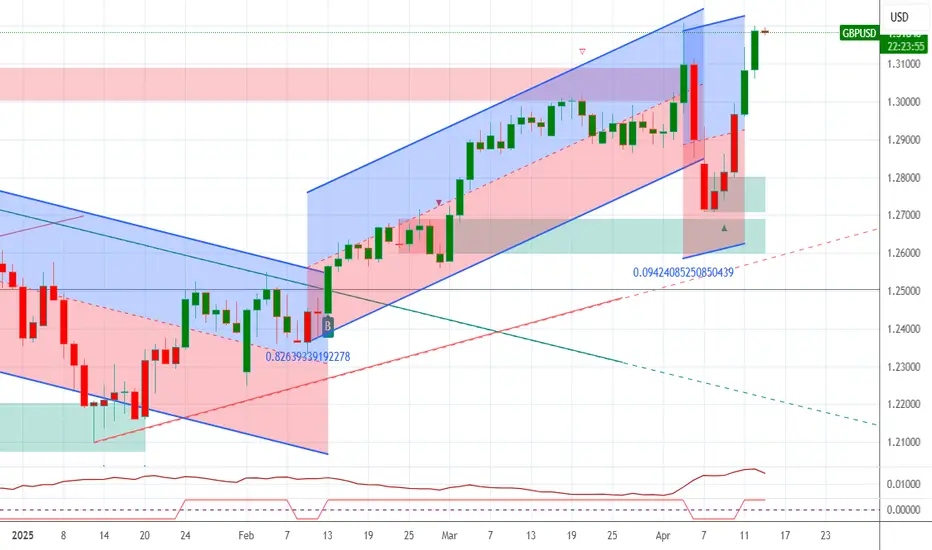
GBPUSD Bullish ChannelIt looks as though GBPUSD is about to expand higher in this exponential resistance pattern. I am awaiting a retest on the trend line before a bounce higher.

GBP/USD Breaking Key Fib Level, Bulls Eye September HighsThe British pound surged through the 78.6% Fib retracement near 1.3149, extending its post-breakout rally with a +0.77% daily gain. Price is now on track to test the September swing high at 1.3440 — the next major resistance zone.
📈 Price has reclaimed both the 50- and 200-day SMAs
📊 MACD is showing bullish momentum above the zero line
📍 RSI sits at 64.98 — bullish, but nearing overbought territory
As long as GBP/USD holds above 1.3149, the path of least resistance remains higher. A clean break above 1.3440 would confirm a major trend reversal and open the door to a broader bullish cycle.
-MW

GBPUSD Analysis 4/14/2025 1:35pmI've been closely watching GBP/USD, and as of now (with the pair trading around 1.31808), I see it moving within a tight consolidation range—roughly between 1.307 and 1.320. Given that I'm near the upper end of this range, I feel that jumping in right away could expose me to potential reversals or whipsaw moves.
My plan is to take a short position, but only after the market pulls back to around 1.316. I view that level as a more attractive entry point since it’s toward the lower side of the current consolidation. This strategy offers me a better risk/reward setup; I can tighten my stops (placing a stop loss above recent highs around 1.320) while aiming for a move down toward the support area, which I expect could be around 1.304–1.305 if the sell-off continues.
In addition, there are several high-impact economic events coming up for both the UK and US—ranging from GBP retail sales and employment data to key US manufacturing, retail sales, and even a speech from Fed Chair Powell. With all that volatility on the horizon, I prefer to wait and see how the news plays out. This way, I can avoid being caught in erratic moves and let market sentiment become clearer before I commit to my trade.
To sum it up: I'm planning to short GBP/USD by waiting for a pullback to about 1.316, with a stop set just above 1.320, and a target closer to the lower support around 1.304–1.305. This approach takes into account the current consolidation, technical signals (like overbought conditions), and the upcoming fundamental catalysts that could swing the market.

Temporary ShortsExpecting GBPUSD short now in the midst of NY session. We can see a pattern or channel in which price is currently dancing to. Let us see if it respects the buys.

GBPUSDMy option about gbpusd Is more bullish so that zone is good and strong support,if the price comes to that zone it can pullback
