GU-Fri-11/04/25 TDA-Weekly is flipping due to CPI lower!Analysis done directly on the chart
Just keep doing! One day mistakes will
not define you as whole. We are humans,
we make mistakes and we should learn
from them as a way to tell us that what
we are currently doing might not be enough.
Not financial advice, DYOR.
Market Flow Strategy
Mister Y
GBPUSD.P trade ideas


GBP/USD at a Crossroads: Imminent Breakout or Bull Trap?The weekly chart of GBP/USD shows a strong recovery following the late-April correction, which brought the price down to a key demand zone between 1.2550 and 1.2600. The bounce was sharp and decisive, but the pair is now facing resistance between 1.3000 and 1.3150 — a previously sold area marked by a visible supply block in red.
The current weekly candle reflects a bullish reaction, but the overall structure suggests a potential exhaustion zone for upward momentum. Price action reveals a series of lower highs in the short term, and while the RSI is bouncing, it remains far from overbought, hinting that this move may be just a technical rebound.
From a trading perspective, a confirmed weakness around the 1.3000–1.3150 zone could offer short opportunities with an initial target near 1.2700 and, if extended, down to 1.2550 — a key dynamic support area. On the flip side, a clean breakout above 1.3150 with strong volume and a weekly close would open the door for a new bullish leg toward 1.3300–1.3400.
Conclusion: GBP/USD is currently at a critical juncture. The next directional move will depend on how price reacts to this resistance zone: a confirmed rejection could trigger renewed selling pressure, while a confirmed breakout may reignite the bullish trend.


GBPUSDthis pair has been trending up and we expect it to continue upwards after break and retest of the resistance level, lets keep an eye on the marked levels

GBPUSD H4 | Bearish Fall Based on the H4 chart analysis, we can see that the price is testing our sell entry at 1.3013, which is a pullback resistance aligning with the 61.8% Fibo retracement.
Our take profit will be at 1.2909, a pullback support level.
The stop loss will be placed at 1.3165. a swing high resistance.
High Risk Investment Warning
Trading Forex/CFDs on margin carries a high level of risk and may not be suitable for all investors. Leverage can work against you.
Stratos Markets Limited (tradu.com):
CFDs are complex instruments and come with a high risk of losing money rapidly due to leverage. 63% of retail investor accounts lose money when trading CFDs with this provider. You should consider whether you understand how CFDs work and whether you can afford to take the high risk of losing your money.
Stratos Europe Ltd (tradu.com):
CFDs are complex instruments and come with a high risk of losing money rapidly due to leverage. 63% of retail investor accounts lose money when trading CFDs with this provider. You should consider whether you understand how CFDs work and whether you can afford to take the high risk of losing your money.
Stratos Global LLC (tradu.com):
Losses can exceed deposits.
Please be advised that the information presented on TradingView is provided to Tradu (‘Company’, ‘we’) by a third-party provider (‘TFA Global Pte Ltd’). Please be reminded that you are solely responsible for the trading decisions on your account. There is a very high degree of risk involved in trading. Any information and/or content is intended entirely for research, educational and informational purposes only and does not constitute investment or consultation advice or investment strategy. The information is not tailored to the investment needs of any specific person and therefore does not involve a consideration of any of the investment objectives, financial situation or needs of any viewer that may receive it. Kindly also note that past performance is not a reliable indicator of future results. Actual results may differ materially from those anticipated in forward-looking or past performance statements. We assume no liability as to the accuracy or completeness of any of the information and/or content provided herein and the Company cannot be held responsible for any omission, mistake nor for any loss or damage including without limitation to any loss of profit which may arise from reliance on any information supplied by TFA Global Pte Ltd.
The speaker(s) is neither an employee, agent nor representative of Tradu and is therefore acting independently. The opinions given are their own, constitute general market commentary, and do not constitute the opinion or advice of Tradu or any form of personal or investment advice. Tradu neither endorses nor guarantees offerings of third-party speakers, nor is Tradu responsible for the content, veracity or opinions of third-party speakers, presenters or participants.

Fri 11th Apr 2025 Daily Forex Charts: 8x New Trade SetupsGood morning fellow traders. On my Daily Forex charts using the High Probability & Divergence trading methods from my books, I have identified 8x new trade setups this morning. As usual, you can read my notes on the charts for my thoughts on these setups. The trades being a AUD/JPY Buy, XAU/USD Buy, AUD/USD Buy, XAG/USD Buy, NZD/USD Buy, NZD/CAD Buy, GBP/AUD Sell & GBP/USD Buy. I also discuss some trade management. Enjoy the day all. Cheers. Jim

GBPUSD. Stubborn Bulls.. 4/10 10:15pm.Hello everyone so this is my analysis over the past couple hours. I mean you guys can obviously see GBPUSD bullish. Let's dive a bit deeper into what's really happening...
Fundamentals: I'm seeing stronger GBP data coming into focus for Friday, April 11, 2025. Recent reports show that the UK's trade figures are working in its favor—for example, the non‑EU Goods Trade Balance improved from –£7.07B to –£6.7B, and the GDP MoM for February turned positive at 0.1% (up from –0.1%). Meanwhile, the overall GB Goods Trade Balance has also slightly improved. On the U.S. side, the latest reports (like a PPI MoM at 0.2% and lower Michigan Consumer Sentiment) point to some softness. For me, these fundamentals add extra conviction to a bullish view on GBP/USD because the UK economic data is beating expectations while the U.S. signals are lagging.
OHLC and Price Action: Looking over the hourly charts from today, I've observed that the price has been trading in a relatively narrow band—oscillating between about 1.286 and 1.299. Earlier in the session, there were strong upward moves (with notable gains around 10:00–11:00), but then at 15:00 I saw a pronounced pullback when the candle closed at 1.29375 after touching as high as 1.2979. Later, around 22:00, a bullish candle closed near 1.29876 with a +22.9 pips move, indicating that while buyers stepped in, the market remains choppy. This oscillation tells me that even though the long-term trend appears bullish, the near-term price action is showing signs of overextension and profit-taking.
Technical Indicators: My technical indicators paint a mixed picture. On higher timeframes (1‑hour and above), moving averages like the EMA, DEMA, and KAMA confirm that the overall trend is bullish. However, key support levels—like the HT_TRENDLINE (around 1.28267) and the Stop and Reverse level (about 1.29081)—are well below the current price of approximately 1.29807. This means that, relative to these supports, the price is overextended. Other indicators, like the 1‑hour RSI (hovering near 52) and the MACD, are fairly neutral, but the ATR (around 0.005) confirms that today's volatility is higher than normal. Short-term oscillators and candlestick patterns (such as bearish engulfing or pin bars on the 15‑minute chart) become critical for spotting a reversal signal.
My Overall View and Trade Strategy: Putting it all together, I’m keeping my bullish outlook on GBP/USD in the long run due to the favorable fundamental environment in the UK versus the U.S. On a technical level, however, the price appears overextended based on the OHLC action and indicator readings. I’m watching for clear reversal signals—the formation of a decisive bearish pattern around the 1.292–1.290 range would be my cue. If that happens, I’d close my current bullish trade and consider opening a short position, targeting a move down toward the 1.278–1.281 support area.
GBPUSD - Buy/longpersonal journaling purposes.
78.6 support. low risk entering into European session and probability that it will retrace to 61.8 creates a great risk reward

GBP USD LONG RESULT The British Pound formed an ascending trend after the breakdown
Moved exactly according to our predictions and smashed our TP.

GU Bull runWe have a ascending triangle on the M15 timeframe and we have broken structure on the M2 timeframe. We are in a pullback phase on the M2 chart. we will see the bull run soon.

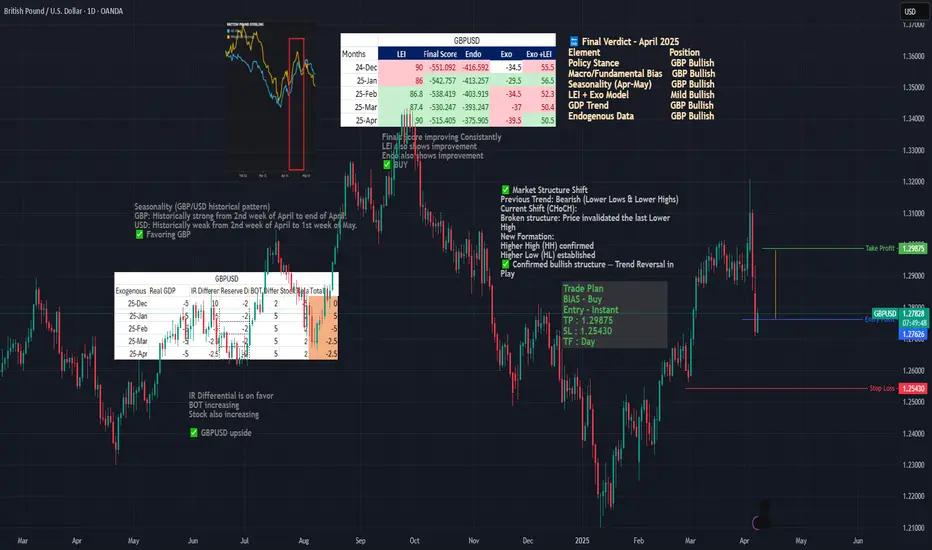
GBP/USD Bullish Reversal – April Seasonality + CHoCH + Macro SetI'm going long on GBP/USD based on a confluence of:
Bullish market structure shift (CHoCH) – Higher High & Higher Low confirmed on the daily chart
Strong April seasonality – GBP tends to rally mid-to-late April, while USD shows weakness
Macro divergence – BOE is hawkish, Fed is dovish; USD flagged as “Strong Sell”
📊 Supporting Fundamentals
GBP GDP improving (1.6%), USD slowing (2.2%)
LEI + Exo model shows stable bullish-neutral momentum
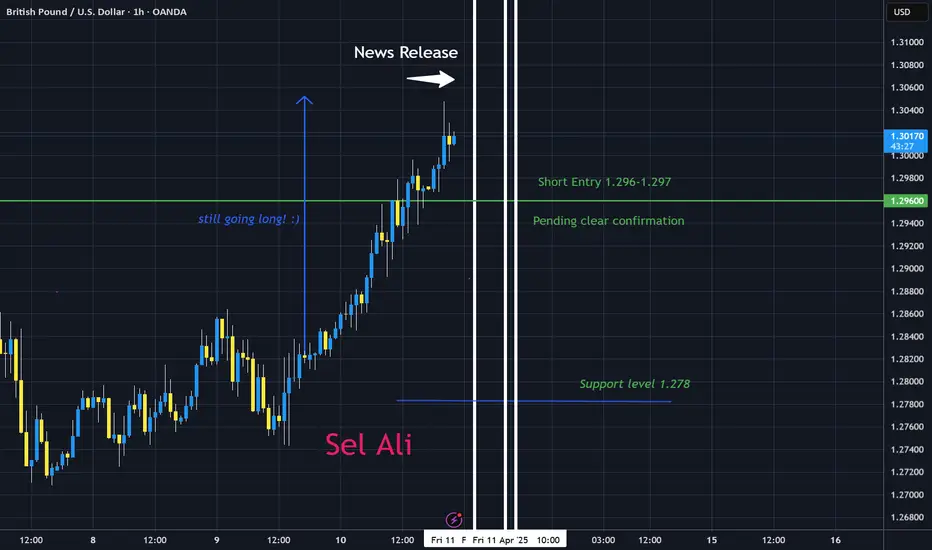
GBPUSD analysis as of 4/10 3:19pm Mind you, i still have a bullish trade going from my previous long trade.. I removed my take profit yesterday and im continuing to monitor the market. but as for now these are the numbers we are looking at.
The market has really overextended itself—prices are at levels that feel too high compared to the earlier consolidation. On the 1‑hour, 4‑hour, and daily charts, I’m spotting clear bearish signals (like the bearish bet-hold patterns, closing marubozu, bearish engulfing, and even hikkake formations) that suggest sellers might soon step in. Even though the higher timeframes still hold an overall bullish bias, these short-term resistance patterns are warning me that the rally may be topping out.
Given this, my plan is to close out my bullish trade as soon as I get confirmation of a reversal. I’m watching for a clear candlestick signal—a bearish engulfing pattern, a pin bar, or any strong rejection on the lower timeframe (say the 15‑minute or even a confirming close on the 1‑hour) around the 1.293–1.290 area. Once I see that confirmation, I’ll lock in my profits from the bullish trade and then pivot to a sell. I’d target my short entry near that level, with a stop-loss just above recent highs (around 1.296–1.297), aiming for a retracement toward the previous support zone (around 1.278–1.281).
In short: I’ll close my bullish position when the price clearly shows it’s reversing from these overextended, overbought highs, and then I’ll open a sell trade to take advantage of the expected short-term pullback. This approach lets me protect my gains and capitalize on the bearish signals emerging from the chart.

Bearish reversal?GBP/USD is risng towards the resistance level which is a pullback resistance that aligns with the 61.8% Fibonacci retracement and could reverse from this level to our take profit.
Entry: 1.3009
Why we like it:
There is a pullback resistance level that lines up with the 61.8% Fibonacci retracement.
Stop loss: 1.3106
Why we like it:
There is a pullback resistance level that lines up with the 78.6% Fibonacci retracement.
Take profit: 1.2875
Why we like it:
There is an overlap support level.
Enjoying your TradingView experience? Review us!
Please be advised that the information presented on TradingView is provided to Vantage (‘Vantage Global Limited’, ‘we’) by a third-party provider (‘Everest Fortune Group’). Please be reminded that you are solely responsible for the trading decisions on your account. There is a very high degree of risk involved in trading. Any information and/or content is intended entirely for research, educational and informational purposes only and does not constitute investment or consultation advice or investment strategy. The information is not tailored to the investment needs of any specific person and therefore does not involve a consideration of any of the investment objectives, financial situation or needs of any viewer that may receive it. Kindly also note that past performance is not a reliable indicator of future results. Actual results may differ materially from those anticipated in forward-looking or past performance statements. We assume no liability as to the accuracy or completeness of any of the information and/or content provided herein and the Company cannot be held responsible for any omission, mistake nor for any loss or damage including without limitation to any loss of profit which may arise from reliance on any information supplied by Everest Fortune Group.

Analysis of the Trend of the GBPUSDThe GBPUSD is currently showing a gradually rising trend. An important support level is 1.28850, which is the lower boundary of the current range. Once it is broken below, it may suggest a reversal of the trend to a bearish one. Before that, we should still mainly choose to go long and use short selling as a supplement.
GBPUSD trading strategy
buy @:1.29200-1.29300
sl 1.28850
tp 1.29750-1.29850
If you approve of my analysis, you can give it a thumbs-up as support. If you have different opinions, you can leave your thoughts in the comments.Thank you!

GBP/USD Breakdown Incoming? Bearish Setup Unfolding!Hi traders! Analyzing GBP/USD on the 1H timeframe, spotting a potential rejection at the descending trendline:
🔹 Entry: 1.29660
🔹 TP: 1.28652
🔹 SL: 1.30650
Price is reacting to the descending trendline after testing a key resistance zone. This level has acted as dynamic resistance in the past, and price shows signs of rejection.
The RSI is in the overbought area, suggesting a possible pullback. If the bearish momentum confirms, we could see a clean move back down to the previous support levels.
⚠️ DISCLAIMER: This is not financial advice. Every trader must evaluate their own risk and strategy.

GBP/USD Bullish Breakout Setup – Entry, Target & Stop Loss AnalyEMA 200 (blue line): 1.28423 – typically used to define long-term trend direction.
EMA 30 (red line): 1.28253 – shorter-term trend indication.
Currently, the price is above the 30 EMA and slightly above the 200 EMA, suggesting short-term bullish momentum with potential for trend reversal or continuation.
🟪 Key Zones and Levels:
Entry Point Zone: Around 1.28242–1.28423 (highlighted in purple).
Stop Loss: Set slightly below the purple demand zone at 1.27931.
Target (EA TARGET POINT): Marked around 1.29809.
🧠 Trade Setup Summary:
Risk/Reward: Good – aiming for a ~1.19% gain (~152.5 pips), with a relatively tight stop loss.
Structure:
The price has broken above a consolidation range (demand zone) and retested the zone (potential bullish retest).
EMA crossover could soon occur if the 30 EMA crosses above the 200 EMA, confirming bullish sentiment.
✅ Bullish Confirmation Signs:
Higher lows forming.
Break and retest of previous resistance (now support).
EMA proximity breakout is occurring.
Strong bullish candles near the entry level.
⚠️ Things to Watch:
If price closes strongly above 1.2860–1.2870, that could signal momentum continuation.
Failing to hold 1.2824–1.2800 might invalidate the setup and trigger the stop loss.
Watch for fundamental events (economic news, especially from UK/US) that could cause sudden volatility.

CHECK GBPUSD ANALYSIS SIGNAL UPDATE > GO AND READ THE CAPTAINEntry Zone: Around 1.29400
Stop Loss: 1.29700
Take Profit 1: Approximately 1.29000
Take Profit 2: Approximately 1.28500
Last Target: 1.28400
TECHNIAL ANALYSIS SATUP ✅
FALLOW RISK MANAGEMENT ✅

GBPUSD guess on the next couple hours.. Sorry I cant draw for shit. but this is my educated guess lol

GBP/USD "The Cable" Forex Bank Heist Plan (Swing / Day Trade)🌟Hi! Hola! Ola! Bonjour! Hallo! Marhaba!🌟
Dear Money Makers & Robbers, 🤑 💰💸✈️
Based on 🔥Thief Trading style technical and fundamental analysis🔥, here is our master plan to heist the GBP/USD "The Cable" Forex Market. Please adhere to the strategy I've outlined in the chart, which emphasizes long entry. Our aim is the high-risk Red Zone. Risky level, overbought market, consolidation, trend reversal, trap at the level where traders and bearish robbers are stronger. 🏆💸"Take profit and treat yourself, traders. You deserve it!💪🏆🎉
Entry 📈 : "The heist is on! Wait for the MA breakout (1.30500) then make your move - Bullish profits await!"
however I advise to Place Buy stop orders above the Moving average (or) Place buy limit orders within a 15 or 30 minute timeframe most recent or swing, low or high level.
📌I strongly advise you to set an "alert (Alarm)" on your chart so you can see when the breakout entry occurs.
Stop Loss 🛑: "🔊 Yo, listen up! 🗣️ If you're lookin' to get in on a buy stop order, don't even think about settin' that stop loss till after the breakout 🚀. You feel me? Now, if you're smart, you'll place that stop loss where I told you to 📍, but if you're a rebel, you can put it wherever you like 🤪 - just don't say I didn't warn you ⚠️. You're playin' with fire 🔥, and it's your risk, not mine 👊."
📍 Thief SL placed at the recent/swing low level Using the 4H timeframe (1.27000) Swing/Day trade basis.
📍 SL is based on your risk of the trade, lot size and how many multiple orders you have to take.
🏴☠️Target 🎯: 1.35000 (or) Escape Before the Target
🧲Scalpers, take note 👀 : only scalp on the Long side. If you have a lot of money, you can go straight away; if not, you can join swing traders and carry out the robbery plan. Use trailing SL to safeguard your money 💰.
💰💵💸GBP/USD "The Cable" Forex Market Heist Plan (Swing/Day) is currently experiencing a bullishness,., driven by several key factors. 👇👇👇
📰🗞️Get & Read the Fundamental, Macro, COT Report, Quantitative Analysis, Sentimental Outlook, Intermarket Analysis, Future trend targets... go ahead to check 👉👉👉🔗🔗
⚠️Trading Alert : News Releases and Position Management 📰 🗞️ 🚫🚏
As a reminder, news releases can have a significant impact on market prices and volatility. To minimize potential losses and protect your running positions,
we recommend the following:
Avoid taking new trades during news releases
Use trailing stop-loss orders to protect your running positions and lock in profits
💖Supporting our robbery plan 💥Hit the Boost Button💥 will enable us to effortlessly make and steal money 💰💵. Boost the strength of our robbery team. Every day in this market make money with ease by using the Thief Trading Style.🏆💪🤝❤️🎉🚀
I'll see you soon with another heist plan, so stay tuned 🤑🐱👤🤗🤩

GBPUSD TRADE SETUPPotential Trade Setup on GBPUSD
The price has successfully retested a very strong support after the 3-week rally it exhibited in March.
However there has been little to no pullback after the rally, and currently, it is firing a possible divergence at 1.2970
The price is developing, and I am waiting for a break below the support area at 1.2960 to take a possible short-term sell trade.
A BUY opportunity is at the bottom of the 50% fib at 1.2700.
You may find more details in the chart!
Thank you and Trade Responsibly!
❤️PS: Please support with a like or comment if you find this analysis useful for your trading

Gbpusd signal buy GBP/USD tested higher on Wednesday, climbing back over the 1.2800 handle after broad-market sentiment recovered across the board. The Trump administration has once again pivoted away from its own “no exceptions, no delays” tariff policy, and has again delayed tariffs, this time for 90 days.
The Relative Strength Index (RSI) indicator on the 4-hour chart stays below 50 despite the latest rebound, suggesting that buyers remain reluctant to commit to a steady recovery in Pound Sterling.
Gbpusd signal buy

I've been tracking the GBPUSD, and here's where I stand 12:10pmCurrent Price & Overextension: The price is currently at 1.29380, which is still well above the recent consolidation range of 1.281–1.285. This tells me the market remains overextended, suggesting that the strong rally may be due for a pullback.
Technical Snapshot: On the 1‑hour chart, my moving averages—such as the EMA, DEMA, and KAMA—are aligned near the price, confirming that the broader uptrend is intact. However, oscillators like the RSI, which is around 75, and the StochRSI sitting at 100, indicate that the market is extremely overbought. These overbought conditions make me anticipate a short‑term reversal.
Directional & Volatility Factors: The directional indicators still point to bullish momentum (with the PLUS_DI notably higher than the MINUS_DI), but the recent surge seems impulsive when I compare the price to the established support zone. With an ATR around 0.00538, I see that the price has moved significantly for the range, suggesting that a retracement is likely.
My Trade Setup: Given this setup, I’m watching for clear rejection signals—like a bearish engulfing pattern or a firm pin bar—around the upper levels of the range, roughly between 1.292 and 1.290. If I see these reversal signals, I'll plan to enter a short position with a tight stop just above recent highs (around 1.296–1.297). My profit target would be set toward the consolidation zone around 1.278–1.281, which offers me a favorable risk/reward ratio.
Fundamental Backdrop: Recent fundamental news, particularly the conflicting tariff policies, has spurred significant volatility. This volatility, combined with the technical overextension, reinforces my expectation that the current upward move is unsustainable in the short term.
In short, even though the overall trend remains bullish, the pair's current overbought condition and extreme price levels signal an impending short-term pullback. I'm getting ready to take advantage of that temporary reversal with careful, tight risk management.
