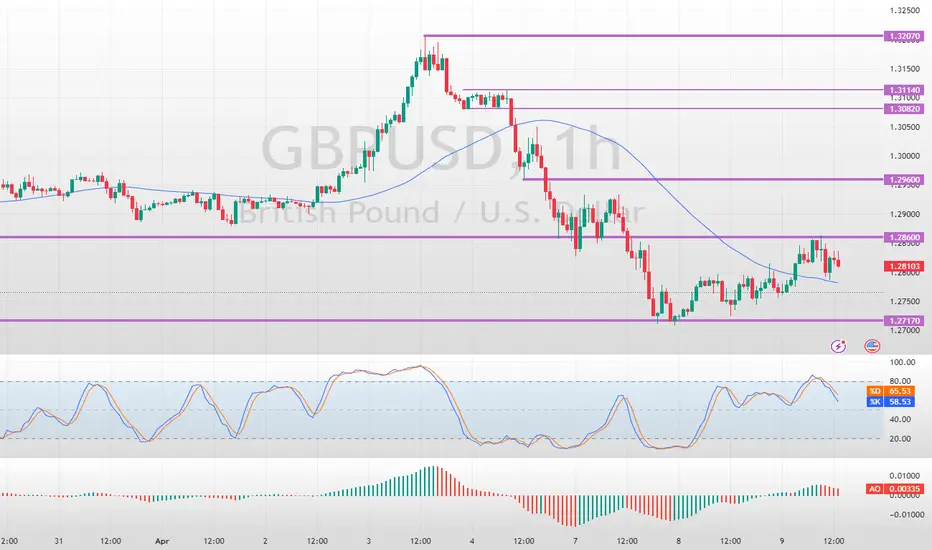
GBPUSD Made New Higher Highs amid Sell-offFenzoFx—GBP/USD trades bearish but is forming new higher highs with immediate resistance at $1.286. The next bullish target could be $1.2960 if bulls close and stabilize above this level.
Conversely, the bullish outlook should be invalidated if GBP/USD falls below $1.2717. If this scenario unfolds, the pound could fall toward the next support level at $1.2563.
GBPUSD.P trade ideas
The Day Ahead Wednesday, April 9 – Market Highlights
Economic Data:
US February Wholesale Trade Sales – Insight into inventory and business spending; may impact GDP outlook.
Japan March Consumer Confidence – Indicator of consumer sentiment; could influence JPY and equities.
Japan Machine Tool Orders – Key for industrial activity; relevant for JPY and manufacturing stocks.
Central Banks:
FOMC Meeting Minutes – Closely watched for clues on Fed’s rate path; could move Treasuries, USD, and equities.
Fed’s Barkin Speaks – May offer fresh policy signals.
BoJ Governor Ueda Speaks – Comments could affect JPY and Japanese bonds.
ECB’s Knot and Cipollone Speak – Potential impact on EUR if policy views are signaled.
RBNZ Rate Decision – Markets expect a hold; tone of statement may move NZD.
Earnings:
Seven & i Holdings – Insight into Japanese retail and consumer spending.
Delta Air Lines – Early look at travel demand and input costs; relevant for transport and consumer sectors.
Constellation Brands – Watch for trends in consumer demand and margins.
Auctions:
US 10-Year Note Auction – Key for rate sentiment; demand could impact yields and broader market tone.
This communication is for informational purposes only and should not be viewed as any form of recommendation as to a particular course of action or as investment advice. It is not intended as an offer or solicitation for the purchase or sale of any financial instrument or as an official confirmation of any transaction. Opinions, estimates and assumptions expressed herein are made as of the date of this communication and are subject to change without notice. This communication has been prepared based upon information, including market prices, data and other information, believed to be reliable; however, Trade Nation does not warrant its completeness or accuracy. All market prices and market data contained in or attached to this communication are indicative and subject to change without notice.

Sterling Remains Firm Despite Inflationary PressuresGBP/USD traded around 1.2830 on Wednesday, holding gains from the previous session. However, ongoing global trade tensions and fears of goods dumping from China and Europe weighed on sentiment. Though U.S. tariffs are relatively lower on the UK, broader economic concerns persist. At the same time, rising inflation risks may lower expectations for rate cuts, providing some support to the pound.
If GBP/USD breaks above 1.2850, resistance levels are at 1.2900 and 1.2940. Support is at 1.2715, followed by 1.2650 and 1.2600.

THOUGHTS ON THE GBP/USDGBP/USD 1H - As you can see I have gone ahead and marked out some areas of interest I would like to see price come and clear before a further down move. Once price trades us up and into one of two areas we can begin looking to go short.
It is important we are patient and allow price to play out as we want and need it to before we look to take part, allowing price to trade us into said zones, gives us the opportunity to get involved in this market with a more refined entry.
We could look to take part in some temporary long positions whilst we prepare to take part in shorts, whilst this is trading against the prevailing trend it is following the current corrective wave.
So buying in would hold some risk just as price could realistically flip to the downside at any point should enough supply be introduced into the market.

Swing Trading: Unique Features and StrategiesSwing Trading: Unique Features and Strategies
Swing trading stands out as a dynamic approach in the trading world, blending elements of both short-term and long-term strategies. In this article, we will explore the unique features of swing trading, including its reliance on technical analysis, the use of chart patterns, and the strategic timing of entries and exits. Whether you're new to trading or seeking to refine your approach, understanding the nuances of swing trading can provide valuable insights into navigating the financial markets.
The Basics of Swing Trading
Swing trading meaning refers to a style that involves holding short- and medium-term positions - usually from a couple of days to a few weeks - with the aim of capitalising on the “swings” in the market.
What is a swing trader? A swing trader’s definition is simple: swing traders are those who typically enter and exit markets at significant support and resistance levels, hoping to capture the bulk of expected moves.
These traders tend to look at hourly to weekly charts to guide their entries, although the timeframe used will depend on the swing trader’s individual approach and the asset being traded. Swing trading can be used across all asset classes, from stocks and forex to cryptocurrencies* and commodities. In the stock market, swing trading can be especially effective, as stocks tend to experience high volatility and are subject to frequent news and events that can drive prices.
Swing traders predominantly use technical analysis to determine their entries and exits, but fundamental analysis, like comparing the interest rates of two economies, can also play a significant role. It can help determine a price direction over the course of days or weeks.
Swing Trading vs Other Styles
To better understand the unique features of swing trading, let’s compare it with our styles.
Position trading involves holding trades for weeks and months, focusing on capturing long-term trends. Position traders are less concerned with short-term fluctuations and are more likely to use fundamental analysis, such as economic data and company earnings, to make their decisions. This style requires patience and a long-term perspective, with fewer trades but potentially larger returns per trade.
Swing trading involves holding trades for several days to a few weeks, aiming to capture short- and medium-term price movements within a larger trend. This style balances the need for active market participation with the flexibility to not monitor trades constantly. Swing traders primarily rely on technical analysis to identify entry and exit points, focusing on chart patterns and indicators.
Day trading requires traders to buy and sell assets within the same trading day, often holding positions for just minutes or hours. The goal is to capitalise on intraday price movements, and traders close all positions before the market closes to avoid overnight risk. This style demands constant market monitoring and quick decision-making, with a strong reliance on real-time technical analysis.
Scalping is an ultra-short-term trading style where positions are held for seconds to minutes, aiming to make small profits on numerous trades throughout the day. Scalpers rely almost entirely on technical analysis and need to act quickly, often executing dozens or hundreds of trades daily. The focus is on high-frequency trading with very tight stop-losses, requiring intense concentration.
Swing Trading: Benefits and Challenges
Although swing trading provides numerous opportunities which makes it popular among traders, it comes with a few challenges traders should be aware of.
Benefits:
- Lower Time Commitment. One of the most significant benefits for swing traders is the reduced time commitment. This style can be adapted to suit a trader’s individual schedule.
- Flexibility. It is often more flexible than other styles. Not only does it offer time flexibility, but it allows for a wider range of tools to be used to determine price swings. Also, it can be applied to many assets. The most common is swing trading in forex and swing trading in stocks.
- Technical Analysis Focus: Utilises technical indicators and chart patterns to identify entry and exit points, providing clear criteria for decision-making.
- More Opportunities Compared to Long-Term Techniques. Because swing traders usually hold positions for a few days to a few weeks, they have the ability to take advantage of shorter-term market movements that might not be reflected in longer-term price trends.
Challenges:
- Exposure to Overnight Risk. Positions held overnight or over weekends can be affected by unexpected news or events, leading to potential gaps or adverse price movements.
- Requires Patience: Effective swing trading requires waiting for trades to develop over days or weeks, which may test a trader's patience.
- Market Volatility: Performance can be impacted by periods of low volatility or choppy markets, where price movements may not align with your expectations.
Popular Tools to Use When Swing Trading
The effectiveness of a swing traders’ strategies will ultimately depend on their ability to correctly identify price movements. For this, traders use different chart patterns and technical indicators. Here are three common tools that can be used as part of a swing trading strategy.
Channels
Traders can use channels to take advantage of well-identified price trends that play out over days and weeks. To plot a channel, you first need to identify a trending asset that’s moving in a relative zig-zag pattern rather than one with large jumps in price. Traders will often use the channel to open a swing trade in the direction of the trend; in the example above, they might look to buy when the price tests the lower line and take profit when the price touches the upper line of the channel.
Moving Averages
Moving averages (MAs) are one of the commonly used indicators and they can help swing traders determine the direction of the trend at a glance. The options here are endless:
- You could pair fast and slow moving averages and wait for the two to cross; this is known as a moving average crossover. When a shorter MA crosses above a longer one, the price is expected to rise. Conversely, when a shorter MA breaks below a longer one, the price is supposed to decline.
- You could stick with one and observe whether the price is above or below its average to gauge the trend. When the price is above the MA, it’s an uptrend; when it’s below the MA, it’s a downtrend.
- You could use an MA as a support or resistance level, placing a buy order when the price falls to the MA in an uptrend and a sell order when it rises to the MA in a downtrend.
Fibonacci Retracements
Lastly, many swing traders look to enter pullbacks in a larger trend. One of the most popular ways to identify entry levels during these pullbacks is the Fibonacci Retracement tool. Traders typically wait for a shift in price direction, then apply the tool to a swing high and swing low. Then, they enter at a pullback, usually to the 0.5 or 0.618 levels, to take advantage of the continuation of the trend. As seen above, this strategy can offer entry points for those looking to get in early before a trend continues.
The Bottom Line
Swing trading stands out for its ability to balance the demands of active trading with the flexibility of longer-term investing. The unique features of swing trading, such as its moderate holding periods and strategic use of technical indicators, allow traders to potentially manage risk and adapt to various market conditions. Embracing swing trading strategies can help traders refine their approach. As with any trading style, continued learning and disciplined execution are key to achieving consistent results.
FAQ
What Is Swing Trading?
Swing trading is a style that involves holding positions over a period of several days to weeks to take advantage of price movements within a trend. Swing traders use technical analysis, including chart patterns and indicators, to identify potential entry and exit points, balancing the need for active participation with a longer-term perspective.
What Is Swing Trading vs Day Trading?
Swing trading and day trading are distinct methods. The former focuses on capturing price movements over several days to weeks, allowing for less frequent trading and requiring less constant market monitoring. In contrast, the latter involves buying and selling assets within the same trading day, often holding positions for minutes or hours, and requires continuous market observation and quick decision-making.
What Is the Downside of Swing Trading?
The downsides of swing trading include exposure to overnight and weekend risks, as positions held outside market hours can be affected by unexpected news or events. Additionally, this method requires patience and discipline, as trades may take time to develop, and performance can be impacted by periods of low volatility or choppy markets.
*Important: At FXOpen UK, Cryptocurrency trading via CFDs is only available to our Professional clients. They are not available for trading by Retail clients. To find out more information about how this may affect you, please get in touch with our team.
This article represents the opinion of the Companies operating under the FXOpen brand only. It is not to be construed as an offer, solicitation, or recommendation with respect to products and services provided by the Companies operating under the FXOpen brand, nor is it to be considered financial advice.

GBPUSD BUY NOW!!!!!!!GBPUSD formed a falling wedge breakouts and price made a strong liquidity sweep off the sell side liquidity am in on a buy holding till i see price create new highs 1.3200 is my goal target

check the trendConsidering the price behavior in the current support range, possible scenarios have been identified. It is expected that the downward trend will continue.

GBP/USD 4H CHART PATTERNGet ready, traders—the bulls are losing control, and the bears are waking up!
We just witnessed a major break from a long-standing ascending channel, and the momentum is screaming downside potential.
What’s happening?
Price broke below the rising channel with strong bearish momentum and high volume—a textbook move signaling a trend shift!
Next key levels to watch:
Support Zone 1: 1.25756 – Previous demand area and a magnet for price action
Support Zone 2: 1.22672 – Stronger, historical support; if we get here, it’s game on for the bears!
What to expect next?
Watch out for a potential pullback/retest around the 1.2850–1.2900 zone before a deeper dive. If the retest holds, we could be looking at a clean ride down to the support levels.
Volume spike = confirmation. This isn’t just a dip; this is a possible trend shift.
Bearish Setup:
Entry: On pullback or continued breakdown
TP1: 1.25000
TP2: 1.22000

GBPUSD(Change of Trend)You can follow us for more Analysis(Images and Videos) with Precise definition of the Financial Market.

GU-Wed-9/04/25 Top down analysis-FOMC minutes, be careful!!Analysis done directly on the chart
Wonder why price action sometimes
are bad and not as smooth as it should be?
Because they might be already priced in for
big red folder news or events. (including
FOMC, NFP, interest rate decisions, important
speeches and many more).
Not financial advice, DYOR.
Market Flow Strategy
Mister Y

GBP/USD sell H4 chart analysisThat’s a very well-structured breakdown— short setup on GBP/USD from 1.28000 down to 1.25500 and 1.22700 looks well thought out, especially in the context of a bearish trend.
Here’s a concise technical reinforcement and a couple of things to tighten your plan:
---
Trade Overview
Pair: GBP/USD
Position: Short
Entry: 1.28000
TP1: 1.25500
TP2: 1.22700
Suggested SL: 1.28650–1.29000 (above recent swing high or resistance zone)
---
Technical Breakdown
1. Price Action & Structure:
1.25500 has been a strong pivot zone historically—if it breaks cleanly, it could accelerate toward 1.22700.
Look for signs of lower highs and lower lows on the H4 and Daily charts for continuation.
2. Moving Averages:
A confirmed 50/200 MA death cross on H4 or Daily would give a strong bearish confirmation.
Price staying below the 50 EMA also supports short bias.
3. RSI / Momentum:
RSI < 50 = bearish.
RSI near 30: caution for potential short-term bounces. Look for divergence as a clue for exhaustion.
---
Key Events to Watch
UK Data: Watch for GDP, Services PMI, and BoE tone. Dovish BoE could accelerate the drop.
US Data: Strong NFP or CPI could boost USD strength and help push toward your TPs.
---
Bonus Tip – Scaling:
Consider partial profit at TP1 and adjust stop to breakeven for TP2.
Or use a trailing stop once TP1 hits to lock in profits if the move accelerates.

GBPUSD SELL 1.2908On the hourly chart, GBPUSD stabilized in the short term. Currently, we can pay attention to the upper 1.2908 area, which is a potential short position of the bearish bat pattern. At the same time, this position is in the previous supply area. If shorting near 1.2908, the downward target will look at the 1.2750-1.2800 area.

Seller has coming to GBPUSDThe daily timeframe already shows signs of sellers entering the market. On the 1-hour timeframe, the low is already sweep, indicating a potential trend change on the 1-hour timeframe. To follow the trend, the entry area is located in the supply zone on the 15-minute and 30-minute timeframes.

GBPUSD 4/9/2025BUllish for GU. Expecting price to come back to POi and continue up. Last long target is 1.2936. Using 15 min OB for entry

GBPUSD Breaks Key Support: Trump's Tariffs Trigger a Bigger DropGBPUSD Breaks Key Support: Trump's Tariffs Trigger a Bigger Drop
Since early March 2025, GBP/USD entered an accumulation phase, trading within a 145-pip range between 1.2870 and 1.3015. The first breakout attempt was bullish, but on April 3rd, a sharp sell-off occurred, triggered by Trump’s newly imposed tariffs.
GBP/USD has now broken below the 1.2870 support zone, a level where the price had held firm for a month. If the pair remains below 1.2870, the likelihood of a larger downward move increases.
Based on current data, GBP/USD might retest 1.2870 before continuing downward, but this is uncertain. The pair’s movement is highly dependent on Trump's tariffs, and any new statements or policy shifts could quickly change its direction
You may find more details in the chart!
Thank you and Good Luck!
❤️PS: Please support with a like or comment if you find this analysis useful for your trading day❤️
Disclosure: I am part of Trade Nation's Influencer program and receive a monthly fee for using their TradingView charts in my analysis.

GBPUSD(20250409)Today's AnalysisMarket news:
The U.S. Customs and Border Protection Agency reiterated that the specific tax rates for each country will be announced at 12:01 a.m. on April 9.
Technical analysis:
Today's buying and selling boundaries:
1.2764
Support and resistance levels:
1.2862
1.2825
1.2802
1.2726
1.2702
1.2666
Trading strategy:
If the price breaks through 1.2802, consider buying, the first target price is 1.2825
If the price breaks through 1.2764, consider selling, the first target price is 1.2726

GBPUSDopen trade
although trend is super bearish on 1d but
1- 4h mulitple fractals indicate retracement
2- above marked liq zone is nice level for target

GBPUSD I may have entered too early.. But im not backing out yet!
Observations from the Data
Trend Confirmation via Moving Averages: Several key moving averages and trend indicators (EMA at 1.30829, DEMA, HT Trendline at 1.31043, KAMA, Linear Regression) are positioned well above the current market level of 1.28234. This indicates that, on an hourly basis, the longer-term trend remains bearish.
Directional Indicators: The directional movement figures are very telling. With PLUS_DI at about 4.97 and MINUS_DI at around 31.38, sellers clearly dominate the market. A low DI(+) against a high DI(–) reinforces that the overall bias is to the downside.
Momentum & Oscillators:
The RSI is extremely low at ~15, indicating an oversold condition. In isolation, this might hint at a potential short-term bounce.
However, other momentum indicators, such as the Chande Momentum Oscillator (-70.09) and a slightly negative MACD (-0.00185), suggest that the underlying bearish momentum has been strong.
Oscillators like Williams %R (at -89.21) further underscore that the market is deep into oversold territory.
Volatility Metrics: An ATR of 0.0043 and relatively low standard deviation indicate modest volatility, meaning your stop-loss and target levels can be measured with reasonable precision.
Context and Rationale
Overall Trend: The majority of your trend-following indicators (e.g., EMA, DEMA, HT Trendline, KAMA) are positioned higher, confirming a prevailing bearish bias. Even though the RSI shows an extreme oversold reading (around 15), in a strong downtrend like this, oversold conditions can simply trigger a temporary bounce rather than a reversal. My sell entry at 1.27752 aligns with staying in the trend.
Directional Pressure: With the MINUS_DI (31.38) greatly outweighing the PLUS_DI (4.97), the directional movement clearly favors sellers. My entry at 1.27752 positions me within this selling pressure, assuming the bounce to fail and the downtrend to resume.
Entry Timing: Instead of waiting for a higher bounce ideal for a pullback short, my entry at 1.27752 suggests that I chose to capture a move early in the downswing or perhaps because price action broke a key support level. This could be advantageous if momentum continues as anticipated.
Why This Trade Setup Works
Alignment with Trend: Maintaining a sell position aligns with the overall bearish structure indicated by your moving averages and directional indicators.
Captchaing a Bounce Rejection: Even if a short-term bounce occurs from oversold conditions, your entry near 1.27752 could capture the early phase of a bearish continuation provided that the rally fails to sustain.
Confluence of Technical Signals: The combination of oversold conditions (which in a downtrend often predict a short-lived bounce) and the strong directional indication from MINUS_DI and related momentum oscillators creates a setup where a rejection of a minor recovery can lead to further downside moves.

GBPUSD H1 | Bullish Bounce OffBased on the H1 chart analysis, the price is falling toward our buy entry level at 1.2790, a pullback support.
Our take profit is set at 1.2924, an overlap resistance.
The stop loss is placed at 1.2707, a swing low support.
High Risk Investment Warning
Trading Forex/CFDs on margin carries a high level of risk and may not be suitable for all investors. Leverage can work against you.
Stratos Markets Limited (tradu.com):
CFDs are complex instruments and come with a high risk of losing money rapidly due to leverage. 63% of retail investor accounts lose money when trading CFDs with this provider. You should consider whether you understand how CFDs work and whether you can afford to take the high risk of losing your money.
Stratos Europe Ltd (tradu.com):
CFDs are complex instruments and come with a high risk of losing money rapidly due to leverage. 63% of retail investor accounts lose money when trading CFDs with this provider. You should consider whether you understand how CFDs work and whether you can afford to take the high risk of losing your money.
Stratos Global LLC (tradu.com):
Losses can exceed deposits.
Please be advised that the information presented on TradingView is provided to Tradu (‘Company’, ‘we’) by a third-party provider (‘TFA Global Pte Ltd’). Please be reminded that you are solely responsible for the trading decisions on your account. There is a very high degree of risk involved in trading. Any information and/or content is intended entirely for research, educational and informational purposes only and does not constitute investment or consultation advice or investment strategy. The information is not tailored to the investment needs of any specific person and therefore does not involve a consideration of any of the investment objectives, financial situation or needs of any viewer that may receive it. Kindly also note that past performance is not a reliable indicator of future results. Actual results may differ materially from those anticipated in forward-looking or past performance statements. We assume no liability as to the accuracy or completeness of any of the information and/or content provided herein and the Company cannot be held responsible for any omission, mistake nor for any loss or damage including without limitation to any loss of profit which may arise from reliance on any information supplied by TFA Global Pte Ltd.
The speaker(s) is neither an employee, agent nor representative of Tradu and is therefore acting independently. The opinions given are their own, constitute general market commentary, and do not constitute the opinion or advice of Tradu or any form of personal or investment advice. Tradu neither endorses nor guarantees offerings of third-party speakers, nor is Tradu responsible for the content, veracity or opinions of third-party speakers, presenters or participants.

Bearish reversal off pullback resistance?The Cable (GBP/USD) is rising towards the pivot which lines up with the 38.2% Fibonacci retracement and could reverse to the 1st support which has been identified as a pullback support.
Pivot: 1.2890
1st Support: 1.2693
1st Resistance: 1.3006
Risk Warning:
Trading Forex and CFDs carries a high level of risk to your capital and you should only trade with money you can afford to lose. Trading Forex and CFDs may not be suitable for all investors, so please ensure that you fully understand the risks involved and seek independent advice if necessary.
Disclaimer:
The above opinions given constitute general market commentary, and do not constitute the opinion or advice of IC Markets or any form of personal or investment advice.
Any opinions, news, research, analyses, prices, other information, or links to third-party sites contained on this website are provided on an "as-is" basis, are intended only to be informative, is not an advice nor a recommendation, nor research, or a record of our trading prices, or an offer of, or solicitation for a transaction in any financial instrument and thus should not be treated as such. The information provided does not involve any specific investment objectives, financial situation and needs of any specific person who may receive it. Please be aware, that past performance is not a reliable indicator of future performance and/or results. Past Performance or Forward-looking scenarios based upon the reasonable beliefs of the third-party provider are not a guarantee of future performance. Actual results may differ materially from those anticipated in forward-looking or past performance statements. IC Markets makes no representation or warranty and assumes no liability as to the accuracy or completeness of the information provided, nor any loss arising from any investment based on a recommendation, forecast or any information supplied by any third-party.

GBP USD LONG SETUPBritish Pound has been in a strong downtrend channel, broke out and moving in an ascending Trendline structure to the upside, so we'll see how market plays out

Explosive Breakout Setting Up on GBP/USD – Here's the Roadmap🔥 GBP/USD Technical Analysis – 4H Timeframe | Market Poised for Breakout or Breakdown?
Key Support: 1.26888
Key Resistance: 1.28829
Market Structure: Consolidation with bullish undertones
Bias: Neutral-to-bullish (pending confirmation)
🧠 Market Overview:
The GBP/USD pair is currently consolidating within a well-defined horizontal channel on the 4-hour chart, oscillating between 1.26888 (major support) and 1.28829 (key resistance). This prolonged range-bound behavior reflects a market in balance, where buyers and sellers are cautiously awaiting a catalyst to drive the next impulsive move.
The price action suggests that this consolidation phase may be coming to an end soon. A breakout or breakdown from this tight range is likely to set the tone for the next major trend. Market participants should be alert to early breakout signals and volume surges as confirmation triggers.
📊 Price Structure and Key Observations:
The market has printed a series of higher lows within the consolidation range, indicating a subtle bullish pressure beneath the surface.
Price is hovering near the mid-range zone, consolidating after multiple failed breakout attempts at 1.28829.
A squeeze in volatility is evident from narrowing candlesticks and declining ATR, often preceding explosive directional moves.
🔍 Technical Indicators Breakdown:
✅ RSI (14):
Currently trading around the neutral zone at 50, showing no clear directional bias. However, higher lows on RSI suggest potential bullish divergence forming, which could be an early signal of upward momentum building up.
✅ MACD:
A recent bullish crossover below the zero line indicates potential for a shift in momentum. Histogram bars are starting to turn positive, supporting a near-term bullish scenario if price confirms with a breakout.
✅ Moving Averages:
Price is trading above the 50-period SMA, which has acted as dynamic support on several occasions.
The 200-period SMA remains below current price levels, indicating a medium-term bullish structure remains intact unless support is broken decisively.
🔮 Potential Scenarios:
✅ Bullish Breakout Scenario:
If price breaks and closes above 1.28829 on strong bullish volume, it would represent a major breakout from the current range. This could open the door for a new impulsive leg to the upside.
Upside Targets:
🎯 1.29650 – Short-term resistance level from previous highs
🎯 1.30300 – Psychological round number and previous supply zone
🎯 1.31000 – Extended target aligned with Fibonacci 1.618 projection
Confirmation Factors:
Break + retest of 1.28829 as new support
RSI holding above 60
MACD expanding positively
❌ Bearish Rejection / Breakdown Scenario:
Should the pair fail to break above 1.28829 and print a strong bearish rejection candle (e.g., Shooting Star, Bearish Engulfing), the pair could retest the lower support of 1.26888.
A clean break below 1.26888 with a decisive bearish close could signal a trend reversal, shifting sentiment toward the downside.
Downside Targets:
📉 1.26000 – Near-term psychological support
📉 1.25200 – Previous demand area and key fib level (61.8%)
📉 1.24400 – Long-term trendline support (if applicable)
⚙️ Trade Strategy & Risk Management:
Breakout Traders: Wait for a confirmed candle close outside the range (either above 1.28829 or below 1.26888) before entering. Avoid false breakouts by validating with volume and momentum indicators.
Range Traders: Continue fading the range boundaries (buy near 1.26888, sell near 1.28829) while the channel remains intact. Use tight stop-losses just beyond the range to mitigate whipsaw risks.
Swing Traders: A successful breakout presents excellent risk-reward setups for multi-day trades, especially if accompanied by high volatility and news catalysts (e.g., NFP, BoE/Fed announcements).
🧭 Conclusion:
The GBP/USD pair is coiling tightly within a critical decision zone between 1.26888 and 1.28829. The tightening price structure, supportive indicators, and market indecision suggest that a major breakout is imminent.
Whether bulls take control or bears force a breakdown will largely depend on macroeconomic catalysts and institutional order flow. Traders are advised to stay patient, let the market reveal its hand, and execute only on high-probability setups with clear confirmations.
This is not the time to chase the market—this is the time to prepare for the move.
💬 Let me know in the comments how you're positioning yourself on GBP/USD this week!
🔔 Follow for more real-time setups, macro breakdowns, and professional market insights.
📈 Stay sharp, stay technical.
Would you like me to generate a matching TradingView chart snapshot with drawn zones and notes to go with this analysis for posting?

GBPUSD(Good Trade Again)You can follow us for more Analysis(Images and Videos) with Precise definition of the Financial Market.
