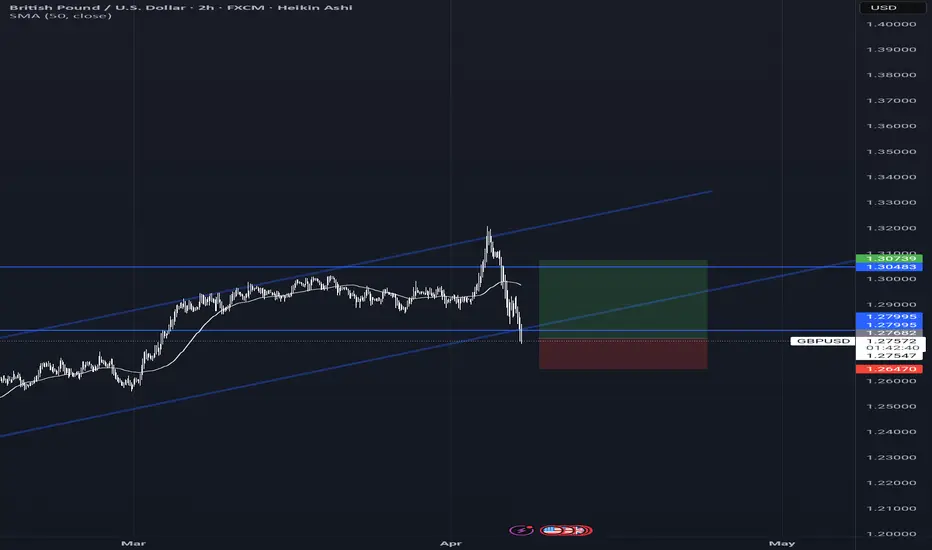
GBPUSD to recoverCCI convergence at the current levels.
I see 1.2715 holding the low and attempt to recover ground for a test higher at 1.2935 in the near-term
GBPUSD.P trade ideas

GBPUSD SHORTMarket structure bearish on HTFs 3
Entry at Daily AOi
Weekly Rejection At AOi
Weekly Previous Structure Point
Daily Rejection At AOi
Previous Structure point Daily
Around Psychological Level 1.29500
H4 EMA retest
H4 Candlestick rejection
Rejection from Previous structure
Levels 5.95
Entry 110%
REMEMBER : Trading is a Game Of Probability
: Manage Your Risk
: Be Patient
: Every Moment Is Unique
: Rinse, Wash, Repeat!
: Christ is King.

GBPUSD - ANALYSIS👀 Observation:
Hello, everyone! I hope you're doing well. I’d like to share my analysis of GBP-USD with you.
Looking at the GBP chart, I expect a slight price increase, possibly up to 1.29625. After reaching this level, I anticipate a price decline towards 1.27161.
📉 Expectation:
Bullish Scenario: A small increase to 1.29625.
Bearish Scenario: After reaching 1.29625, price declines towards 1.27161.
💡 Key Levels to Watch:
Support: 1.27161
Resistance: 1.29625
💬 What do you think about GBP-USD this week? Let me know in the comments!
Trade safe

GBPUSD BUY TRADE PLAN V2Last plan got invalidated before any sort of confirmation.
RE-ENTRY PLAN (Conditional Activation)
📅 Date: April 4, 2025
🔒 Format: Institutional Swing Reversal Blueprint
🔖 Plan Type: Re-Entry Plan (After SL Sweep Liquidity Trap)
📈 Bias & Trade Type: Bullish Reversal – Continuation From Liquidity Sweep Base
🔰 Confidence Level: ⭐⭐⭐⭐ (80%)
Reasons / Confluences: – Sweep of prior SL below 1.2915
– D1 bullish trend still intact (no CHoCH or HTF break)
– Deeper H4 OB + 61.8% retracement in play
– Wick rejection + potential inducement flush
– USD macro pressure remains post tariffs
📌 Status: 🔄 Pending Activation
📍 Entry Zones (Highlighted):
🟧 BUY Re-Entry Zone: 1.2880 – 1.2905
(Deeper liquidity pocket + H4 demand base + Fib confluence + final clean imbalance)
❗ Stop Loss:
🔻 1.2845
(Placed just below last structural OB & invalidation of bullish scenario)
🎯 Take Profits:
🎯 TP1: 1.2965
🎯 TP2: 1.3025
🎯 TP3: 1.3110
📏 Risk:Reward:
Approx. 1:2.5 – 1:3.8, depending on entry confirmation wick
🧠 Management Strategy:
• Risk only if H1 or M30 confirms (engulfing / strong pin bar / trap wick)
• SL to BE at TP1
• Trail remainder above TP2 or manually close if reaction is weak
• Exit fully if price fails to reclaim 1.2965 quickly after entry
⚠️ Confirmation Criteria:
• H1 bullish engulfing inside 1.2880–1.2905
• OR pin bar with strong volume wick rejection
• Volume divergence / spike from sweep lows
• Price reclaim of 1.2940 → added confirmation
⏳ Validity:
24–48 hrs only (structure-sensitive re-entry zone)
🌐 Fundamentals:
• GBP remains fundamentally strong
• USD remains vulnerable after macro trade war tensions
• No major high-impact GBP data for next session = clean entry window
📋 Final Summary:
This re-entry plan will be valid after price hit original SL (1.2915 - already done!), then tap into 1.2880–1.2905 zone and gives bullish confirmation.
We treat it as a liquidity sweep trap → smart money re-engagement opportunity.
No early entries. Confirmation is key.

GBP/USD Bearish Setup – FVG Retracement to Target Liquidity ZoneThis chart shows a bearish price setup for GBP/USD on the 1-hour timeframe, with smart money concepts, key EMAs, and a clear projection of price movement.
🔍 Technical Analysis Breakdown
1. Price Context
Current Price: 1.28987
Trend: Price has broken market structure to the downside, suggesting a potential shift from bullish to bearish.
Key Indicator Levels:
EMA 30 (Red): 1.29948 – now acting as dynamic resistance.
EMA 200 (Blue): 1.29760 – another strong resistance level just above.
📌 Key Zones Identified
🔵 Fair Value Gap (FVG) – Supply Zone
Location: Between ~1.29760 and 1.30172
Significance: This is a potential liquidity zone where institutions might offload positions.
Plan: Price is expected to retrace up into this FVG before continuing lower.
🔻 Target Zone – Demand Area
Location: Around 1.27396
Labeled: “target point EA”
Significance: This area is projected as the final bearish target, likely aligning with equal lows or liquidity zones.
CHoCH (Change of Character)
Visible at the structure break, confirming bearish intent and a shift in momentum.
🧠 Projected Price Action (In Blue Arrows)
A potential retracement to the FVG zone.
Rejection from this zone.
Continuation to the downside through intermediate pullbacks.
Final target at 1.27396.
🛠️ Trade Idea Summary
Sell Setup:
Entry Zone: 1.29760–1.30172 (FVG)
Target: 1.27396
Stop-Loss: Above 1.30172 (safely outside the FVG)
🧾 Conclusion
This setup aligns with smart money principles — a CHoCH followed by a retracement into an FVG, with downside continuation into a liquidity target zone. The EMAs support the bearish thesis, offering confluence for rejection.

Gu outlook Went as expected.
What a wonderful way to start the week
Also i offer signals at an affordable price.

GBPUSD Broke the channel support, Fake breakdown? GBPUSD was moving within an upward trend channel, but last week it broke through the lower support line. It is now testing this support, which has become its resistance. Will it decline further, or was this a false breakout? Let's find out.

GBPUSD Sellers In Panic! BUY!
My dear friends,
Please, find my technical outlook for GBPUSD below:
The price is coiling around a solid key level - 1.2800
Bias - Bullish
Technical Indicators: Pivot Points Low anticipates a potential price reversal.
Super trend shows a clear buy, giving a perfect indicators' convergence.
Goal - 1.2936
About Used Indicators:
The pivot point itself is simply the average of the high, low and closing prices from the previous trading day.
Disclosure: I am part of Trade Nation's Influencer program and receive a monthly fee for using their TradingView charts in my analysis.
———————————
WISH YOU ALL LUCK

GBP/USD Technical Analysis – Long Setup in Play!We’ve just received a fresh BUY signal on the GBP/USD pair following a bullish bounce from the 1.24600 (0.5 Fibonacci retracement) level.
🔍 Key Highlights:
✅ Fibonacci Retracement levels plotted from the 2020 low to the 2021 high show strong technical alignment.
📈 Buy Entry Triggered: Momentum turned bullish after price reclaimed the mid-Fib zone.
📉 Previous resistance near 1.28786 (Fib 0.618) could act as short-term resistance.
📊 VPAO, volume alignment, and trend indicators show rising accumulation.
🎯 Targets:
1.3180 — short-term
1.4234 — long-term retracement high
1.6426 — Fibonacci extension (1.618 level)
🛡️ Stop suggestion: Below recent swing low around 1.2460
This setup suggests growing confidence in GBP strength vs USD. We’ll be monitoring closely for volume confirmation and potential continuation into Q2 2025.

GBPUSD Wave Analysis – 7 April 2025
- GBPUSD reversed from resistance area
- Likely to fall to support level 1.2700
GBPUSD currency pair recently reversed down from the resistance area between the resistance level 1.3050 (which reversed the price in October and November), upper daily Bollinger Band and the resistance trendline of the daily up channel from January.
The pair just broke the aforementioned daily up channel – which should accelerate the active impulse wave 1.
Given the moderately bullish US dollar sentiment seen today, GBPUSD currency pair can be expected to fall to the next support level 1.2700.


Gu(1h)1h structure slso bearish.
Woll be looking for sells around the zones marked
1h pullback may be Possible of the int. Structure shifts bullish.
If the 1h shifts bullish then the 4h pullback will be eminent

Gu(4h)4h structure looks bearish.
Alines with the daily structure.
Will be looking for sells to clear thd buyside liquidity.
Target will be 1.2600.


GBP/USD... Sell chart pattren...MY short position on GBP/USD starting at 1.28000 looks like it's got some potential, especially with those target points at 1.25500 and 1.22700. To really dig into this, let's break down the technical setup.
First off, the current trend in GBP/USD seems to be bearish, which aligns with your short position. If we look at the charts, particularly the 4-hour and daily charts, we can see some key levels that might influence the price movement.
*Key Levels to Watch*
1. *Support Levels*: These are crucial for understanding where the price might bounce back or break through. Your first target at 1.25500 looks like it could be a significant support level based on recent price action. If the price breaks through this level, it might head towards your second target at 1.22700.
2. *Resistance Levels*: For your short position, the key resistance level to watch would be around the entry point of 1.28000. If the price starts to climb back towards this level, it might indicate a reversal in the trend, which would be a signal to reconsider your position.
*Indicators*
- *Moving Averages (MA)*: A bearish crossover in the short-term and long-term moving averages (e.g., 50-period and 200-period MAs) could reinforce the bearish trend, supporting your short position.
- *Relative Strength Index (RSI)*: An RSI below 50 often indicates a bearish trend. If the RSI is hovering around 30-40, it might suggest that the pair is oversold, potentially leading to a bounce-back or consolidation phase.
*Economic News and Events*
Keeping an eye on economic indicators from both the UK and the US is crucial. Events like interest rate decisions, GDP growth rates, and employment data can significantly impact the GBP/USD pair. For instance:
- *UK Economic Data*: Weak economic data could further depress the GBP, supporting your short position.
- *US Economic Data*: Strong US economic data could strengthen the USD, also supporting your short position on GBP/USD.
*Risk Management*
Given the potential volatility, setting a stop loss is a good call. Consider placing it slightly above a significant resistance level to limit potential losses if the trend reverses. Regularly monitoring the trade and adjusting your stop loss as the price moves in your favor can also help manage risk.
*Next Steps*
- *Technical Analysis Tools*: Utilize tools like Fibonacci retracement levels, Bollinger Bands, and the MACD indicator to get a more comprehensive view of potential price movements.
- *Stay Informed*: Keep up-to-date with market news and economic calendars to anticipate potential market-moving events.
Do you want to dive deeper into any specific technical indicators or discuss potential scenarios based on upcoming economic events?

GBPUSD INTRADAY corrective pullback supported at 1.2765GBP/USD maintains a bullish bias, with the broader trend and structure supporting upside continuation. The recent intraday move appears to be a corrective pullback toward a key prior consolidation area.
Key Support: 1.2765 – aligns with the previous consolidation zone and potential bullish inflection point.
Upside Targets:
1.2935 – initial resistance level
1.2985 and 1.3026 – medium to long-term bullish targets
If price finds support at 1.2765 and forms a bullish reversal, it would confirm the continuation of the uptrend toward the mentioned resistance levels.
However, a break and daily close below 1.2765 would invalidate the bullish scenario, suggesting deeper retracement toward 1.2688, with further support at 1.2632 and 1.2600.
Conclusion
GBP/USD remains bullish above 1.2765. Look for a bounce from this level to confirm upside continuation. A daily close below 1.2765 would turn the outlook bearish, exposing lower support levels.
This communication is for informational purposes only and should not be viewed as any form of recommendation as to a particular course of action or as investment advice. It is not intended as an offer or solicitation for the purchase or sale of any financial instrument or as an official confirmation of any transaction. Opinions, estimates and assumptions expressed herein are made as of the date of this communication and are subject to change without notice. This communication has been prepared based upon information, including market prices, data and other information, believed to be reliable; however, Trade Nation does not warrant its completeness or accuracy. All market prices and market data contained in or attached to this communication are indicative and subject to change without notice.

GU-Mon-7/04/25 Top down analysis-Huge liquidity grab on GU!Analysis done directly on the chart
You don't have to be a genius to understand
macro economically what's happening in the market.
Use economic calendar, FinancialJuice to stay up to date.
Not financial advice, DYOR.
Market Flow Strategy
Mister Y

The Day AheadKey Data Releases (Market Moving Potential)
US – February Consumer Credit
Insight into consumer borrowing trends – potential impact on USD and interest rate expectations.
China – March Foreign Reserves
Watch for signals on capital flows and yuan (CNY) stability.
Japan – February Labor Cash Earnings, Leading & Coincident Indexes
Wage data affects inflation outlook – key for JPY and BoJ policy watchers.
Germany – February Industrial Production & Trade Balance
Vital for assessing Eurozone growth momentum – may impact EUR.
Eurozone – February Retail Sales
Consumer activity in focus – important for ECB policy direction.
Central Bank Watch
Bank of Canada – Business Outlook Survey
Could move CAD if sentiment suggests rate shift ahead.
ECB – Cipollone Speech
Monitor for clues on rate path or balance sheet policy – relevant to EUR trades.
This communication is for informational purposes only and should not be viewed as any form of recommendation as to a particular course of action or as investment advice. It is not intended as an offer or solicitation for the purchase or sale of any financial instrument or as an official confirmation of any transaction. Opinions, estimates and assumptions expressed herein are made as of the date of this communication and are subject to change without notice. This communication has been prepared based upon information, including market prices, data and other information, believed to be reliable; however, Trade Nation does not warrant its completeness or accuracy. All market prices and market data contained in or attached to this communication are indicative and subject to change without notice.

GBPUSD BUY Well let's try another idea for today, i can see gbpusd make 3rd wave up to make HnS pattern and then massive sell if powell doesnt cut rates(emergency) , Monday is scary day and there is chance to lose trades as there is no structure yet , let's see if this plays out !
3 RRR
GL Traders
Not advice !

Bullish Rectangle of CableChart Shapes Work Very Well When News and Financial Indicators also Confirm Them. You See Here a Bullish Rectangle in GBPUSD Day Chart. For Long Time Holders It is A Good Trade Time.

GBP/USD Softens in Risk-Off TradeThe GBP/USD pair dipped 0.11% to $1.289 in Asian trading, pressured by global recession fears and rising U.S.-China trade tensions. While expectations of Fed rate cuts have weighed on the dollar, the pound remains weak amid economic uncertainty and an unclear Bank of England outlook. With no strong catalysts, GBP/USD may stay vulnerable, especially if risk aversion intensifies.
If GBP/USD breaks above 1.3000, resistance levels are at 1.3050 and 1.3120. Support is at 1.2900, followed by 1.2850 and 1.2800.

GBPUSD-(Close Door Analysis) A simple chart Analysis.Defining the Entry and the 2 Exit Strategy(TP & SL)..You can comment in the section below and Follow for more Video Analysis..ENJOY!!
