GBPUSD Technical Analysis by TradingDONThe market might have finished its liquidity grab below recent lows—the so-called “sweep” near 1.2900—and could be ready to bounce back if the broader timeframe stays bullish.
1. Entry Signal:
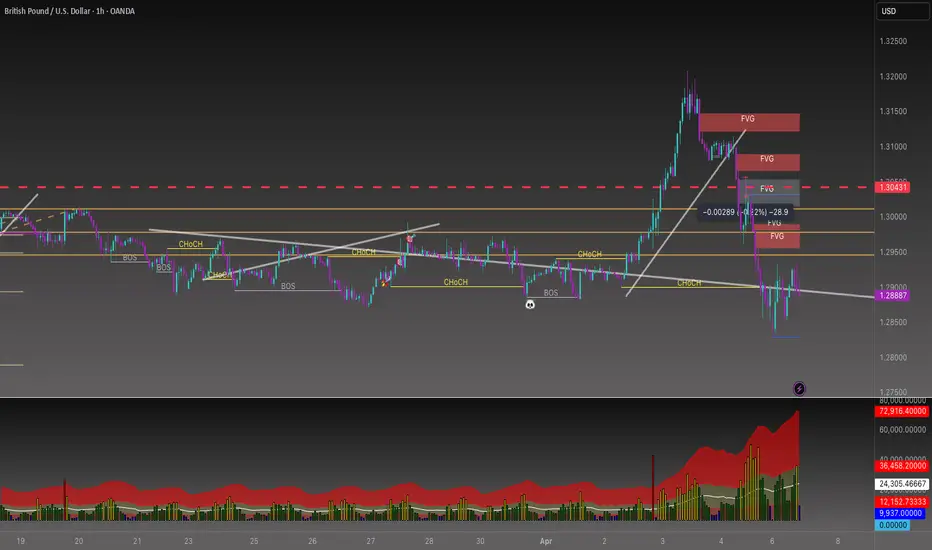
A clear 1-hour close above 1.2950–1.2960 (and perhaps a retest) would indicate that buyers are stepping back in.
2. Entry Idea:
Go long if the price breaks and holds above the short-term structure or if it retests an H1 FVG/demand zone around 1.2900–1.2920, forming bullish reversal candles.
3. Stop Loss:
Place your stop below the recent low or the FVG/demand zone (around 1.2880–1.2900). If the price continues dropping below this level, your bullish thesis is invalidated.
4. Take Profit Targets:
Aim for the upper FVG near 1.3000–1.3050, with partial profits taken at key psychological levels (like 1.3000) or previous swing highs.
5. Rationale:
If the higher timeframe trend remains bullish, the current dip might just be a “discount” opportunity for smart money to load up on longs. Reclaiming key structure levels on the H1 chart would confirm that bullish momentum is returning.
GBPUSD.P trade ideas
GBPUSD → False break of weekly support + DXY fallFX:GBPUSD is going through a shakeout phase relative to the trading range. Last week was very challenging in terms of unpredictable moves and volatility.
A strong NFP report on Friday allowed the dollar to strengthen, but the reaction from the opening of the new trading week has already exhausted itself as traders are still watching the tariff war, which simply crashed the stock, futures markets.
Technically, the currency pair on this background can win out, as the pound sterling within the ascending trend, the fall of the dollar can continue the growth phase.
On the chart, the price forms a false breakdown of the support conglomerate, which in general may push the price up due to the imbalance of liquidity and interests of money moving away from the dollar
Resistance levels: 1.2932, 1.3010
Support levels: 1.2828, 1.2811
If the bulls will keep the price above 1.2868 and will be able to consolidate above 1.2932, in the short term the market can show growth up to the next target - resistance 1.3010.
Regards R. Linda!

GBP/USD Holds Support at $1.2860FenzoFx—GBP/USD downtrend eased at $1.2860. The bearish outlook remains valid as long as the price is below the $1.2960 resistance level, backed by the 50-period moving average.
However, bears must close below $1.2860 for the downtrend to resume.

GBPUSD selloffWe wait for this retest and then hope for best, overrall markets should still head downwards as Tariffs are in play, but you always never know what will happen, this will be my play today , I think it was called ''silver bullet'' pattern.
2.7 RRR
GL Traders
Not advice !

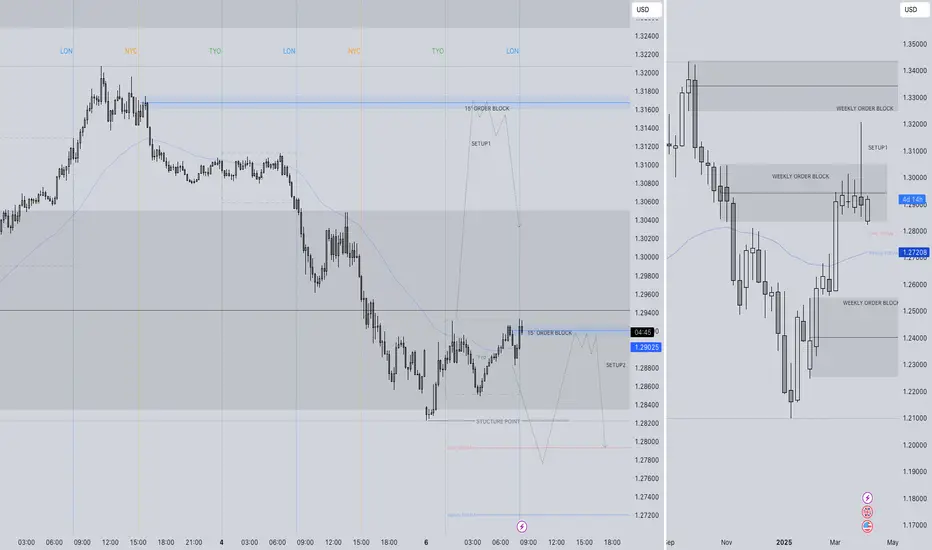
GBPUSD SHORT FORECAST Q2 W15 Y25 MONDAY 7TH APRIL 2024GBPUSD SHORT FORECAST Q2 W15 Y25 MONDAY 7TH APRIL 2024
First and full most, It looks good! However, it's important to approach with caution... much like always.
Pay attention to the previous weekly closure. Yes is it showing a rejection BUT in terms of us always expecting a wick fill prior trading in the opposing direction, Would an immediate short make sense?
We need to see clear price action showing us that it is not interesting in retracting the previous weekly wick with clear bearish movement.
More on the set up descriptions later in terms of text but I trust the chart analysis speaks 1000 words.
FRGNT X
check the trendIt is expected that a trend change will form in the current support area and we will see the beginning of an upward trend. If the price crosses the support area, the continuation of the downward trend to the specified support levels will be possible.

GBP/USD Technical Outlook – April 7, 2025GBP/USD Technical Outlook – April 7, 2025 📊
🔹 Current Price: 1.29116
🔹 Timeframe: 15-Minute Chart
📌 Bullish Scenario (Primary & Alternate Paths):
🟢 Price is approaching a minor resistance at 1.29144, and a break above could lead to a push toward:
📍 1.29620 – Short-term resistance
📍 1.30295 – Key target zone
📌 Demand Zones (Support):
🟩 1.29144 - 1.29307 – Retest zone (potential bullish continuation)
🟩 1.27850 - 1.28350 – Major support for rebound if price rejects near-term structure
🛠️ Game Plan:
✅ Look for confirmations (bullish engulfing or breakout retest) around 1.29144 for long setups.
❗ If price breaks below both demand zones, reassess for bearish pressure.
#GBPUSD #PriceAction #ForexAnalysis #FXFOREVER #SmartMoneyConcepts #DemandZone #SupplyAndDemand #15MAnalysis

GBP/USD 4-Hour Timeframe AnalysisGBP/USD 4-Hour Timeframe Analysis
The GBP/USD pair has been showing a bullish uptrend, influenced by several key factors. We have identified 1.30200 as a minor key resistance level and 1.28600 as a major key support level, both of which are critical in shaping the price action.
Additionally, we have observed a large consolidation phase, indicating that the buying momentum is starting to wane. The price recently broke through the minor resistance level, creating a false breakout that likely triggered pending buy orders from retail traders. This false breakout could potentially lead to a reversal, as the buying pressure diminishes, suggesting a possible shift towards a bearish movement.
More recently, the price broke below the major support at 1.28600, triggering sell positions among retail traders. However, the price did not continue towards the next minor support level, which indicates that market makers may be attempting a liquidity hunt. As a result, the price is now within a liquidity zone, and we expect the potential liquidation of sellers who have placed their stop-loss orders within this zone.
The recent breakout at 1.28600 has resulted in a Change of Character (CHOCH), signaling a shift in market structure from a bullish trend to a potential bearish phase. This change in character could mark the beginning of a longer-term bearish trend.
However, if the price continues to break above the 1.30200 resistance, a continuation of the bullish trend may occur, and we would need to reassess the market conditions.
Trade Plan: Our strategy is to wait for a clear liquidity buildup before the price retests and potentially breaks the major support level again. We plan to enter a Sell Stop order at 1.28680, with a Stop Loss at 1.29430 (just above the liquidity zone) and a Take Profit target at 1.26820, the next significant support level.
Recent Negative Developments Impacting GBP:
April 4, 2025: The British Pound experienced significant declines against major currencies amid a broader market selloff, largely fueled by escalating trade tensions between China and the United States. This has increased market volatility, prompting a flight to safer assets. (Source: Reuters)
April 2, 2025: U.S. President Donald Trump’s announcement of a global tariff strategy, including a baseline 10% levy on all imports, has further strained the British Pound. Although the UK was spared the steepest tariffs, the 10% levy still impacts approximately £60 billion of annual exports to the U.S., raising concerns about potential economic repercussions for the UK.
These negative developments have added downward pressure on the British Pound, reinforcing the bearish outlook for GBP/USD.
📌 Disclaimer:
This analysis is for informational and educational purposes only and should not be considered financial advice. Trading involves substantial risk, and past performance is not indicative of future results. Always conduct your own research and consult with a financial professional before making any investment decisions.

GBPUSD Possible Trade idea GBPUSD H4
After a Bullish BOS, Currency Pros Indicator can identify
Discounted price for possible long positions
targeting the newly created swing high.
Strange enough EU did this before making a new high, but GU made the new high first then went for this LQ grab.
Makes it hard to have confidence on the trade but looks valid.

GBPUSD(20250407)Today's AnalysisMarket news:
Fed Chairman Powell: Wait for clearer news before considering adjusting policy stance. One year later, as the impact of Trump's policies becomes clearer, uncertainty should be greatly reduced. Intends to complete the entire term. Potential tariffs may have a lasting impact on inflation. The impact of tariffs on the economy may be greater than expected. Downside risks have increased, but the economy is still in good shape.
Technical analysis:
Today's long-short boundary: 1.2953
Support and resistance levels
1.3211
1.3114
1.3052
1.2854
1.2791
1.2695
Trading strategy:
If the price breaks through 1.2953, consider buying, the first target price is 1.3052
If the price breaks through 1.2854, consider selling, the first target price is 1.2791

Markets in Turmoil and Correlations breaking - SELL GBPUSDAll the information you need to find a high probability trade are in front of you on the charts so build your trading decisions on 'the facts' of the chart NOT what you think or what you want to happen or even what you heard will happen. If you have enough facts telling you to trade in a certain direction and therefore enough confluence to take a trade, then this is how you will gain consistency in you trading and build confidence. Check out my trade idea!!
www.tradingview.com

GBPUSD H1 | Bullish Bounce Off the127.2% Based on the H1 chart analysis, the price is falling toward our buy entry level at 1.2796, a pullback support that aligns with the 127.2 Fibonacci extension
Our take profit is set at 1.2883, a pullback resistance.
The stop loss is placed at 1.2675, an overlap support.
High Risk Investment Warning
Trading Forex/CFDs on margin carries a high level of risk and may not be suitable for all investors. Leverage can work against you.
Stratos Markets Limited (fxcm.com/uk):
CFDs are complex instruments and come with a high risk of losing money rapidly due to leverage. 63% of retail investor accounts lose money when trading CFDs with this provider. You should consider whether you understand how CFDs work and whether you can afford to take the high risk of losing your money.
Stratos Europe Ltd (fxcm.com/eu):
CFDs are complex instruments and come with a high risk of losing money rapidly due to leverage. 63% of retail investor accounts lose money when trading CFDs with this provider. You should consider whether you understand how CFDs work and whether you can afford to take the high risk of losing your money.
Stratos Trading Pty. Limited (fxcm.com/au):
Trading FX/CFDs carries significant risks. FXCM AU (AFSL 309763), please read the Financial Services Guide, Product Disclosure Statement, Target Market Determination and Terms of Business at fxcm.com/au
Stratos Global LLC (fxcm.com/markets):
Losses can exceed deposits.
Please be advised that the information presented on TradingView is provided to FXCM (‘Company’, ‘we’) by a third-party provider (‘TFA Global Pte Ltd’). Please be reminded that you are solely responsible for the trading decisions on your account. There is a very high degree of risk involved in trading. Any information and/or content is intended entirely for research, educational and informational purposes only and does not constitute investment or consultation advice or investment strategy. The information is not tailored to the investment needs of any specific person and therefore does not involve a consideration of any of the investment objectives, financial situation or needs of any viewer that may receive it. Kindly also note that past performance is not a reliable indicator of future results. Actual results may differ materially from those anticipated in forward-looking or past performance statements. We assume no liability as to the accuracy or completeness of any of the information and/or content provided herein and the Company cannot be held responsible for any omission, mistake nor for any loss or damage including without limitation to any loss of profit which may arise from reliance on any information supplied by TFA Global Pte Ltd.
The speaker(s) is neither an employee, agent nor representative of FXCM and is therefore acting independently. The opinions given are their own, constitute general market commentary, and do not constitute the opinion or advice of FXCM or any form of personal or investment advice. FXCM neither endorses nor guarantees offerings of third-party speakers, nor is FXCM responsible for the content, veracity or opinions of third-party speakers, presenters or participants.

RSI + BB strategy - the strong duo you will ever need to win Hello traders!
This article shares with you a strategy employing two famous indicators that have stood the test of time and used by professionals and amateurs alike. A solid trading plan needs at least one solid strategy which will be your bread and butter. You can always add more strategies or game plans to your repertoire but you need to master one. Trading can be as complicated or simple as you make it. To make sense of it all, you should always try to be realistic and stick to a trading plan which is "simple and stupid" so that you free your mind from overthinking and focus on the market movements instead. A good strategy, along with constant market trend analysis, good risk management, news awareness and emotion control can ultimately transition you to being a consistent profitable trader. Indeed, there are times where the odds will not be in your favour and you will have losing trades. However, the key to success is to think of trading as a game of probability and developing a winning edge that ensures you are profiting more than losing. A 1:2 RRR is the least you have to accept when entering a trade, else sit tight and wait for the next opportunity. As Jesse Livermore quoted, "It never was my thinking that made the big money for me. It always was my sitting. Got that? My sitting tight!".
RSI
Developed by J. Welles Wilder Jr. In 1978, the relative strength index is a momentum indicator that measures the speed and magnitude of price changes. At 70+, RSI is considered overbought and a retracement in price may occur. At 30-, RSI is considered oversold and price may go up. The middle line is the mean of recent prices, usually during a 14 days period.
BB
Developed by John Bollinger much later in the 1980s, BB is a volatility indicator which measures the speed and extent of price changes. A wider band signals high volatility and a narrow band signals low volatility. When price reaches the upper band, the asset is considered overbought and price may retract. When price reaches the lower band, the asset is considered oversold, meaning there are less and less sellers in the market and price may go up. The middle line is usually a simple moving average, showing the mean price across a time period.
RSI + BB strategy
The combination relies, and truthfully so, on the fact that the price of an asset usually hovers around its mean. Unless there are significant macroeconomic changes and news are strong (ultimately forming a new trend), price does not deviate much from its mean. It continues and builds its existing trend and moves up and down the moving average. By meauring both the momentum and volatility of the price, while keeping an eye on the direction of the trend, a trader can place small trades with a minimum 1:2 RRR as the asset moves in a range, an uptrend or a downtrend. The indicators give you insight on where to buy and place your SL and TP.
Trading set ups
- RSI 70+, BB touching upper band, no news, BB horizontal (showing a ranging market), price at major resistance zone - sell because price is likely to move through the moving average towards to lower band
- RSI 30-, BB touching lower band, no news, BB horizontal (showing a ranging market), price at major support zone- buy because price is likely to move through the moving average towards to upper band
- RSI 70+, BB touching upper band (price climbing up the BB ladder), BB moving upwards (uptrend), strong good news - buy because price is in uptrend and trend is likely to continue
- RSI 30-, BB touching lower band (price falling off the BB cliff), strong bad news - sell because price is in downtrend and trend is likely to continue
Sitting tight
-Playing on a 1hr timeframe, there won't be many instances when all these stars align. That is when you sit tight and wait.
- When price is hovering in between the RSI grid and BB band - sit tight and wait because the odds are not in your favour and it is impossible to predict which way price will move. Let the market do its thing, protect your capital and wait for the market to show you what to do next.
Note
- When the conditions are met, always enter the trade as soon as you get confirmation. If you are late in entry, skip the trade and wait
- Place your SL just above the upper BB if selling or just below the lower BB if buying
- TP is essential so you can lock in profits, especially in ranging markets where price quickly touches the BB band and bounces back. If you are in a trade and not able to monitor it, a TP ensures you have closed your trade at your desired and predicted price. TP is placed close to the lower band if selling or close to the upper band if buying
-Ensure that all your other criteria such as news, RRR and emotion control are met to enter a trade. If one is not met, this trade is not for you.
- Familiarise yourself using alerts. You have to be able to be present when the opportunity presents itself. Tradingview's lowest paid plan gives you 20 alerts, which is more than sufficient if you are focusing on 4-5 assets only. Alerts add to your winning edge and enable you to be trading the best set ups when they form.
Please do not hesitate to share your thoughts if you do use RSI and/or BB and have had positive outcomes. :)
GL to all!

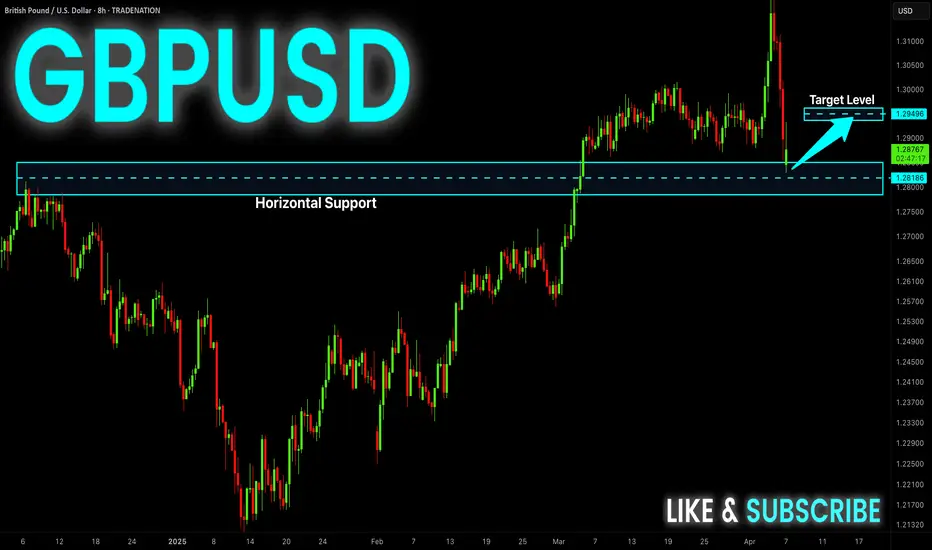
GBP-USD Local Rebound Ahead! Buy!
Hello,Traders!
GBP-USD has hit a
Wide horizontal demand
Level around 1.2800 and
We are seeing a bullish
Rebound already so we
Are locally bullish biased
And we believe we will
Be seeing a further move up
Buy!
Comment and subscribe to help us grow!
Check out other forecasts below too!
Disclosure: I am part of Trade Nation's Influencer program and receive a monthly fee for using their TradingView charts in my analysis.
LEAP: GBPUSD Week 15 Swing Zone/LevelsFollowing last week's sharp whipsaw that ended in a downtrend due to the tariff announcement, the expectation is for the downward trend to continue. That said, price action may ultimately tell a different story.

#Gbpusd The levels where price reactions are most likely to occur during the day. Naturally, at each level, you can have buy and sell positions. The levels are updated daily.
The results of reactions to these levels will be shown in the upcoming videos.

GBPUSD BUY offered to you on a platter!!Dont miss out on this move guys. The tariff will bring dxy down first before we go up. Dont use because the news seems bullish for dollar and miss out this move.
Noone knows what the tariffs mean, I can only interpret the chart and all I'm seeing now is bullishness. BUYYY

Falling towards pullback support?The Cable (GBP/USD) is falling towards the pivot which is a pullback support and could bounce tot he 1st resistance which acts as a pullback resistance.
Pivot: 1.2771
1st Support: 1.2551
1st Resistance: 1.3100
Risk Warning:
Trading Forex and CFDs carries a high level of risk to your capital and you should only trade with money you can afford to lose. Trading Forex and CFDs may not be suitable for all investors, so please ensure that you fully understand the risks involved and seek independent advice if necessary.
Disclaimer:
The above opinions given constitute general market commentary, and do not constitute the opinion or advice of IC Markets or any form of personal or investment advice.
Any opinions, news, research, analyses, prices, other information, or links to third-party sites contained on this website are provided on an "as-is" basis, are intended only to be informative, is not an advice nor a recommendation, nor research, or a record of our trading prices, or an offer of, or solicitation for a transaction in any financial instrument and thus should not be treated as such. The information provided does not involve any specific investment objectives, financial situation and needs of any specific person who may receive it. Please be aware, that past performance is not a reliable indicator of future performance and/or results. Past Performance or Forward-looking scenarios based upon the reasonable beliefs of the third-party provider are not a guarantee of future performance. Actual results may differ materially from those anticipated in forward-looking or past performance statements. IC Markets makes no representation or warranty and assumes no liability as to the accuracy or completeness of the information provided, nor any loss arising from any investment based on a recommendation, forecast or any information supplied by any third-party.

My idea for GBPUSD short positionHi ,there is my idea for short position on GBPUSD ,you need to know how to enter the position at sell zone.

GBPUSD FORECASTIn this analysis we're focusing on 4H time frame for GBPUSD. As we know that market trend was bullish and today I'm looking for a buy side opportunity. According to my analysis, if the market price wants to continue its move to the upside, it will need to first retest the key levels drawn on the chart before it can continue its upward movement. Let's see what happens and which opportunity market will give us. Always remember when price reaches our key levels wait for confirmation. After confirmation execute your trades.
Always use stoploss for your trade.
Always use proper money management and proper risk to reward ratio.
This is just my analysis or prediction.
#GBPUSD 4H Technical Analyze Expected Move.

GBP/USD Long using Fib levelsI will keep analysis brief. I believe we will raid the lower channel then sweep above liquidity and then let the dollar decide it's move based on equity sentiment in the US market.
2.23 R:R trade. I will not be continuing to trade FX - I want to attempt given gold has been so volatile and that is usually the only asset which I trade.
Dark purple lines are major weekly Fib levels.
Dashed light red / pink lines are Fib levels on shorter time zones.
Trade set up is marked out in the picture shown here.
Best of luck if you take this set up and please give feedback on what you think of the idea or the market itself. Big week ahead for the dollar - we will see whether SPX takes a further dive or capital is introduced and market starts to recover.
Best of luck and remember once you get stopped out walk away. This is not a casino!


