GBP/USD BEARS ARE STRONG HERE|SHORT
Hello, Friends!
GBP/USD pair is in the uptrend because previous week’s candle is green, while the price is clearly rising on the 4H timeframe. And after the retest of the resistance line above I believe we will see a move down towards the target below at 1.291 because the pair overbought due to its proximity to the upper BB band and a bearish correction is likely.
Disclosure: I am part of Trade Nation's Influencer program and receive a monthly fee for using their TradingView charts in my analysis.
✅LIKE AND COMMENT MY IDEAS✅
GBPUSD.P trade ideas

GBPUSD friday push ?Bumpy week , let's see what market brings today , but i like this chance from here to get over 1.3000 zone , if not better luck next week ! News after 3 mins aswell
3.5 RRR
GL Traders
Not advice

What Are the Inner Circle Trading Concepts? What Are the Inner Circle Trading Concepts?
Inner Circle Trading (ICT) offers a sophisticated lens through which traders can view and interpret market movements, providing traders with insights that go beyond conventional technical analysis. This article explores key ICT concepts, aiming to equip traders with a thorough understanding of how these insights can be applied to enhance their trading decisions.
Introduction to the Inner Circle Trading Methodology
Inner Circle Trading (ICT) methodology is a sophisticated approach to financial markets that zeroes in on the behaviours of large institutional traders. Unlike conventional trading methods, ICT is not merely about recognising patterns in price movements but involves understanding the intentions behind those movements. It is part of the broader Smart Money Concept (SMC), which analyses how major players influence the market.
Key Inner Circle Trading Concepts
Within the ICT methodology, there are many concepts to learn. Below, we’ve explained the most fundamental ideas central to ICT trading.
Structure
Understanding the structure of a market is fundamental to effectively employing the ICT methodology. In the context of ICT, market structure is defined by the identification of trends through specific patterns of highs and lows.
Market Structure
A market trend is typically characterised by a series of higher highs and higher lows in an uptrend, or lower highs and lower lows in a downtrend. This sequential pattern provides a visual representation of market sentiment and momentum.
Importantly, market trends are fractal, replicating similar patterns at different scales or timeframes. For example, what appears as a bearish trend on a short timeframe might merely be a corrective phase within a larger bullish trend. By understanding this fractal nature, traders can better align their strategies with the prevailing trend at different trading intervals.
Break of Structure (BOS)
A Break of Structure occurs when there is a clear deviation from these established patterns of highs and lows. In an uptrend, a BOS is signalled by prices exceeding a previous high without falling below the most recent higher low, confirming the strength and continuation of the uptrend.
Conversely, in a downtrend, a BOS is indicated when prices drop below a previous low without breaching the prior lower high, signifying that the downtrend remains strong. Identifying a BOS gives traders valuable clues about the continuation of the current market direction.
Change of Character (CHoCH)
The Change of Character in a market happens when there is a noticeable alteration in the behaviour of price movements, suggesting a potential reversal of a given trend. This might be seen in an uptrend where the price fails to reach a new high and then breaks below a recent higher low, indicating that the buying momentum is waning and a bearish reversal is possible.
Identifying a CHoCH helps traders recognise when the market momentum is shifting, which is critical for adjusting positions to capitalise on or protect against a new trend.
Market Structure Shift (MSS)
A Market Structure Shift is a significant change in the market that can disrupt the existing trend. This specific type of CHoCH is typically marked by a price moving sharply (a displacement) through a key structural level, such as a higher low in an uptrend or a lower high in a downtrend.
These shifts can signal a profound change in market dynamics, with the sharp move often preceding a new sustained trend. Recognising an MSS allows traders to reevaluate their current bias and adapt to a new trend, given its clear signal.
Order Blocks
Order blocks are a central component of ICT trading, providing crucial insights into potential areas where the price may react strongly due to significant buy or sell interests from large market participants.
Regular Order Blocks
A regular order block is an area on the price chart representing a concentration of buying (demand zone) or selling (supply zone) activity.
In an uptrend, a bullish order block is identified during a downward price movement and marks the last area of selling before a substantial upward price movement occurs. Conversely, a bearish order block forms in an uptrend where the last buying action appears before a significant downward price shift.
In the ICT trading strategy, order blocks are seen as reversal areas. So, if the price revisits a bullish order block following a BOS higher, it’s assumed that the block will hold and prompt a reversal that produces a new higher high.
Breaker Blocks
Breaker blocks play a crucial role in identifying trend reversals. They are typically formed when the price makes a BOS before reversing and breaking beyond an order block that should hold if the established market structure is to be maintained. This formation indicates that liquidity has been taken.
For instance, in an uptrend, if the price creates a new high but then reverses below the previous higher low, the bullish order block above the low becomes a breaker block. A breaker block can be an area that prompts a reversal as the new trend unfolds; it’s a similar concept to support becoming resistance and vice versa.
Mitigation Blocks
Mitigation blocks are similar to breaker blocks, except they occur after a failure swing, where the price attempts but fails to surpass a previous peak in an uptrend or a previous trough in a downtrend. This pattern indicates a loss of momentum and potential reversal as the price fails to sustain its previous direction.
For example, in an uptrend, if the price makes a lower high and then breaks the structure by dropping below the previous low, the order block formed at the previous low becomes a mitigation block. These blocks are critical for traders because they’re also expected to produce a reversal if a new trend has been set in motion.
Liquidity
Liquidity refers to areas on the price chart with a high concentration of trading activity, typically marked by stop orders from retail traders.
Buy- and Sell-Side Liquidity
Buy-side liquidity is found where there is a likely accumulation of short-selling traders' stop orders, typically above recent highs. Conversely, sell-side liquidity is located below recent lows, where bullish traders' stop orders accumulate. When prices touch these areas, activating stop orders can cause a reversal, presenting a potential level of support or resistance.
Liquidity Grabs
A liquidity grab occurs when the price quickly spikes into these high-density order areas, triggering stops and then reversing direction. In ICT theory, this action is often orchestrated by larger players aiming to capitalise on the flurry of orders to execute their large-volume trades with minimal slippage. It's a strategic move that temporarily shifts price momentum, usually just long enough to trigger the stops before the market direction reverses.
Inducement
An inducement is a specific type of liquidity grab that triggers stops and entices other traders to enter the market. It often appears as a peak or trough, typically into an area of liquidity, in a minor counter-trend within the larger market trend. Inducements are designed by smart money to create an illusion of a trend change, prompting an influx of retail trading in the wrong direction. Once the retail traders have committed, the price swiftly reverses, aligning back with the original major trend.
Trending Movements
In the Inner Circle Trading methodology, two specific types of sharp trending movements signal significant shifts in market dynamics: fair value gaps and displacements.
Fair Value Gaps
A fair value gap (FVG) occurs when there is a noticeable absence of trading within a price range, typically represented by a swift and substantial price move without retracement. This gap often forms between the wicks of two adjacent candles where no trading has occurred, signifying a strong directional push.
Fair value gaps are important because they indicate areas on the chart where the price may return to "fill" the gap, usually before meeting an order block, offering potential trading opportunities as the market seeks to establish equilibrium.
Displacements
Displacements, also known as liquidity voids, are characterised by sudden, forceful price movements occurring between two chart levels and lacking the typical gradual trading activity observed in between. They are essentially amplified and more substantial versions of fair value gaps, often spanning multiple candles and FVGs, signalling a heightened imbalance between buy and sell orders.
Other Components
Beyond these ICT concepts, there are a few other niche components.
Kill Zones
Kill Zones refer to specific timeframes during the trading day when market activity significantly increases due to the opening or closing of major financial centres. These periods are crucial for traders as they often set the tone for price movements based on the increased volume and volatility:
Optimal Trade Entry
An optimal trade entry (OTE) is a type of Inner Circle trading strategy, found using Fibonacci retracement levels. After an inducement that prompts a displacement (leaving behind an FVG), traders use the Fibonacci retracement tool to pinpoint entry areas.
The first point is set at the major high or low that prompts the displacement, while the second point is set at the next significant swing high or low that forms. In a bearish movement, for example, the initial point is set at the swing high before the displacement and the subsequent point at the new swing low. Traders often look to the 61.8% to 78.6% retracement level for entries.
Balanced Price Range
A balanced price range is observed when two opposing displacements create FVGs in a short timeframe, indicating a broad zone of price consolidation. During this period, prices typically test both extremes, attempting to fill the gaps. This scenario offers traders potential zones for trend reversals as the price seeks to establish a new equilibrium, as well as key levels to watch for a breakout.
The Bottom Line
Understanding ICT concepts gives traders the tools to decode complex market signals and align their strategies with the influential trends shaped by the largest market participants. For those looking to apply these sophisticated trading techniques practically, opening an FXOpen account can be a great step towards engaging with the markets through a robust platform designed to support advanced trading strategies.
FAQs
What Are ICT Concepts in Trading?
ICT (Inner Circle Trading) concepts encompass a series of advanced trading principles that focus on replicating the strategies of large institutional players. These concepts include liquidity zones, order blocks, market structure shifts, and optimal trade entries, all aimed at understanding and anticipating significant market movements.
What Is ICT in Trading?
ICT in trading refers to the Inner Circle Trading methodology, a strategy developed to align smaller traders’ actions with those of more influential market participants. It utilises specific market phenomena, such as order blocks and liquidity patterns, to analyse price movements and improve trading outcomes.
What Is ICT Trading?
ICT trading is the application of concepts that seek to identify patterns and structures that indicate potential price changes driven by institutional activities, aiming to capitalise on these movements.
What Is ICT Strategy?
An ICT strategy combines market analysis techniques to identify where significant market players are likely to influence prices. This includes analysing price levels where large volumes of buy or sell orders are anticipated to occur and identifying key times when market moves are most likely.
Is ICT Better Than SMC?
Comparing ICT and SMC (Smart Money Concept) is challenging as ICT is essentially a subset of SMC. While SMC provides a broader overview of how institutional money influences the markets, ICT offers more specific techniques and terms like inducements and displacements. Whether one is better depends on the trader’s specific needs and alignment with these methodologies’ intricacies.
This article represents the opinion of the Companies operating under the FXOpen brand only. It is not to be construed as an offer, solicitation, or recommendation with respect to products and services provided by the Companies operating under the FXOpen brand, nor is it to be considered financial advice.

GBPUSD(Close Door Analysis)Lets Sell on the GBPUSD,in 30Mins news will be realize...Lets ride on the News and enjoy some Profit.

We close the week with GBPUSD LongsIt has been quite a mess in GBPUSD for the last weeks. But i think yesterdays bull move and upclose candle on the daily brought clarity to the direction.
Today, am aiming for longs all the way to 1.30200.
Nice trading.

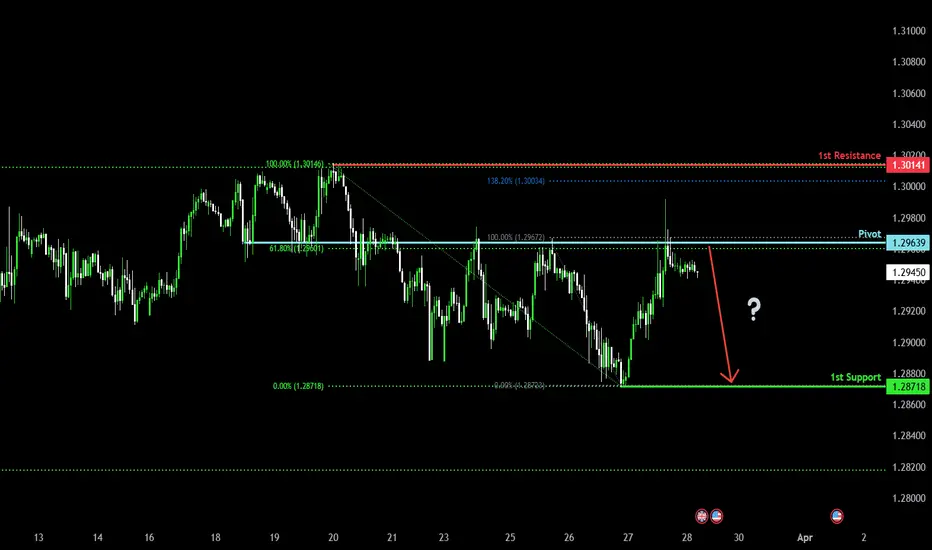
Bearish drop?The Cable (GBP/USD) has reacted off the pivot and could drop to the pullback support.
Pivot: 1.2963
1st Support: 1.2871
1st Resistance: 1.3014
Risk Warning:
Trading Forex and CFDs carries a high level of risk to your capital and you should only trade with money you can afford to lose. Trading Forex and CFDs may not be suitable for all investors, so please ensure that you fully understand the risks involved and seek independent advice if necessary.
Disclaimer:
The above opinions given constitute general market commentary, and do not constitute the opinion or advice of IC Markets or any form of personal or investment advice.
Any opinions, news, research, analyses, prices, other information, or links to third-party sites contained on this website are provided on an "as-is" basis, are intended only to be informative, is not an advice nor a recommendation, nor research, or a record of our trading prices, or an offer of, or solicitation for a transaction in any financial instrument and thus should not be treated as such. The information provided does not involve any specific investment objectives, financial situation and needs of any specific person who may receive it. Please be aware, that past performance is not a reliable indicator of future performance and/or results. Past Performance or Forward-looking scenarios based upon the reasonable beliefs of the third-party provider are not a guarantee of future performance. Actual results may differ materially from those anticipated in forward-looking or past performance statements. IC Markets makes no representation or warranty and assumes no liability as to the accuracy or completeness of the information provided, nor any loss arising from any investment based on a recommendation, forecast or any information supplied by any third-party.
GBPUSD InsightWelcome, Subscribers!
We’re glad to have you all here. Please share your personal opinions in the comments. Don’t forget to like and subscribe!
Key Points
- Reuters reported that the U.S. has no plans to negotiate with the European Union until next week's reciprocal tariff announcement.
- President Trump, through Truth Social, warned that if the EU and Canada cooperate to economically harm the U.S., he would impose significantly higher tariffs.
- In the U.K., the persistent fiscal deficit issue has once again drawn attention, leading to a rise in U.K. government bond yields. The British government has revised its 2024 GDP growth forecast downward from 2% to 1%.
Key Economic Events This Week
+ March 28: U.K. Q4 GDP, U.S. February Personal Consumption Expenditures (PCE) Price Index
GBPUSD Chart Analysis
After reaching the 1.30000 level, GBPUSD has failed to show a clear trend and continues to move within the lower range of this level. If it fails to break above 1.30000 and moves downward, it may decline to 1.28000 before rebounding toward 1.31000. Conversely, if an upward trend continues, it is likely to break 1.31000 and rise further toward 1.34000.

GBPUSD 4H SHORTAt the moment, GBPUSDT the asset is being marked down. There was a price reaction to the POI range from which a reaction was received instantly. I missed this moment due to personal matters, although there was a reminder. I understand that the risk of not opening, or the receipt of new variables from the market, can break the trend, but I will try to open a short from the designated mark 1.29686$
Targets
$1.28609
$1.28030
$1.27534
$1.26722
Risk for stop order -1%

GU - PullbackWe have had a nice pullback after the strong bullish move. I will be expecting to see price to fill the FVG which is drawn on the M2 timeframe that coincides with a breaker block for more confluence. Price is also at .705 on the Fibonacci showing a strong pullback.

GBP/USD The 1.3000 GrindGBP/USD could be a compelling pair for those looking for USD-weakness. While EUR/USD has strung together six consecutive down days and USD/JPY continues to surge-higher even with USD-weakness showing in DXY, GBP/USD has held up fairly well, all factors considered. Also of interest is the big figures at play, with the 1.3000 level back in the equation on GBP/USD. That price has been tested a few times already and buyers came about 10 pips away from another test there earlier today.
Meanwhile EUR/USD has held below 1.1000 so if we do see USD-weakness after Core PCE tomorrow, there could be a case for stalling about 50 pips above prior resistance. GBP/USD, on the other hand, has already taken a few shots at 1.3000, so if we see the Dollar slip that could open the door for a GBP/USD breakout to another fresh 2025 high. - js

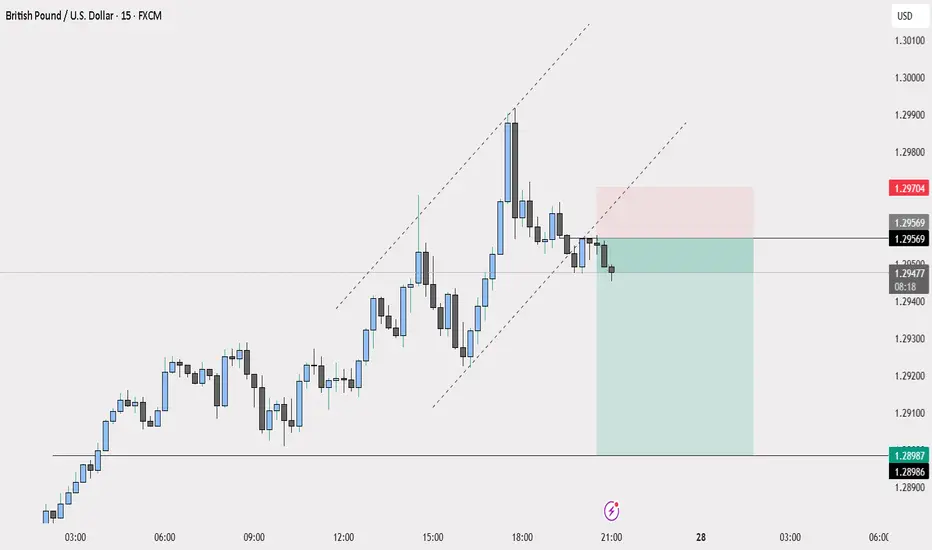
Sell GBPUSDGBPUSD will decline now towards the end of NY session. Price has broken out of a rising channel and looks to fall to support 1,29
GBPUSD GBPUSD Analysis & Signal (1H Timeframe)
📅 Date: March 23, 2025
On the GBP/USD chart, the price has reached a key resistance zone around 1.29629 after an uptrend, showing signs of rejection. This resistance aligns with a descending trendline, adding to the selling pressure.
Currently, the price is heading toward the demand zone marked between 1.28613 and 1.28117, which could act as a strong support level.
Signal:
Sell:
📍Entry Point: 1.29114 (current price)
🔴Stop Loss: 1.29629 (above resistance)
🟢Take Profit 1: 1.28613
🟢Take Profit 2: 1.28117
⚠️Risk Management:
With the stop loss set above the resistance, the risk-to-reward ratio (R:R) for this trade is at least 1:2. It’s recommended to risk only 1-2% of your capital on this trade.
📝Note: Before entering the trade, wait for additional confirmations (e.g., reversal candlestick patterns or a break of the zone) and assess market conditions.

GBPUSD SELL30MIN SALE BASED OFF THE AI INDICATOR I PUBLISHED RECENTLY FOLLOW FOR MORE, BY THE TIME OF ENTRY SELL SIGNAL WAS AT 85%
30MIN sale off the ai indicator i published recently, follow for more, by the time of sell entry, the sell signal from the ai was at 85% chances of hitting 15pips however i went more but with caution.

GBPUSD Be bullishIf GBPUSD can effectively break through the resistance level of 1.30000, it is likely to attract more bulls to enter the market, driving the exchange rate to rise further.
The potential resistance levels above might be around 1.31400, 1.32100, etc. On the contrary, if it encounters resistance and drops back near 1.30000, the support levels below are at around 1.28888 and 1.27000.
💎💎💎 GBPUSD 💎💎💎
🎁 Buy@1.28000 - 1.28500
🎁 TP 1.30000 - 1.31400
The market has been extremely volatile lately. If you can't figure out the market's direction, you'll only be a cash dispenser for others. If you also want to succeed,Follow the link below to get my daily strategy updates

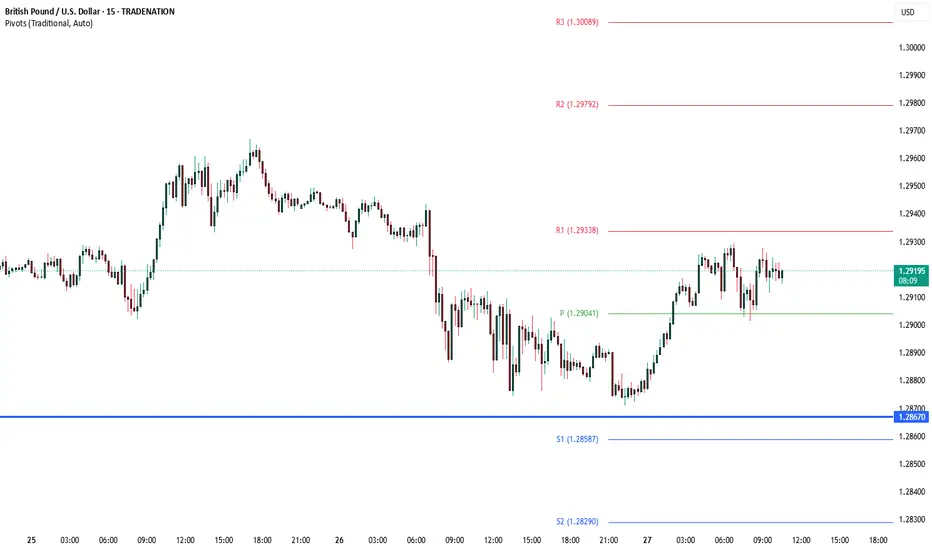
GU | 1HR Analysis 3/27/25Price is in a bearish trend currently making lower lows and lower highs. I would watch this hourly OrderBlock zone and see how lower timeframe reacts to it. If a setup occurs, my take profit would be the swing low.
Trade Safe =Remzy

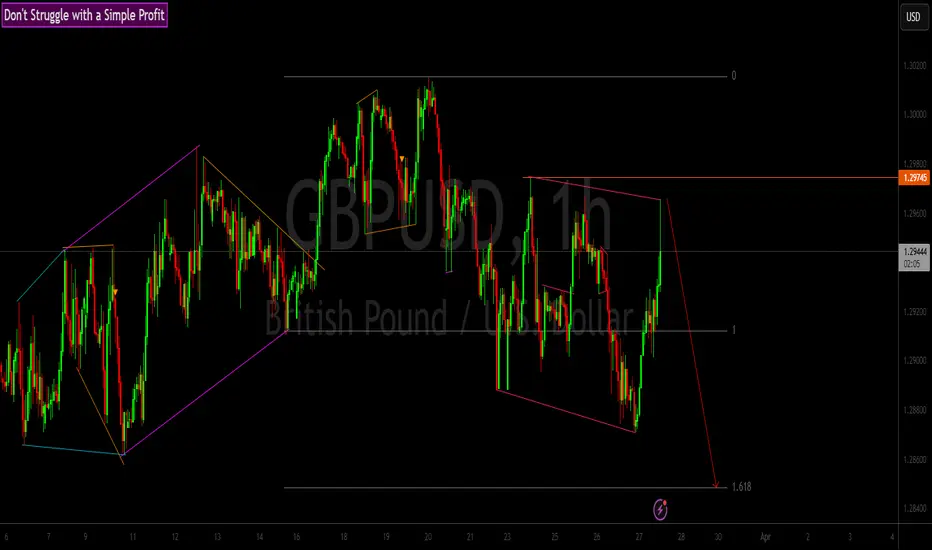
GBPUSD in Correction Phase – Potential for a Short OpportunityGBPUSD ( FX:GBPUSD ) is approaching the Support zone($1.286-$1.278) , Support lines and Important Support line .
Regarding Elliott Wave theory , GBPUSD appears to have completed the microwave 5 of the main wave 3 with the help of the Ending Diagonal Pattern and is currently completing the main wave 4 . The main wave 4 is likely to have a Double Three Correction(WXY) .
I expect GBPUSD to decline at least to the Support zone($1.286-$1.278) and Support lines .
Note: If GBPUSD goes above $1.30 we should expect more pumping. The worst Stop Loss(SL) for a SHORT position could be $1.30.
Note: If GBPUSD falls below $1.2760, we should expect more dumping.
Please respect each other's ideas and express them politely if you agree or disagree.
British Pound/U.S. Dollar Analyze (GBPUSD), 4-hour time frame.
Be sure to follow the updated ideas.
Do not forget to put a Stop loss for your positions (For every position you want to open).
Please follow your strategy and updates; this is just my Idea, and I will gladly see your ideas in this post.
Please do not forget the ✅' like '✅ button 🙏😊 & Share it with your friends; thanks, and Trade safe.

2nd attempt shorting GUDaily chart and 4h chart are showing bearish order flow
4h and 1h chart are showing potential internal range into external range move. Fair value gaps on both 4h and 1h are being respected.
SMT divergence on 1h and 15m.

GBPUSD INTRADAY - UK is in intensive tariff talks with US UK Finance Minister Rachel Reeves said the UK is in intensive tariff talks with the Trump administration, emphasizing the importance of free trade. She warned that trade frictions could slow economic growth and expressed a preference for lower tariffs. The comments added uncertainty to GBP/USD, as traders weigh potential trade disruptions.
The GBPUSD currency pair price action sentiment appears bullish, supported by the prevailing uptrend. The recent intraday price action appears to be a sideways consolidation towards the previous resistance.
The key trading level is at 1.2940 level, the previous consolidation price range. A corrective pullback from the current levels and a bullish bounce back from the 1.2940 level could target the upside resistance at 1.2994 followed by the 1.3070 and 1.3123 levels over the longer timeframe.
Alternatively, a confirmed loss of the 1.2940 support and a daily close below that level would negate the bullish outlook opening the way for a further retracement and a retest of 1.2866 support level followed by 1.2813 and 1.2740.
This communication is for informational purposes only and should not be viewed as any form of recommendation as to a particular course of action or as investment advice. It is not intended as an offer or solicitation for the purchase or sale of any financial instrument or as an official confirmation of any transaction. Opinions, estimates and assumptions expressed herein are made as of the date of this communication and are subject to change without notice. This communication has been prepared based upon information, including market prices, data and other information, believed to be reliable; however, Trade Nation does not warrant its completeness or accuracy. All market prices and market data contained in or attached to this communication are indicative and subject to change without notice.

The Day Ahead: Market Focus & Key Events Macro Data Releases:
US: February pending home sales, advance goods trade balance, wholesale inventories, March Kansas City Fed manufacturing activity, initial jobless claims
China: February industrial profits
Japan: March Tokyo CPI
Eurozone: February M3 money supply
Central Bank Speakers & Policy Updates:
Fed: Barkin speaks
BoJ: March meeting summary of opinions
ECB: Guindos, Villeroy, Wunsch, Escriva, Schnabel speak
BoE: Dhingra speaks
Norges Bank: Rate decision
Earnings Watch:
H&M, Lululemon
Fixed Income Auctions:
US Treasury: 7-year Notes
Other Notable Reports:
US CBO releases The Long-Term Budget Outlook: 2025 to 2055
Market Impact Considerations:
FX: Fed and BoE commentary could drive volatility in GBP/USD, while Norges Bank’s decision may influence EUR/NOK.
Equities: H&M and Lululemon earnings could impact retail sentiment.
Bonds: The 7-year Treasury auction and US macro data may guide Treasury yields.
Commodities: China’s industrial profits and Japan’s CPI could influence risk sentiment and commodity demand.
This communication is for informational purposes only and should not be viewed as any form of recommendation as to a particular course of action or as investment advice. It is not intended as an offer or solicitation for the purchase or sale of any financial instrument or as an official confirmation of any transaction. Opinions, estimates and assumptions expressed herein are made as of the date of this communication and are subject to change without notice. This communication has been prepared based upon information, including market prices, data and other information, believed to be reliable; however, Trade Nation does not warrant its completeness or accuracy. All market prices and market data contained in or attached to this communication are indicative and subject to change without notice.
TP HITWas a bumper ride after sweeping my SL but made it to TP1, let see if the market will continue in an uptrend or i close

Trade Idea: GBP/USD Long SetupPair: GBP/USD
Timeframe: 4-Hour (4H)
Trade Type: Long
Entry: 1.2900 - 1.2950
Stop Loss: 1.2850 (below previous structure low)
Technical Analysis:
GBP/USD has been trending within a well-defined ascending channel, characterized by higher highs and higher lows. The recent price action saw a pullback toward the lower boundary of this channel, around the 1.2860 region, which coincides with the 200-period Simple Moving Average (SMA) on the 4-hour chart, providing a confluence of support. A bullish candlestick pattern or a bounce from this support zone could signal a potential continuation of the uptrend toward the upper channel resistance near 1.3270. 
Fundamental Analysis:
Recent economic developments support a bullish outlook for GBP/USD:
• UK Inflation Data: The UK’s Consumer Price Index (CPI) rose by 2.8% in February, down from 3% in January and below the expected 2.9%. This easing inflation may influence the Bank of England’s monetary policy decisions, potentially leading to a more accommodative stance, which can be supportive of the GBP. 
• US Economic Factors: The US is set to impose new tariffs starting in April, which could impact market sentiment and influence USD strength. Additionally, upcoming US PMI data may provide further insights into economic conditions that could affect USD performance.

gbpusd sell ?GBPUSD is at descending channel and we are at top line , so its possible for reversal now and going down, i believe we have to get retest aswell to the bottom . Many news today, i expect volume !
2 RRR
GL Traders
Not advice !
