GBPUSD fast sell There is a gap where London pushed over and price went up , i would like to see pre-NY session to get this gap and then do what ever price wants to do next . Remember guys today is Tariffs announcment , be careful !
2 RRR
GL Traders
Not Advice
GBPUSD.P trade ideas

GBPUSD What Next? SELL!
My dear subscribers,
GBPUSD looks like it will make a good move, and here are the details:
The market is trading on 1.2947 pivot level.
Bias - Bearish
Technical Indicators: Both Super Trend & Pivot HL indicate a highly probable Bearish continuation.
Target - 1.2921
About Used Indicators:
The average true range (ATR) plays an important role in 'Supertrend' as the indicator uses ATR to calculate its value. The ATR indicator signals the degree of price volatility.
Disclosure: I am part of Trade Nation's Influencer program and receive a monthly fee for using their TradingView charts in my analysis.
———————————
WISH YOU ALL LUCK

GBPUSD BUY !I have in mind this buy , let’s hope markets plays out like this, as Trump’s tarrifs is affecting markets. We can see clearly downtrend and all the time market push itself down, i could see before Tariff announcment it could go up as we can't know what happens after announcment
2.5 RRR
GL Traders
Not Advice

POTENTIAL LONG POSITIONS ON GBP/USDGBP/USD 1H - This is another pair I have been looking at that is holding some good potential. This market has been bullish for some time on the higher timeframes.
We saw that price was breaking lows and respecting areas of Supply within this ranging market, however we have now seen that these characteristics have reversed and price is actually starting to breaking highs, protect lows and trade higher.
You can see that the last high that set the lowest low within what looks to be a potential corrective wave was broken, giving us our first break to the upside. We have then seen another one take place after price has traded into another area of interest.
This second break is giving us further confluence to suggest potential bullishness. Aligning with our GBP/JPY analysis. I want to see price now trade down and into the Demand Zone I have marked out, deliver us with another break to the upside. This would give me confirmation to look to go long.

Short till 1.28788Failure of price to displace above 1.29401 has warranted bearish momentum down to 1.28788

Long till 1.29325Price has failed to displace below 1.29077, warranting bullish momentum till 1.29325.

XAGUSD, DXY, EURUSD & GBPUSD Daily Trade SetupsIn this update we review the recent price action in Silver, the Dollar Index, EURUSD & GBPUSD and identify the next high-probability trading opportunities and price objectives to target. To review today's video analysis, click here!

The Day AheadWednesday, April 2
Data Releases: US March ADP report, February factory orders, Japan March monetary base, France February budget balance.
Central Banks: Speeches from Fed’s Kugler, ECB's Schnabel, and Escriva.
Trump Tariff Announcement: Trump’s team is finalizing options for a 4 p.m. announcement, considering a tiered system with flat rates or a customized approach.
This communication is for informational purposes only and should not be viewed as any form of recommendation as to a particular course of action or as investment advice. It is not intended as an offer or solicitation for the purchase or sale of any financial instrument or as an official confirmation of any transaction. Opinions, estimates and assumptions expressed herein are made as of the date of this communication and are subject to change without notice. This communication has been prepared based upon information, including market prices, data and other information, believed to be reliable; however, Trade Nation does not warrant its completeness or accuracy. All market prices and market data contained in or attached to this communication are indicative and subject to change without notice.

GBPUSD BUYLondon session buys on GBPUSD are lurking. Could we be granted just one last opportunity to buy at 1,29097, we can only hope. If you have a big account, buy GBPUSD now

GBPUSD A clear downward move toward downside find out the targetHello Guys,
Wish you and Your Family a Very Happy Eid.
I Found out one very easy to target GBPUSD trade setup for the week . here i can see GBPUSD is building a short term wave towards downside to target 1.2780 or below .
As we have created a Higher time frame OTE model

GU-Wed-2/04/25 Top down analysis-Have patience on GUAnalysis done directly on the chart
Not the best week even for the best traders.
Don't feel discouraged, quality over quantity.
Have you seen good setups in this messy
Market condition and amid uncertainty? Know
how to preserve and protect your capital
during hard times and maximize profits when
smooth price action with clarity in the market
comes.
Not financial advise, DYOR.
Market Flow Strategy
Mister Y

Market Analysis: GBP/USD Eyes Fresh GainsMarket Analysis: GBP/USD Eyes Fresh Gains
GBP/USD started a fresh increase above the 1.2900 zone.
Important Takeaways for GBP/USD Analysis Today
- The British Pound is eyeing more gains above the 1.2970 resistance.
- There is a key bearish trend line forming with resistance at 1.2935 on the hourly chart of GBP/USD at FXOpen.
GBP/USD Technical Analysis
On the hourly chart of GBP/USD at FXOpen, the pair formed a base above the 1.2870 level. The British Pound started a steady increase above the 1.2900 resistance zone against the US Dollar, as discussed in the previous analysis.
The pair surpassed the 50% Fib retracement level of the downward move from the 1.2972 swing high to the 1.2879 low. The pair is now consolidating near the 1.2925 zone and the 1.2420 level and the 50-hour simple moving average.
If there is another decline, the pair could find support near the 1.2900 level. The first major support sits near the 1.2880 zone. The next major support is 1.2870.
If there is a break below 1.2870, the pair could extend the decline. The next key support is near the 1.2820 level. Any more losses might call for a test of the 1.2800 support.
Conversely, the bulls might aim for more gains. The RSI moved above the 50 level on the GBP/USD chart and the pair is now approaching a major hurdle at 1.2935 and the 61.8% Fib retracement level of the downward move from the 1.2972 swing high to the 1.2879 low.
There is also a key bearish trend line forming with resistance at 1.2935. An upside break above the 1.2935 zone could send the pair toward 1.2970. Any more gains might open the doors for a test of 1.2995.
This article represents the opinion of the Companies operating under the FXOpen brand only. It is not to be construed as an offer, solicitation, or recommendation with respect to products and services provided by the Companies operating under the FXOpen brand, nor is it to be considered financial advice.

GBPUSD(20250402)Today's AnalysisToday's buying and selling boundaries:
1.2913
Support and resistance levels
1.2973
1.2951
1.2936
1.2889
1.2875
1.2852
Trading strategy:
If the price breaks through 1.2936, consider buying, the first target price is 1.2951
If the price breaks through 1.2913, consider selling, the first target price is 1.2889

Starting over in trading- A short guideThe internet has made it easier than ever to learn trading for free. You have access to blogs, videos, books, podcasts, and more. Yet, most traders still fail.
Why?
Because there’s too much information. It’s overwhelming, confusing, and filled with conflicting advice.
So, if I had to start over from scratch, here’s exactly how I’d do it—step by step.
________________________________________
Step 1: Master Risk Management
No matter what type of trader you become—day trader, swing trader, options trader, quantitative trader, etc.—risk management is the foundation of long-term success.
It’s also one of the easiest things to master, and once you do, it will pay off for the rest of your trading career.
Risk Management Essentials:
✅ Never risk more than 1-2% of your account per trade.
✅ Always use stop losses to protect your capital.
✅ Focus on risk-to-reward ratios (aim for at least 1:2 or better).
✅ Manage position sizing properly to avoid blowing up your account.
Once you understand how to protect your capital, it’s time to expose yourself to the trading world.
________________________________________
Step 2: Learn & Explore Different Trading Styles
When you're just starting, you don’t know what you don’t know.
Your goal at this stage is to explore different trading strategies, tools, and methods.
What to Learn:
🔹 Candlestick patterns & price action
🔹 Indicators (moving averages, RSI , MACD , etc.)
🔹 Chart patterns (head & shoulders, triangles, etc.)
🔹 Market structures (support/resistance, trends, ranges)
🔹 Different trading styles (day trading, swing trading, scalping, momentum trading, etc.)
Mindset for This Phase:
🚀 Keep an open mind—don’t judge strategies too early.
🚀 Focus on learning rather than making money right away.
🚀 Accept that not everything will work for you—and that’s okay.
At this stage, your goal is not to become an expert in everything but to discover what resonates with you.
________________________________________
Step 3: Pick ONE Strategy & Go Deep
After exploring different strategies, you need to commit to ONE.
This eliminates information overload and allows you to focus on mastering a single trading method.
How to Choose a Strategy:
🔹 Does it fit your personality? (e.g., If you hate fast decision-making, avoid scalping.)
🔹 Does it match your lifestyle? (e.g., If you have a full-time job, swing trading might be better than day trading.)
🔹 Can you understand the logic behind it? (A good strategy should be simple, not overly complicated.)
Example: Mean Reversion Strategy in Stocks
• Identify stocks in an uptrend 📈
• Wait for a pullback (price moves lower)
• Enter when the stock shows signs of resuming the trend
• Sell on the next rally
By focusing on one strategy, you eliminate confusion and make faster progress.
________________________________________
Step 4: Create & Refine Your Trading Plan
Now that you have a strategy, it’s time to turn it into a structured trading plan.
Your trading plan should include:
✅ Market Conditions – When will you trade? Trending or ranging markets?
✅ Entry Rules – What signals will you use to enter a trade?
✅ Exit Rules – When will you take profits or cut losses?
✅ Risk Management – How much will you risk per trade?
💡 Example Trading Plan (Momentum Trading):
• Market: Trade only in strong uptrends.
• Entry: Buy when the price breaks above a key resistance level.
• Exit: Take profit at 2x risk, cut losses at a 1x risk.
• Risk Management: Risk only 1% of the account per trade.
A clear, structured plan removes emotion from trading and keeps you disciplined.
________________________________________
Step 5: Test Your Strategy (Before Risking Real Money)
You never know if a strategy works until you test it.
How to Test a Trading Strategy:
🔹 Backtesting – Analyze past data to see if the strategy has worked historically.
🔹 Forward Testing (Paper Trading) – Trade in a demo account without real money.
What You’ll Learn from Testing:
✔️ Does the strategy make money over time?
✔️ How often does it win vs. lose?
✔️ How big are the drawdowns?
✔️ Does it match your risk tolerance?
If the strategy performs well in testing, you now have a solid foundation to trade with real money.
If it doesn’t work, tweak and improve it—this is part of the process.
________________________________________
Final Thoughts: The Key to Long-Term Success
Starting over isn’t about finding the “perfect” system —it’s about following a structured approach.
Here’s the Path to Trading Success:
1️⃣ Master Risk Management – Protect your capital first.
2️⃣ Learn & Explore – Understand different strategies & tools.
3️⃣ Pick ONE Strategy – Focus on a proven method.
4️⃣ Create a Trading Plan – Define your rules clearly.
5️⃣ Test & Improve – Validate your strategy before going live.
🔥 Bonus Tip: Trading success is 80% psychology and 20% strategy. Stay patient, disciplined, and treat trading like a business—not a get-rich-quick scheme.

BUY GBPUSDGBPUSD looking to take off from this support towards 1,31. This is confirmed with a bullish flag pattern and and an invers head and shoulder pattern. Entry would be around 1,29077

GBPUSD Expected Growth! BUY!
My dear followers,
I analysed this chart on GBPUSD and concluded the following:
The market is trading on 1.2904 pivot level.
Bias - Bullish
Technical Indicators: Both Super Trend & Pivot HL indicate a highly probable Bullish continuation.
Target - 1.2929
About Used Indicators:
A super-trend indicator is plotted on either above or below the closing price to signal a buy or sell. The indicator changes color, based on whether or not you should be buying. If the super-trend indicator moves below the closing price, the indicator turns green, and it signals an entry point or points to buy.
Disclosure: I am part of Trade Nation's Influencer program and receive a monthly fee for using their TradingView charts in my analysis.
———————————
WISH YOU ALL LUCK

GBP/USD 1-Hour Chart Analysis: Bearish Setup with Key ResistanceGBP/USD 1-Hour Chart Analysis: Bearish Setup with Key Levels
Key Technical Indicators:
Current Price: $1.29427
30 EMA (Red Line): $1.29453 (Short-term trend)
200 EMA (Blue Line): $1.29351 (Long-term trend)
Key Resistance Zone: $1.29663 - $1.29851 (shaded purple)
Support & Target Levels:
TP 1: $1.29358
TP 2: $1.29153
TP 3: $1.28895
Final Target: $1.28662
Analysis:
Trend:
The price is struggling around the 30 EMA and 200 EMA, showing indecision.
The shaded resistance zone ($1.29663 - $1.29851) is a key area where sellers may take control.
Trade Setup:
Entry: Expected near $1.29663 (potential rejection from resistance).
Stop Loss: Above $1.29851 (to minimize risk if price breaks higher).
Take Profit Targets: Multiple levels, with the final target at $1.28662.
Bearish Confirmation:
If price gets rejected at resistance, a downside move toward support levels is likely.
A break below 1.29358 could accelerate selling pressure.
Conclusion:
The chart suggests a potential bearish trade setup, with resistance acting as a key rejection point.
Watch for confirmation signals at the resistance zone before entering a short trade.
A break above $1.29851 would invalidate the bearish outlook.

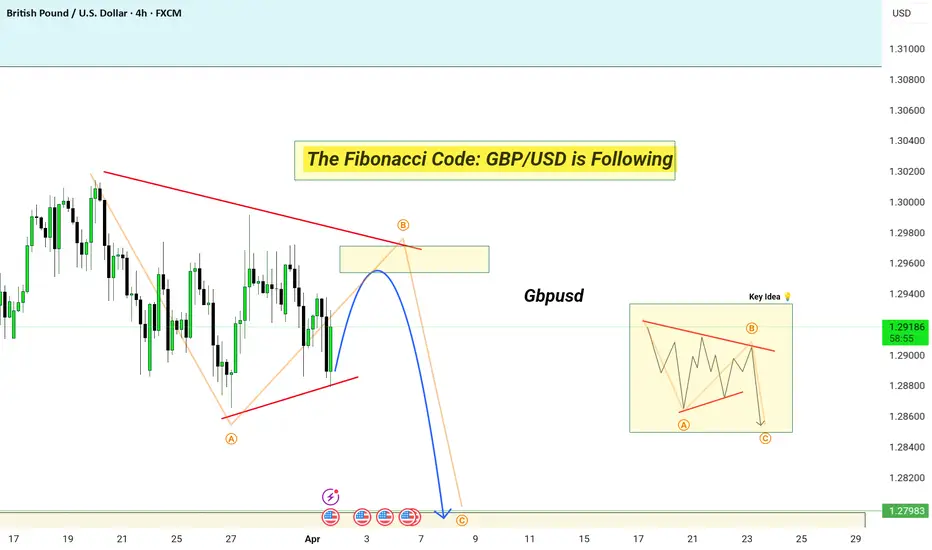
The Fibonacci Code: GBP/USD is FollowingGBP/USD Elliott Wave Analysis: Bearish Setup Unfolding
In this 4-hour GBP/USD chart, we can see a classic Elliott Wave correction pattern forming. Price action is currently moving within a contracting triangle structure, with wave A and B shaping the market’s corrective movement before a potential impulsive wave C decline.
Key Observations:
✅ Wave Structure: The price is completing a wave B retracement into a key resistance area (yellow box), aligning with a supply zone.
✅ Converging Trendlines: A descending triangle is forming, confirming potential exhaustion in bullish momentum.
✅ Projected Move: If the pattern follows Elliott Wave principles, we anticipate a rejection from wave B’s peak, leading to a strong downward move toward the 1.2798 supply zone.
✅ Market Confluence: The confluence of resistance, supply zones, and wave structure increases the probability of a short setup.
📉 Trading Idea: If price reacts strongly from the marked resistance, a short position with a target near 1.2798 could offer a high-probability trade opportunity.
Let me know your thoughts! Are you seeing the same setup? 🔥📊
GBPUSD is in the Selling DirectionHello Traders
In This Chart GBPUSD HOURLY Forex Forecast By FOREX PLANET
today GBPUSD analysis 👆
🟢This Chart includes_ (GBPUSD market update)
🟢What is The Next Opportunity on GBPUSD Market
🟢how to Enter to the Valid Entry With Assurance Profit
This CHART is For Trader's that Want to Improve Their Technical Analysis Skills and Their Trading By Understanding How To Analyze The Market Using Multiple Timeframes and Understanding The Bigger Picture on the Charts

Potential evening star pattern near a resistance level at 1.295In the 1H timeframe, we observe a bearish trend where prices have consistently failed to break above previous highs. The recent price action shows a potential evening star pattern near a resistance level at 1.29500. The EMA confirms downward momentum, and the ATR indicates volatility has been tightening, suggesting a possible breakout. Given the RSi is hovering at 40, it shows bearish momentum building up. Thus, entering at 1.28970, with a stop loss set at 1.29600 (just above recent swings) and a take profit target at 1.28000 aligns with a good risk-reward ratio.

Bearish opportunity on GUPrice respected a powerful supply area this week after being consolidated throughout the previous week. After this BOS, we can expect price to keep heading to the downside according to the bearish structure; however nothing is guarantee in trading. Proper risk management is always a must!!!

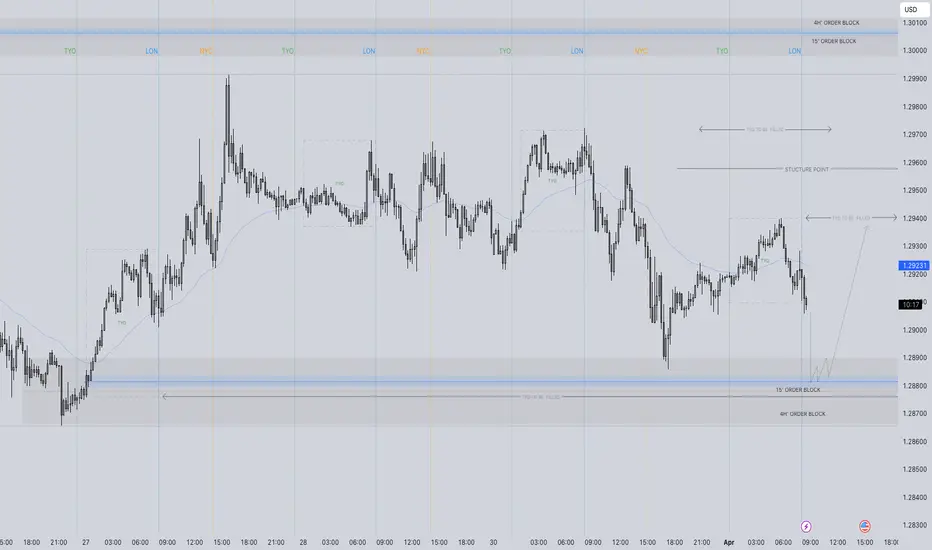
gbpusdBelow is a step-by-step analysis of the GBP/USD chart you shared, applying the integrated strategy (Markttechnik structure, Heiken Ashi confirmation, liquidity sweeps, and inducement).
---
1. Higher-Time-Frame Context (If Available)
Although the screenshot only shows a 15-minute (M15) view, the Markttechnik approach typically begins by checking a higher time frame (H1, H4, or Daily) to confirm the overall trend. Without that info, well focus on the visible structure in your screenshot and assume a relatively range-bound or chopn M15
From the screenshot, there are several labeled swing points (Point 1, Point 2, Point 3), indicating how price is moving between support and resistance levels:
1. Upward Swings to ~1.299
Price seems to push into the 1.299 - 1.3000 zone multiple times, forming potential liquidity above these highs.
2. Downward Swings to ~1.289 - 1.290
Each time price drops, it finds some support around 1.290, suggesting liquidity pockets or demand near that level.
Overall, the chart looks like its oscillating between these swing highs and lows, creating a short-term range.
---
3. Heiken Ashi Candle Clues
Heiken Ashi candles can smooth out noise:
Bullish Phase: Consecutive green candles heading toward 1.299.
Bearish Phase: Consecutive red candles after failing to break above 1.299 convincingly.
From the screenshot, the most recent move seems bearish (red Heiken Ashi candles) after the pair failed to hold above 1.2951.296.
---
4. Liquidity and Inducement Analysis
1. Liquidity Above 1.299
Those highs near 1.2991.3000 represent a potential liquidity pool. Each time price approaches this area, sellers stop-losses (and buyer breakout orders) may cluster above.
2. Liquidity Below 1.290
Price has revisited ~1.2891.290. Any move below this area could trigger stops from buyers, offering a sweep scenario if price dips and reverses.
3. Inducement / False Breakouts
Notice the wicks or brief pushes above ~1.299 that fail to continue higher. This can be an inducement to trap buyers expecting a breakout. After failing to push higher, price reverses and drops quickly.
---
5. Potential Trade Ideas
Scenario A: Short After Liquidity Sweep Above 1.299
1. Setup
Price attempts to break 1.299, forms a final push (liquidity grab), then produces a red Heiken Ashi candle that closes back below 1.299.
2. Entry
Once a strong bearish Heiken Ashi candle closes below the high, indicating a false breakout, enter a short position.
3. Stop Loss
Above the recent liquidity sweep (slightly above 1.3000).
4. Take Profit
At or near the 1.290 support area (or even lower if you see momentum).
Scenario B: Long After Liquidity Sweep Below 1.290
1. Setup
If price breaks below ~1.290, you watch for a false breakdown. A quick rejection with a strong bullish Heiken Ashi close back above 1.290 can signal the sweep is complete.
2. Entry
Go long when a bullish Heiken Ashi candle confirms a rebound above the liquidity zone.
3. Stop Loss
Below the recent low (slightly under 1.289 or the lowest wick).
4. Take Profit
Near the 1.299 resistance or previous swing highs for a 2:1 (or better) reward-to-risk ratio.
---
6. Markttechnik Point 1, 2, 3 Perspective
Based on your labeling:
Point 1 / Point 2 / Point 3 could mark successive swings (higher highs or lower highs/lows).
Each Point 3 might be where the market turns after failing to break a prior level, or it could be your next decision zone.
In a ranging environment, these points help you see the oscillation between support (demand) and resistance (supply). A trade signal would trigger when the market sweeps one of these points and then clearly reverses.
---
7. Putting It All Together
1. Identify Key Zones
1.290 (support & liquidity)
1.2991.300 (resistance & liquidity)
2. Look for Sweeps
Watch for price to poke above/below these zones and then close back inside.
3. Heiken Ashi Confirmation
Enter on a Heiken Ashi candle that confirms the reversal. Consecutive red for short, consecutive green for long.
4. Risk Management
Stops outside the liquidity sweep, targets at least 2:1.
5. Execution
Given the current screenshot, the market recently turned down from near 1.2951.296. You could wait to see if it sweeps below 1.290 for a potential buy, or if it returns to ~1.299 for a potential sell.
---
Conclusion
Short-Term Bias: Slightly bearish after failing to break above 1.2961.299.
Potential Long Setup: If price dips below 1.290 and quickly reverses (false breakdown).
Potential Short Setup: If price rallies again to 1.2991.300 and fails (false breakout).
By monitoring liquidity sweeps around these key zones and confirming direction with Heiken Ashi candles, you can apply your combined strategy for entries, stops, and profit targets.
