GBPUSD Bullish breakout retestThe GBPUSD currency pair price action sentiment appears bullish, supported by the prevailing uptrend. The recent intraday price action appears to be a sideways consolidation towards the previous resistance.
The key trading level is at 1.2940 level, the previous consolidation price range. A corrective pullback from the current levels and a bullish bounce back from the 1.2940 level could target the upside resistance at 1.2994 followed by the 1.3070 and 1.3123 levels over the longer timeframe.
Alternatively, a confirmed loss of the 1.2940 support and a daily close below that level would negate the bullish outlook opening the way for a further retracement and a retest of 1.2866 support level followed by 1.2813 and 1.2740.
This communication is for informational purposes only and should not be viewed as any form of recommendation as to a particular course of action or as investment advice. It is not intended as an offer or solicitation for the purchase or sale of any financial instrument or as an official confirmation of any transaction. Opinions, estimates and assumptions expressed herein are made as of the date of this communication and are subject to change without notice. This communication has been prepared based upon information, including market prices, data and other information, believed to be reliable; however, Trade Nation does not warrant its completeness or accuracy. All market prices and market data contained in or attached to this communication are indicative and subject to change without notice.
GBPUSD.P trade ideas
The Day Ahead Key Economic Data & Events – March 31
US: Chicago PMI, Dallas Fed manufacturing index
China: Official PMIs (Manufacturing & Services)
UK: Lloyds Business Barometer, Consumer Credit, M4 (Money Supply)
Japan: Industrial Production, Retail Sales, Housing Starts
Germany: CPI, Retail Sales, Import Prices
Italy: CPI
Central Banks: ECB’s Panetta & Villeroy speak
Relevance to Trading:
US, China, and Germany data impact equities, bonds, and FX (USD, CNY, EUR).
Inflation data (CPI) from Germany & Italy could influence ECB policy expectations.
PMI & industrial production data provide insights into global economic health.
ECB speakers may signal policy direction, affecting EUR volatility.
Weekly Analysis of GBP/USD: Neutral Outlook Amid Key Eco EventsThe GBP/USD currency pair has experienced range-bound trading following a correction from four-month highs against the US Dollar (USD). With a neutral bias, the coming week’s price movement will be heavily influenced by macroeconomic data releases and geopolitical developments, particularly Trump’s tariff policies and the US Nonfarm Payrolls (NFP) data.
Market Dynamics and Key Factors Impacting GBP/USD
US Tariffs and Their Impact on GBP/USD
President Donald Trump’s reciprocal tariffs, set to take effect on April 2, will be a crucial driver for the USD. If the tariff list is narrowed, it could ease concerns over economic slowdown, strengthening the USD and putting downward pressure on GBP/USD. Conversely, stronger-than-expected trade restrictions could increase risk aversion, potentially benefiting the Pound Sterling as a safer alternative in global trade.
UK Inflation and Bank of England Rate Expectations
The UK Consumer Price Index (CPI) data for February showed inflation at 2.8% YoY, slightly below the expected 2.9%. This lower inflation figure increased speculation that the Bank of England (BoE) may cut interest rates in May, weakening GBP.
However, UK Retail Sales data for February surged by 1%, well above the expected -0.3% decline, indicating resilient consumer demand. This could counterbalance bearish sentiment and support GBP/USD in the near term.
US Economic Data and Federal Reserve Policy Outlook
The US economy remains a key influence on GBP/USD. Key economic releases this week include:
Tuesday: ISM Manufacturing PMI and JOLTS Job Openings
Wednesday: ADP Employment Change Report
Thursday: Weekly Jobless Claims & ISM Services PMI
Friday: US Nonfarm Payrolls (NFP), which could determine Fed rate expectations
Fed officials, including Raphael Bostic, have pushed back on multiple rate cuts, stating that he only sees one rate cut in 2025. This stance has helped the USD remain resilient, preventing GBP/USD from breaking above the 1.3000 resistance level.
Technical Outlook: GBP/USD Remains in a Bullish Setup
The daily chart suggests that GBP/USD maintains a bullish bias, with key indicators showing positive momentum:
The 14-day RSI remains near 60, indicating continued buying pressure.
GBP/USD is trading above its 21-day Simple Moving Average (SMA) at 1.2903, acting as initial support.
Key upside targets
3000 psychological level (must close above for sustained gains)
1.3048 (November 6, 2024 high)
1.3150–1.3200 resistance zone
1.3300 round figure (longer-term target)
Key downside levels
1.2903 (21-day SMA) – immediate support
1.2804 (200-day SMA) – major downside risk
1.2667 (50-day SMA) and 1.2614 (100-day SMA) – potential bearish targets if selling pressure increases
A sustained break above 1.3000 could lead to further bullish momentum, while failure to hold above 1.2903 could trigger a deeper pullback.
Outlook: Neutral Bias With Key Data Driving Volatility
Given the mix of bullish technical indicators and uncertain fundamentals, the GBP/USD outlook remains neutral. Trump’s tariffs and US employment data will be the primary catalysts for movement. Traders should closely monitor macroeconomic developments, particularly NFP numbers and any surprises from the Federal Reserve or the Bank of England.
If US data beats expectations, the USD may strengthen, pushing GBP/USD below 1.2900.
If the UK economy shows resilience and the BoE remains cautious on rate cuts, GBP/USD may retest 1.3000 and beyond.
Expect higher volatility this week as markets digest economic data and geopolitical developments.
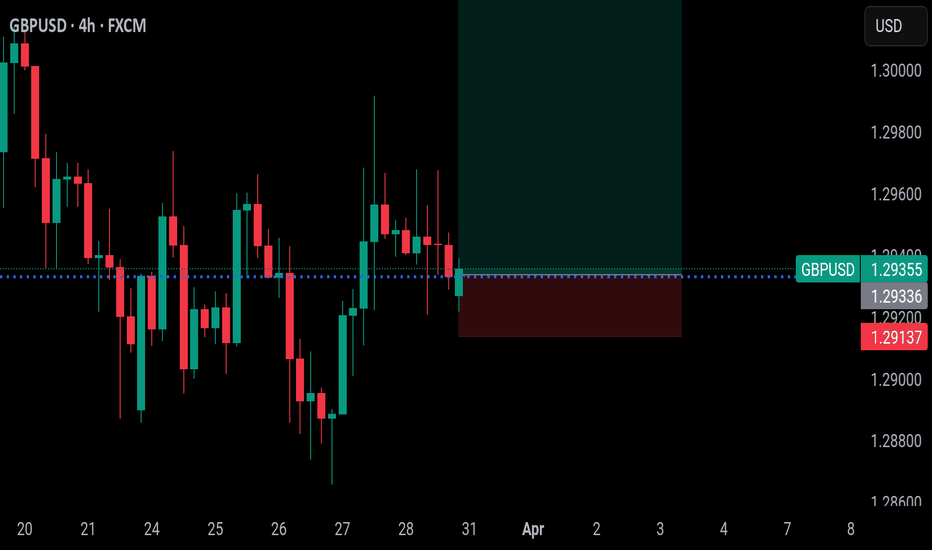
GBP/USD Trade Setup: Targeting Wave 5 Extension to 1.3292Hey traders! GBP/USD is showing a beautiful impulsive structure, and it looks like we’re in the early stages of Wave 5. Based on the current Elliott Wave count, we have a clear setup with defined risk and a compelling reward.
Setup Breakdown:
Wave 1 and Wave 3 have completed.
Price is now pushing out of a consolidation that likely marks Wave 4.
The projected target for Wave 5, based on the 5 vs 1+3 Fibonacci extension, is sitting at 1.3292.
Trade Idea:
Entry: Current price (around 1.2907–1.2942 range).
Stop Loss: Below the previous Wave 4 low (a safe invalidation level).
Take Profit: 1.3292 (61.8% extension of Wave 1 + Wave 3).
Why This Trade Makes Sense:
Elliott Wave structure is clean and impulsive.
Alternation is respected: Wave 2 and Wave 4 differ in form.
Fib extension confluence adds extra conviction.
Defined entry and stop make risk management straightforward.
Risk Management Tip:
Always risk only a small percentage of your account—structure the position size so your stop loss aligns with your risk tolerance.
If price starts pushing impulsively, especially with higher volume, that could be the confirmation that Wave 5 is in motion.
Stay sharp, manage your risk, and let the waves guide your trade!
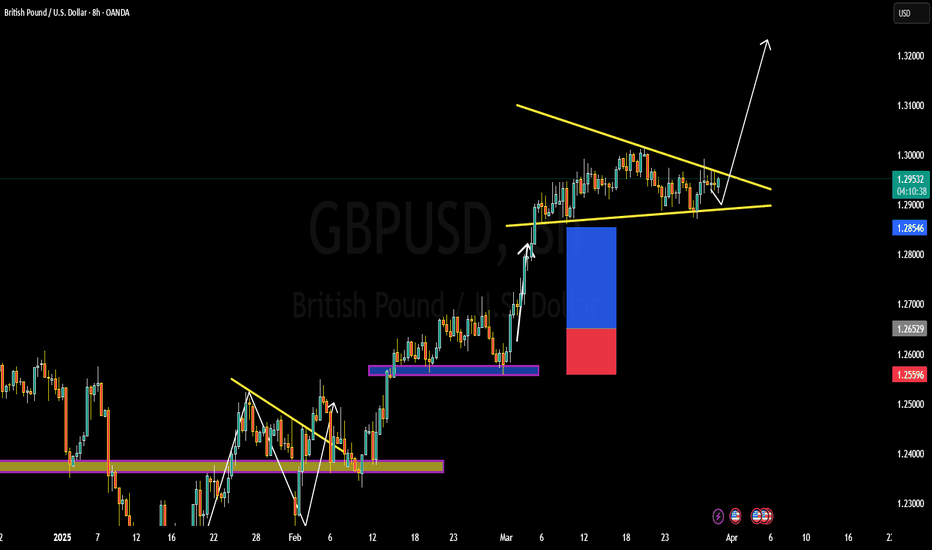
WHY GBPUSD BULLISH ?? DETAILED TECHNICAL AND FUNDAMENTALSThe GBP/USD currency pair is currently trading around 1.2950, exhibiting a bullish pennant pattern—a continuation signal that often precedes further upward movement. This pattern forms after a strong price surge, followed by a consolidation phase marked by converging trendlines. A breakout above the pennant's upper boundary could propel the pair toward the target price of 1.3100, indicating a potential gain of 150 pips.
Fundamentally, the British pound has demonstrated resilience, bolstered by the UK's robust economic performance and the Bank of England's measured approach to interest rate adjustments. Recent data indicates that the UK economy has maintained steady growth, with inflation rates aligning closely with the central bank's targets. Conversely, the US dollar has experienced fluctuations due to mixed economic indicators and evolving monetary policy expectations from the Federal Reserve. These dynamics contribute to the supportive environment for the pound against the dollar.
Technical analysis reinforces the bullish outlook for GBP/USD. The pair has been trading above key moving averages, with oscillators indicating strong upward momentum. The formation of the bullish pennant suggests a continuation of the prevailing uptrend. Key resistance levels to monitor include 1.3000 and 1.3040, with a sustained break above these points potentially paving the way toward the 1.3100 target. Additionally, the Relative Strength Index (RSI) remains in bullish territory, suggesting that the current uptrend has room to continue.
Traders should monitor key resistance levels closely, as a confirmed breakout could present a lucrative opportunity to capitalize on the anticipated movement. Implementing robust risk management strategies, such as setting appropriate stop-loss orders, is essential to navigate potential market volatility. Staying informed about upcoming economic data releases and central bank communications will also be crucial in effectively capitalizing on this trading opportunity.
GBPUSD Be bullishWhen the GBPUSD pair executes a definitive breach of the 1.30000 resistance ceiling — a level of both psychological and technical significance — it is poised to precipitate a substantial influx of bullish sentiment. This event not only satisfies key technical prerequisites for an upward price trajectory but also catalyzes a profound shift in market sentiment.
Consequentially, diverse market participants, ranging from institutional hedge funds to high - volume forex dealers and astute retail investors, will be drawn to the market, precipitating a marked upswing in trading volumes. The resultant robust buying momentum is forecast to drive the formation of a pronounced uptrend, propelling the pair to appreciably higher price levels.
From a forward - looking perspective, resistance levels at 1.31400 and 1.32100 are likely demarcated by prior price action, Fibonacci retracement ratios, or psychologically significant thresholds. As the pair gravitates towards these levels, short - term traders who previously established short positions at higher price points will likely execute mass short - covering, inundating the market with selling pressure.
Simultaneously, long - term bulls seeking to realize profits will contribute to the selling pressure, further exacerbating the downward - leaning market dynamics. These converging forces may well impede the pair’s upward progression and potentially instigate a short - term price correction.
Should the GBPUSD pair fail to surmount the 1.30000 resistance hurdle and commence a retracement, the 1.28800 level — identified as a zone of prior price congestion or corroborated by key technical indicators — is anticipated to attract value - seeking buyers. The influx of buying interest at this level may effectively arrest the downward momentum.
Deeper into the price spectrum, the 1.27000 level, which aligns with major moving averages or critical trendlines, functions as a pivotal line of defense. Given its status as a widely recognized strong support zone, a substantial influx of buying pressure is likely to materialize as the price approaches this level, thereby forestalling a more significant price decline and fostering market stability.
💎💎💎 GBPUSD 💎💎💎
🎁 Buy@1.28800 - 1.29000
🎁 TP 1.30000 - 1.31400
The market has been extremely volatile lately. If you can't figure out the market's direction, you'll only be a cash dispenser for others. If you also want to succeed,Follow the link below to get my daily strategy updates
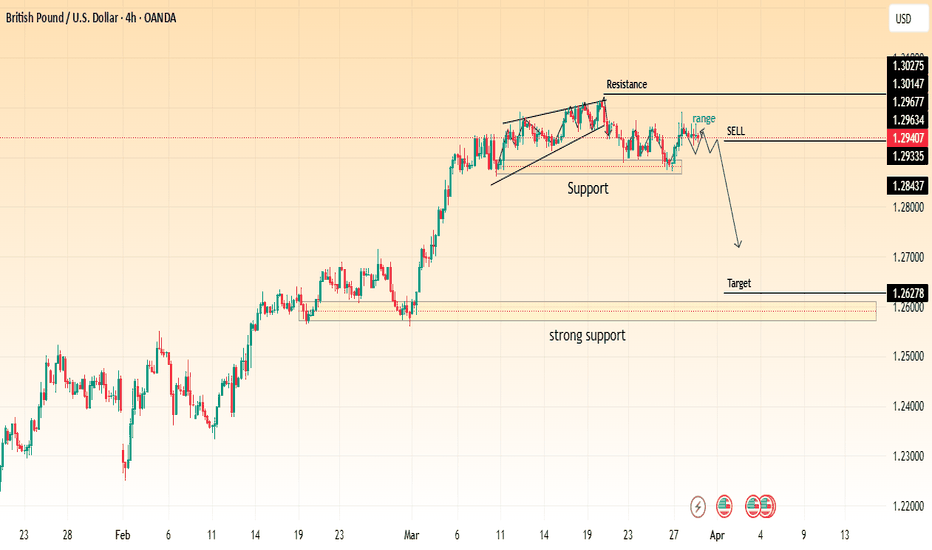
GBP/USD Breakdown: Bearish Setup with Sell Opportunity!"Key Observations:
Rising Wedge Breakdown:
The price initially formed a rising wedge near resistance.
The wedge broke down, indicating bearish momentum.
Support and Resistance Levels:
Resistance Zone: Around 1.3014 – 1.3027, marking a strong rejection area.
Support Zone: Around 1.2933 – 1.2843, where price previously bounced.
Strong Support: Around 1.2627, marked as the target area for a bearish move.
Bearish Setup:
A range-bound consolidation occurred after the breakdown.
The chart marks a sell signal, suggesting a move toward the 1.2627 target zone.
Trading Idea:
Entry: Sell after confirmation below 1.2933.
Target: 1.2627 (major support level).
Stop-Loss: Above 1.3014 (resistance level).
This setup suggests a potential bearish continuation, with price expected to decline further if support breaks. Always confirm with volume and market conditions before entering a trade.


