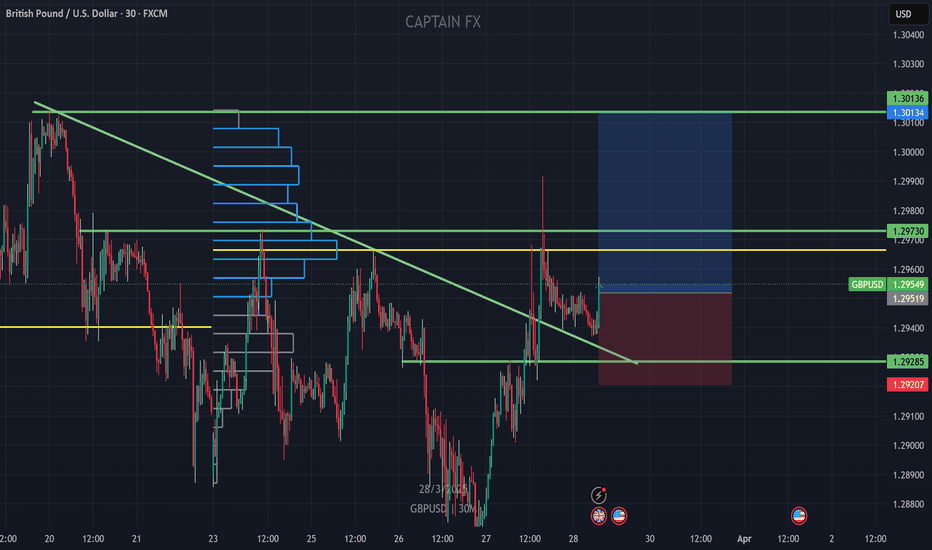
GBPUSD.P trade ideas
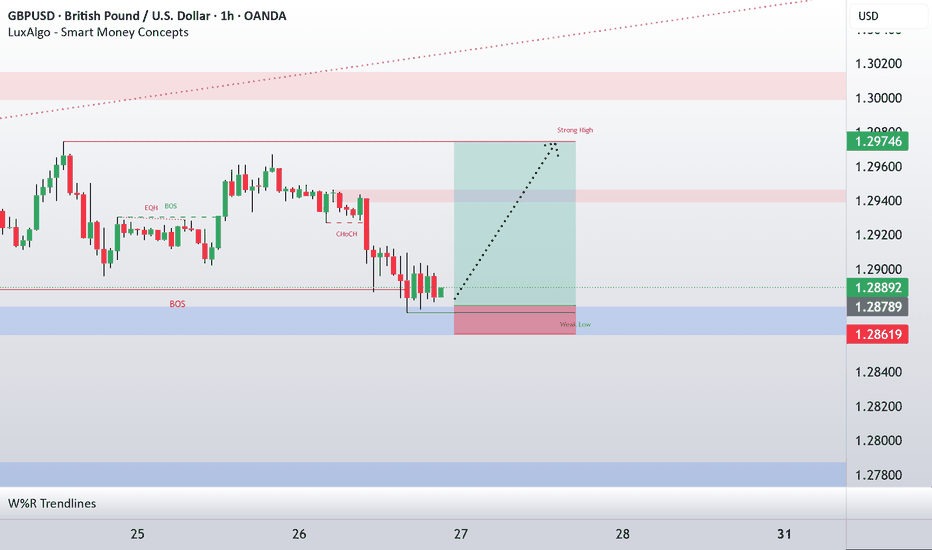
GBP/USD Longs from 1.28900 back up to 1.30000I’m looking for long opportunities around the 5-hour demand zone, aiming to take price back up to the 6-hour supply zone, where I will then look for potential sell setups.
Since price is currently positioned between these key levels, I will wait to see where it starts to slow down and how it reacts. Ideally, I want to see accumulation in the demand zone and distribution in the supply zone before making any decisions. However, overall, my bias for GU remains bullish, especially as the U.S. dollar continues to weaken.
Confluences for GU Buys:
- A clear 5-hour demand zone presents a potential buying opportunity.
- Liquidity remains to the upside, which price may target before a reversal.
- DXY has shifted bearish, indicating a potential bullish move for GBP/USD.
- Price has been consistently bullish on the higher timeframe over the past few weeks.
Note: If price breaks below the nearby demand zone, I will expect a temporary bearish trend to form.
#GBPUSD: Risk Entry Vs Safe Entry, Which One Would You Chose? The GBPUSD currency pair presents two promising opportunities for entry, potentially generating gains exceeding 500 pips. However, entering these markets carries a substantial risk of stop-loss hunting during the commencement of the week. Conversely, adopting a safe entry strategy offers a favourable chance for a bullish position.
We encourage you to share your thoughts and feedback on our ideas. ❤️🚀
Team Setupsfx_
GBPUSD:The strategy for next week remains bullishOn Friday, the GBP/USD traded and stopped at 1.2943, hovering near the upper end of the recent trading range. The currency pair has regained the ground above the 50-day Exponential Moving Average (EMA) at 1.2933, and currently, this level serves as an intraday support level, while the 200-day EMA at 1.2896 continues to underpin the broader momentum. The price movement is approaching the resistance zone of 1.2973 to 1.3008, which has restricted multiple rebound attempts this month. Breaking through this level may reach 1.3014. On the downside, the pivot point at 1.2937 and 1.2903 remain key levels worthy of attention. The short-term structure is constructive, but the bulls need a clear breakout to confirm the continuation of the trend beyond the resistance of the downward trend line.
Trading strategy:
buy@1.2910
TP:1.2970-1.2990
Get daily trading signals that ensure continuous profits! With an astonishing 90% accuracy rate, I'm the record - holder of an 800% monthly return. Click the link below the article to obtain accurate signals now!
GBPUSD Dusting 350+ PIPS in Choppy Waters - Breakout is Brewing?Technical / Chart Analysis:
Double Top Formation: The chart clearly exhibits a potential double top pattern around the 1.30564 resistance level. This is a bearish reversal pattern that suggests a potential trend change from bullish to bearish.
Breakdown of Uptrend: The preceding price action shows an uptrend, which has now been halted by the double top.
Key Support Level: The most crucial level to watch is the support around 1.28642. A confirmed break below this level would validate the double top pattern and signal a potential strong move downwards.
Monthly Performance: January saw a +180 pip move, followed by February with a +230 pip gain. This demonstrates the potential for significant profits in GBPUSD through swing trading.
Swing Analysis: February's +230 pip move consisted of 3 upward swings and 2 downward swings, highlighting the importance of capturing both upward and downward momentum in this pair due to the Choppy Price Action.
Conclusion:
FX:GBPUSD is at a critical juncture. The potential double top formation suggests a bearish bias, but confirmation is needed. Traders should closely monitor the key support level at 1.28642 for a potential breakdown and look for LONG Trades on breaking key levels to the Upside
What are your thoughts on GBPUSD's potential for swing trading? Do you see a breakdown or a bounce? Share your analysis and comments below!
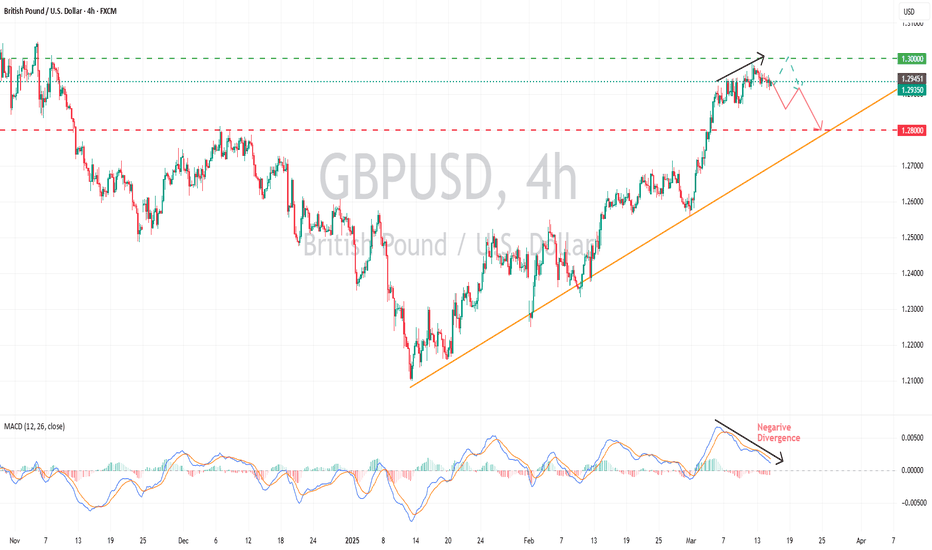
GBPUSD | APRIL 2025 FORECAST | Chopping Block is Hot!GBP/USD is approaching the psychological 1.3000 level, a key battleground for bulls and bears. The pair has been trading within a rising channel, but recent price action suggests momentum could be shifting.
🔹 Trend & Structure: GBP/USD remains in a broader uptrend but is struggling to maintain bullish momentum above 1.3000. A confirmed break could signal continuation, while rejection may trigger a retracement toward 1.2800-1.2750.
🔹 Technical Outlook:
Support Levels: 1.2850, 1.2750
Resistance Levels: 1.3050, 1.3150
Indicators: RSI hovers near 65, signaling slight overextension; MACD shows bullish momentum but weakening.
🔹 Fundamental Factors:
BOE policy expectations vs. Fed’s stance on rate cuts.
US & UK economic data—watch CPI and employment figures.
If GBP/USD clears and holds above 1.3000, it could open doors for a rally toward 1.3150. But if sellers defend this level, we might see a pullback toward 1.2850-1.2750 before the next move.
Will 1.3000 hold, or is a reversal on the horizon? Drop your predictions below! 📉📈 #GBPUSD #ForexTrading #MarketAnalysis
GBPUSD: Channel Up still intact but keep an eye on the 4H MA200.GBPUSD is bullish on its 1D technical outlook (RSI = 59.951, MACD = 0.008, ADX = 32.444) as the dominant pattern remains a Channel Up and despite the consolidation in recent days, the market remains supported over the 4H MA200. If it crosses over the LH trendline, go long in a similar manner as the Feb 13th break out and aim for the 2.382 Fibonacci extension (TP = 1.3200). If on the other hand the price fails and crosses under the 4H MA200, go short and aim for the S1 level (TP = 1.2555).
## If you like our free content follow our profile to get more daily ideas. ##
## Comments and likes are greatly appreciated. ##
GBPUSD: Bearish Continuation is Highly Probable! Here is Why:
The charts are full of distraction, disturbance and are a graveyard of fear and greed which shall not cloud our judgement on the current state of affairs in the GBPUSD pair price action which suggests a high likelihood of a coming move down.
Disclosure: I am part of Trade Nation's Influencer program and receive a monthly fee for using their TradingView charts in my analysis.
❤️ Please, support our work with like & comment! ❤️
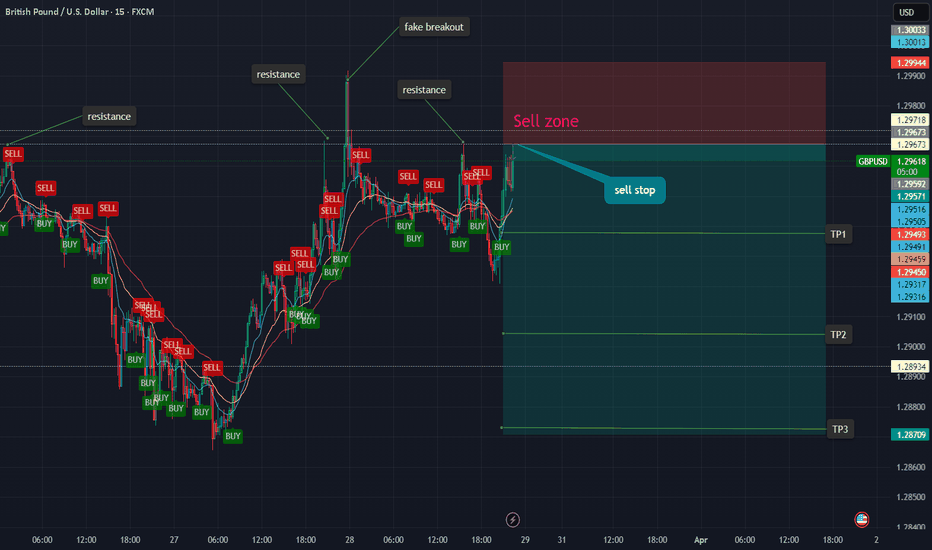
GBPUSD(20250328)Today's AnalysisToday's buy and sell boundaries: 1.2936
Support and resistance levels:
1.3057
1.3012
1.2983
1.2890
1.2861
1.2816
Trading strategy:
If the price breaks through 1.2983, consider buying, the first target price is 1.3012
If the price breaks through 1.2936, consider selling, the first target price is 1.2890
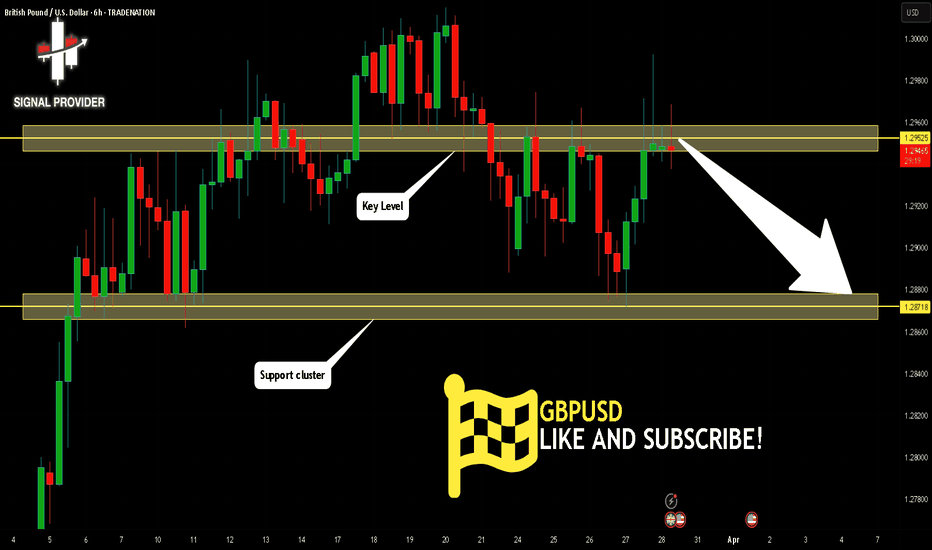
GBPUSD Will Go Down! Sell!
Please, check our technical outlook for GBPUSD.
Time Frame: 6h
Current Trend: Bearish
Sentiment: Overbought (based on 7-period RSI)
Forecast: Bearish
The price is testing a key resistance 1.295.
Taking into consideration the current market trend & overbought RSI, chances will be high to see a bearish movement to the downside at least to 1.287 level.
P.S
The term oversold refers to a condition where an asset has traded lower in price and has the potential for a price bounce.
Overbought refers to market scenarios where the instrument is traded considerably higher than its fair value. Overvaluation is caused by market sentiments when there is positive news.
Disclosure: I am part of Trade Nation's Influencer program and receive a monthly fee for using their TradingView charts in my analysis.
Like and subscribe and comment my ideas if you enjoy them!
Mister Y - GU - Friday - 28/03/25 Top down analysisAnalysis done directly on the chart
The easy access to brokers, makes it easy
for aspiring traders to hit buy and sell button.
That's why a lot of people entering in this industry
with high convictions think they will make a lot of
money in quick time. But it requires a lot of efforts
just like any other businesses and professions.
Treat trading as a business.
Not financial advice, DYOR.
Market Flow Strategy
Mister Y
GBP/USD BEARS ARE STRONG HERE|SHORT
Hello, Friends!
GBP/USD pair is in the uptrend because previous week’s candle is green, while the price is clearly rising on the 4H timeframe. And after the retest of the resistance line above I believe we will see a move down towards the target below at 1.291 because the pair overbought due to its proximity to the upper BB band and a bearish correction is likely.
Disclosure: I am part of Trade Nation's Influencer program and receive a monthly fee for using their TradingView charts in my analysis.
✅LIKE AND COMMENT MY IDEAS✅
What Are the Inner Circle Trading Concepts? What Are the Inner Circle Trading Concepts?
Inner Circle Trading (ICT) offers a sophisticated lens through which traders can view and interpret market movements, providing traders with insights that go beyond conventional technical analysis. This article explores key ICT concepts, aiming to equip traders with a thorough understanding of how these insights can be applied to enhance their trading decisions.
Introduction to the Inner Circle Trading Methodology
Inner Circle Trading (ICT) methodology is a sophisticated approach to financial markets that zeroes in on the behaviours of large institutional traders. Unlike conventional trading methods, ICT is not merely about recognising patterns in price movements but involves understanding the intentions behind those movements. It is part of the broader Smart Money Concept (SMC), which analyses how major players influence the market.
Key Inner Circle Trading Concepts
Within the ICT methodology, there are many concepts to learn. Below, we’ve explained the most fundamental ideas central to ICT trading.
Structure
Understanding the structure of a market is fundamental to effectively employing the ICT methodology. In the context of ICT, market structure is defined by the identification of trends through specific patterns of highs and lows.
Market Structure
A market trend is typically characterised by a series of higher highs and higher lows in an uptrend, or lower highs and lower lows in a downtrend. This sequential pattern provides a visual representation of market sentiment and momentum.
Importantly, market trends are fractal, replicating similar patterns at different scales or timeframes. For example, what appears as a bearish trend on a short timeframe might merely be a corrective phase within a larger bullish trend. By understanding this fractal nature, traders can better align their strategies with the prevailing trend at different trading intervals.
Break of Structure (BOS)
A Break of Structure occurs when there is a clear deviation from these established patterns of highs and lows. In an uptrend, a BOS is signalled by prices exceeding a previous high without falling below the most recent higher low, confirming the strength and continuation of the uptrend.
Conversely, in a downtrend, a BOS is indicated when prices drop below a previous low without breaching the prior lower high, signifying that the downtrend remains strong. Identifying a BOS gives traders valuable clues about the continuation of the current market direction.
Change of Character (CHoCH)
The Change of Character in a market happens when there is a noticeable alteration in the behaviour of price movements, suggesting a potential reversal of a given trend. This might be seen in an uptrend where the price fails to reach a new high and then breaks below a recent higher low, indicating that the buying momentum is waning and a bearish reversal is possible.
Identifying a CHoCH helps traders recognise when the market momentum is shifting, which is critical for adjusting positions to capitalise on or protect against a new trend.
Market Structure Shift (MSS)
A Market Structure Shift is a significant change in the market that can disrupt the existing trend. This specific type of CHoCH is typically marked by a price moving sharply (a displacement) through a key structural level, such as a higher low in an uptrend or a lower high in a downtrend.
These shifts can signal a profound change in market dynamics, with the sharp move often preceding a new sustained trend. Recognising an MSS allows traders to reevaluate their current bias and adapt to a new trend, given its clear signal.
Order Blocks
Order blocks are a central component of ICT trading, providing crucial insights into potential areas where the price may react strongly due to significant buy or sell interests from large market participants.
Regular Order Blocks
A regular order block is an area on the price chart representing a concentration of buying (demand zone) or selling (supply zone) activity.
In an uptrend, a bullish order block is identified during a downward price movement and marks the last area of selling before a substantial upward price movement occurs. Conversely, a bearish order block forms in an uptrend where the last buying action appears before a significant downward price shift.
In the ICT trading strategy, order blocks are seen as reversal areas. So, if the price revisits a bullish order block following a BOS higher, it’s assumed that the block will hold and prompt a reversal that produces a new higher high.
Breaker Blocks
Breaker blocks play a crucial role in identifying trend reversals. They are typically formed when the price makes a BOS before reversing and breaking beyond an order block that should hold if the established market structure is to be maintained. This formation indicates that liquidity has been taken.
For instance, in an uptrend, if the price creates a new high but then reverses below the previous higher low, the bullish order block above the low becomes a breaker block. A breaker block can be an area that prompts a reversal as the new trend unfolds; it’s a similar concept to support becoming resistance and vice versa.
Mitigation Blocks
Mitigation blocks are similar to breaker blocks, except they occur after a failure swing, where the price attempts but fails to surpass a previous peak in an uptrend or a previous trough in a downtrend. This pattern indicates a loss of momentum and potential reversal as the price fails to sustain its previous direction.
For example, in an uptrend, if the price makes a lower high and then breaks the structure by dropping below the previous low, the order block formed at the previous low becomes a mitigation block. These blocks are critical for traders because they’re also expected to produce a reversal if a new trend has been set in motion.
Liquidity
Liquidity refers to areas on the price chart with a high concentration of trading activity, typically marked by stop orders from retail traders.
Buy- and Sell-Side Liquidity
Buy-side liquidity is found where there is a likely accumulation of short-selling traders' stop orders, typically above recent highs. Conversely, sell-side liquidity is located below recent lows, where bullish traders' stop orders accumulate. When prices touch these areas, activating stop orders can cause a reversal, presenting a potential level of support or resistance.
Liquidity Grabs
A liquidity grab occurs when the price quickly spikes into these high-density order areas, triggering stops and then reversing direction. In ICT theory, this action is often orchestrated by larger players aiming to capitalise on the flurry of orders to execute their large-volume trades with minimal slippage. It's a strategic move that temporarily shifts price momentum, usually just long enough to trigger the stops before the market direction reverses.
Inducement
An inducement is a specific type of liquidity grab that triggers stops and entices other traders to enter the market. It often appears as a peak or trough, typically into an area of liquidity, in a minor counter-trend within the larger market trend. Inducements are designed by smart money to create an illusion of a trend change, prompting an influx of retail trading in the wrong direction. Once the retail traders have committed, the price swiftly reverses, aligning back with the original major trend.
Trending Movements
In the Inner Circle Trading methodology, two specific types of sharp trending movements signal significant shifts in market dynamics: fair value gaps and displacements.
Fair Value Gaps
A fair value gap (FVG) occurs when there is a noticeable absence of trading within a price range, typically represented by a swift and substantial price move without retracement. This gap often forms between the wicks of two adjacent candles where no trading has occurred, signifying a strong directional push.
Fair value gaps are important because they indicate areas on the chart where the price may return to "fill" the gap, usually before meeting an order block, offering potential trading opportunities as the market seeks to establish equilibrium.
Displacements
Displacements, also known as liquidity voids, are characterised by sudden, forceful price movements occurring between two chart levels and lacking the typical gradual trading activity observed in between. They are essentially amplified and more substantial versions of fair value gaps, often spanning multiple candles and FVGs, signalling a heightened imbalance between buy and sell orders.
Other Components
Beyond these ICT concepts, there are a few other niche components.
Kill Zones
Kill Zones refer to specific timeframes during the trading day when market activity significantly increases due to the opening or closing of major financial centres. These periods are crucial for traders as they often set the tone for price movements based on the increased volume and volatility:
Optimal Trade Entry
An optimal trade entry (OTE) is a type of Inner Circle trading strategy, found using Fibonacci retracement levels. After an inducement that prompts a displacement (leaving behind an FVG), traders use the Fibonacci retracement tool to pinpoint entry areas.
The first point is set at the major high or low that prompts the displacement, while the second point is set at the next significant swing high or low that forms. In a bearish movement, for example, the initial point is set at the swing high before the displacement and the subsequent point at the new swing low. Traders often look to the 61.8% to 78.6% retracement level for entries.
Balanced Price Range
A balanced price range is observed when two opposing displacements create FVGs in a short timeframe, indicating a broad zone of price consolidation. During this period, prices typically test both extremes, attempting to fill the gaps. This scenario offers traders potential zones for trend reversals as the price seeks to establish a new equilibrium, as well as key levels to watch for a breakout.
The Bottom Line
Understanding ICT concepts gives traders the tools to decode complex market signals and align their strategies with the influential trends shaped by the largest market participants. For those looking to apply these sophisticated trading techniques practically, opening an FXOpen account can be a great step towards engaging with the markets through a robust platform designed to support advanced trading strategies.
FAQs
What Are ICT Concepts in Trading?
ICT (Inner Circle Trading) concepts encompass a series of advanced trading principles that focus on replicating the strategies of large institutional players. These concepts include liquidity zones, order blocks, market structure shifts, and optimal trade entries, all aimed at understanding and anticipating significant market movements.
What Is ICT in Trading?
ICT in trading refers to the Inner Circle Trading methodology, a strategy developed to align smaller traders’ actions with those of more influential market participants. It utilises specific market phenomena, such as order blocks and liquidity patterns, to analyse price movements and improve trading outcomes.
What Is ICT Trading?
ICT trading is the application of concepts that seek to identify patterns and structures that indicate potential price changes driven by institutional activities, aiming to capitalise on these movements.
What Is ICT Strategy?
An ICT strategy combines market analysis techniques to identify where significant market players are likely to influence prices. This includes analysing price levels where large volumes of buy or sell orders are anticipated to occur and identifying key times when market moves are most likely.
Is ICT Better Than SMC?
Comparing ICT and SMC (Smart Money Concept) is challenging as ICT is essentially a subset of SMC. While SMC provides a broader overview of how institutional money influences the markets, ICT offers more specific techniques and terms like inducements and displacements. Whether one is better depends on the trader’s specific needs and alignment with these methodologies’ intricacies.
This article represents the opinion of the Companies operating under the FXOpen brand only. It is not to be construed as an offer, solicitation, or recommendation with respect to products and services provided by the Companies operating under the FXOpen brand, nor is it to be considered financial advice.

