"GBP/USD Wave 5 Completion | ABC Correction in ProgressFive-wave impulsive structure is complete.
Price rejected strongly in the red supply zone.
Correction phase (ABC) now unfolding.
Key Levels:
Wave A Support Zone: 1.3285
Wave C Target Zone: 1.2880
Expect a corrective pullback before potential bullish continuation.
Stay patient — corrections offer new opportunities!
#GBPUSD #ElliottWave #ForexAnalysis #TechnicalAnalysis
GBPUSD.P trade ideas

GBPUSD BUY NOW!!!!!!!!!GBPUSD took out the buyside liquidity with a retest to the fvg am looking forward to see price made a strong pull back up to the buy side am targeting 1.33600
JOIN AND ENJOY

Puah to Down trendThe AO indicator show lower of high and the price still show higher. Probably it will go down after get resistant. Now the price in area resistant of engulfing candle before .
Let' see what happen next

GBPUSD Short SellCan Sell half of the positions here and remaining half after retracement. I am expectecting fall down 1.3350-1.3330 area.

GBP/USD For Bearishwait for pull-back near by entry point and then go short
general trend is up trend
current phase is pull-back
have fun :)

GBP/USDHello, traders
Cable (GBP/USD) is falling towards an overlap support and could potentially bounce off this level to climb higher.
Buy entry is at 1.3200 which is an overlap support.
Stop loss is at 1.3110 which is a level that lies underneath an overlap support and the 38.2% Fibonacci retracement.
Take profit is at 1.3415 which is a multi-swing-high resistance.

GBP/USD | Quarterly Outlook Zooming out on the 3M chart, the structure speaks volumes.
After years of downward pressure, the pair found footing at a major low (2021), forming a rounded base. Now we’re seeing a potential macro shift in momentum with confluence from the 0.786 Fibonacci and price edging toward that psychological 1.42 zone.
📍 Previous high? Marked.
📍 Psychological resistance? Noted.
📍 Next checkpoint? 1.4250 retest.
Patience is power when you're analyzing legacy structure. Let the candles tell the story. 🔁
#GBPUSD #ForexMacroView #TechnicalAnalysis #PriceAction #QuarterlyChart #SmartMoneyPlay #TrendReversal

GBPUSD - End Of The Bullish Gravy Train?With a strong bullish rally throughout 2025, it is considered 'stupid' to bet against the trend. As the famous saying goes, 'the trend is your friend' and to a certain extent, it is true.
But during the time of bullish price action, there is a minor retracement that occurs that allow smart money to buy at a lower price and a scenario like this is most likely going to play out going into the next weeks trading as I am seeing weakness across the board with Dollar Index and EURUSD.
1.32340 is my 1st point of interest

GBPUSD Trade RecapFX:GBPUSD
Friday trade recap on GBPJPY.
📌 The rationale behind taking this trade was firstly, the positive GBP news for Retail Sales of actual 0.4%, greater than the -0.3% forecast.
📌 Secondly, the price tapped into the strong 4H demand zone, while also sweeping the Asian lows.
📌 The news took place on 6 am UTC, while there were no sudden spikes in price during 6 am, we can see a 30 pips price push few minutes after the news, signaling the market price reacting to the news.
📌 Price got rejected twice from the 15 minutes bearish shooting star, creating a strong short term resistance zone.
📌 Since the bias is short term bullish, I waited for a break and retest of the trendline, as soon as price failed to close below the zone, I immediately place buys.
📌 Price Eventually hit TP at a 1:2.46% risk to reward trade but closed at +1.9% to avoid the subsequent red news.
3min chart

GBPUSD Sell analysis/ideaIn the daily timeframe, my trend line hasn't been touched for a while, and the price has bounced off of a very strong key level. In the 4-hour timeframe, I have a very clear downtrend structure about to form, and my trendline is broken.
complete explanation in the video.

GBPUSD to retrace lowerGBPUSD is in a retracement right now after a rally to the upside.
It struggled to break out back to the upside yesterday and has been bearish today, breaking multiple short term lows.
The bias for me today is bearish but keep in mind we are in an uptrend in the higher timeframes.

GBPUSD SHORT FORECAST Q2 W18 D28 Y25GBPUSD SHORT FORECAST Q2 W18 D28 Y25
Professional Risk Managers👋
Welcome back to another FRGNT chart update📈
Diving into some Forex setups using predominantly higher time frame order blocks alongside confirmation breaks of structure.
Let’s see what price action is telling us today!
💡Here are some trade confluences📝
✅Weekly order block rejection
✅Daily order block rejection
✅Weekly imbalance to fill short
✅15’ order block
🔑 Remember, to participate in trading comes always with a degree of risk, therefore as professional risk managers it remains vital that we stick to our risk management plan as well as our trading strategies.
📈The rest, we leave to the balance of probabilities.
💡Fail to plan. Plan to fail.
🏆It has always been that simple.
❤️Good luck with your trading journey, I shall see you at the very top.
🎯Trade consistent, FRGNT X

GBPUSD to touch yesterday's highThe short term retracement is getting weaker, signaling a push to the upside soon. The first target would be last day's high around the 1.3332 area.
Price failed to break the last short term low.

GBPUSD | Uptrend after sidewaysGBPUSD witnessed a long sessions of correction and then went into sideways for some further sessions.Ultimately it came out of sideways and gave a breakout.While making healthy green hourly candles it formed a new higher high and afterwards defined its new higher low as well.It indicates that it is in bullish trend now.

GU-Fri-25/04/25 TDA-More consolidation incoming!Analysis done directly on the chart
Nothing is easy, people make it look simple
but you don't see when they struggled.
Be consistent in whatever you want to do,
Journal your progress so you can look back
and see how far you've come. A lot of times
we diminish our progress without fully realizing
how much we have improved. Everyone's journey
is different, try not to compare to others in a toxic
way. Peace.
Not financial advice, DYOR.
Market Flow Strategy
Mister Y

As the dollar's weak trend signals an endTrump's remarks and attitudes in trade negotiations have had a significant impact on the market 📈💥
His change in attitude towards the Federal Reserve Chairman first triggered investors' concerns about the Fed's policy, leading them to seek refuge in gold and causing the price of gold to rise 🏆🚀. Later, his remarks alleviated those concerns, prompting funds to flow back into dollar-denominated assets and causing the price of gold to decline from its peak levels 📉💔
In terms of trade negotiations, potential easing measures may reduce the demand for gold as a safe-haven asset ⏳
Taken together, these factors may imply that market confidence in the dollar has been somewhat restored 🌟. When signs of the end of the dollar's weak trend emerge 📊, more funds flow into dollar assets 💸. Against the backdrop of this change in the direction of capital flows, the GBPUSD has declined 😔
⚡⚡⚡ GBPUSD ⚡⚡⚡
🚀 Sell@1.32800 - 1.32600
🚀 TP 1.32200 - 1.32000
The market has been extremely volatile lately 📈📉 If you can't figure out the market's direction, you'll only be a cash dispenser for others 💰

GU-Wed-30/04/25 TDA-Lots of red news ahead, watch out!Analysis done directly on the chart
Sometimes we need to step back and
recharge ourself to continuously do
good and great.
Not financial advice, DYOR.
Market Flow Strategy
Mister Y

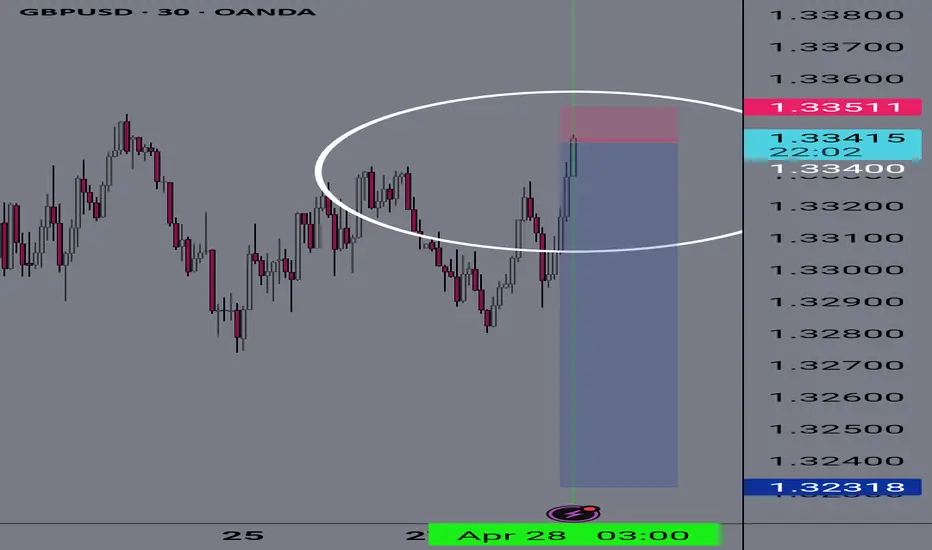
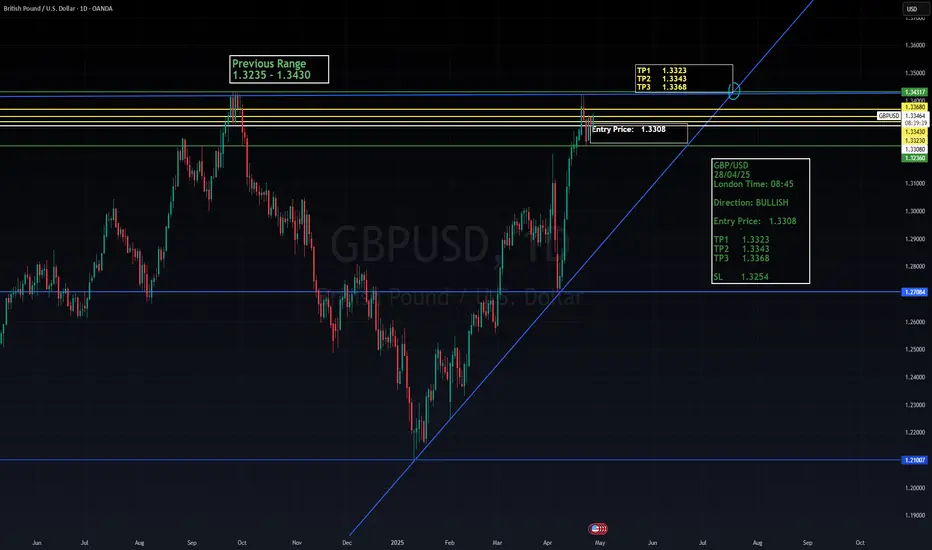
GBP/USD 28/4/25 - Signal PrepGBP/USD Trade Setup
- Bullish Signal We are anticipating bullish momentum on GBP/USD with the following levels in focus:
Entry Price: 1.3308
Take Profit Targets:
TP1: 1.3323
TP2: 1.3343
TP3: 1.3368
Stop Loss: 1.3254
This setup suggests a potential upside move as the pair shows signs of strength. Traders may look to enter around the specified entry point and scale out at the marked take profit levels, while maintaining a controlled risk with the stop loss in place. As always, manage your position size appropriately based on your trading plan.
Two possible reversal zones for GBPUSDGBPUSD has two liquidity pools resting under yesterday's low, that could trigger a breakout to the upside. It's also a red folder news day which would be a perfect opportunity for market makers to move the price.
Look out for reversal patterns (breaking of short-term highs, wicks to the downside).
We are in a strong uptrend in the higher timeframes so shorting is probably not a good idea.

GBP_USD SWING SHORT|
✅GBP_USD has retested a key resistance level around 1.3400
And as the pair is already making a bearish pullback
A move down to retest the demand level below at 1.3228 is likely
SHORT🔥
✅Like and subscribe to never miss a new idea!✅
Disclosure: I am part of Trade Nation's Influencer program and receive a monthly fee for using their TradingView charts in my analysis.

UK retail sales beat forecast, pound edges lowerThe British pound has edged lower on Friday. In the European session, GBP/USD is trading at 1.3214, down 0.17% on the day.
UK retail sales were a ray of sunshine in March. Monthly, retail sales rose 0.4%, beating the market estimate of -0.4% but below the revised 0.7% increase in February. Clothing sales showed strong growth as shoppers took advantage of the sunny weather.
Annualized, retail sales rose 2.6% from a revised 1.8% gain in February and above the market estimate of 1.8%. This was the strongest gain in three months.
The strong retail sales was a pleasant surprise but the consumer economy remains fragile. The GfK consumer confidence index deteriorated in April to -23 from -19 and below the market estimate of -22. This was the lowest level since November 2023.
Consumers are concerned over the rising cost of living and worsening global trade tensions which has been fuelled by President Trump's tariffs. The GfK survey found that consumers are anxious that inflation will continue to rise due to the US tariffs.
The Bank of England is following trade tensions carefully as well. On Thursday, Governor Andrew Bailey said that the BoE was "quite focused on the growth shock" for the UK from the tariffs, although he said the UK was not close to a recession. If the global trade war intensifies, it will weigh on UK growth but will also push inflation lower.
President Trump's tariff policy is expected to raise inflation and consumers are anxious that inflation will rise sharply. The UoM consumer inflation expectations index jumped to 6.7% in the initial April release, up from 5.0% in March. Today's final release is expected to confirm this figure, which would mark the highest level since Nov. 1981.

GBPUSD... 4H CHART PATTERNI am suggesting a **GBP/USD short (sell) position** from **1.3299**, targeting **1.3160**. Here's a quick breakdown of that idea from a technical and risk management perspective:
---
### 📊 **Trade Summary**
- **Pair**: GBP/USD
- **Position**: Sell
- **Entry**: 1.3299
- **Target**: 1.3160
- **Potential Profit**: 139 pips
---
### ⚠️ Key Considerations:
1. **Technical Analysis**:
- Are you basing this on a break of support, resistance rejection, or a larger trend (e.g., D1 or H4)?
- Any key indicators (RSI, MACD, moving averages) giving confirmation?
2. **Fundamentals**:
- Any upcoming UK or US economic data? (GDP, interest rate announcements, Fed or BoE speeches?)
- Market sentiment toward USD (safe haven) or GBP (risk currency)?
3. **Stop Loss**:
- Are you using one? Placing it above recent highs could protect you—e.g., SL at 1.3350 (risk of ~50 pips).
- Risk-to-reward ratio: approx. 1:2.8 (Good).
---
### 🛠 Example Trade Setup (MetaTrader Style)
| Type | Sell (Short) |
|------------|-------------------|
| Entry | 1.3299 |
| TP (Target)| 1.3160 |
| SL (Stop) | 1.3350 (example) |
| R:R | ~1:2.8 |
---
If you’re live trading this, be cautious of:
- **Volatility spikes** from news.
- **Support levels** near 1.3200 that could slow down the move.
- **Dollar strength/weakness** (watch the DXY).

RARE / 10R / Short....SGU @ 1.3340Rare but rewarding!
Just executed Short .... SGU @ 1.3340
💯 solid setup...watch this tank 📉
in engineering....we call this BUCKLE ;)
expecting min DD < 15p max RRR > 10
TP1 and SL as shown until final TP2 projected by system.
Sorry, alert is not based on TA like BoS or OB or SnR SnD PP or Fibs or even ICT etc....since designed to induce and seduce...rather based on multi-system confluence convergence and confirmations.... now system beeping let's test n see
IF u like this...would appreciate any feedback for continuous improvement...
🥂