Analysis of GBPUSD 4 - hour ChartAnalysis of GBPUSD 4H Chart
Trend Analysis
From the 4 - hour chart, GBPUSD is generally in an uptrend. The price fluctuations have formed a series of higher highs and higher lows, indicating that the bulls are in control 🐂.
Key Levels
Support Area: The range of 1.3200 - 1.3240 is clearly marked as an important support area in the chart. Previously, the price has rebounded near this area multiple times, suggesting that there is strong buying pressure in this area. If the price retraces to this area again, it may present a potential opportunity to go long 💰.
Target Area: 1.3420 is marked as the target area. If the price breaks through the current consolidation range and continues its upward trend, it is expected to move towards this target price level 🎯.
Trading Strategy
Long - position Strategy: When the price retraces to the 1.3200 - 1.3240 support area and a bullish candlestick pattern appears, one may consider entering a long position. Set the stop - loss just below the support area, and target the 1.3420 target area 📈.
⚡⚡⚡ GBPUSD ⚡⚡⚡
🚀 Buy@1.32000 - 1.32400
🚀 TP 1.33500 - 1.34000
Accurate signals are updated every day 📈 If you encounter any problems during trading, these signals can serve as your reliable guide 🧭 Feel free to refer to them! I sincerely hope they'll be of great help to you 🌟
GBPUSD.P trade ideas

GBPUSD sellPrice is at our selling zone and reacting bearishly which i expect a drop from this level.

GBPUSD SHORT FORECAST Q2 W18 D30 Y25GBPUSD SHORT FORECAST Q2 W18 D30 Y25
Professional Risk Managers👋
Welcome back to another FRGNT chart update📈
Diving into some Forex setups using predominantly higher time frame order blocks alongside confirmation breaks of structure.
Let’s see what price action is telling us today!
💡Here are some trade confluences📝
✅Weekly order block rejection
✅Daily order block rejection
✅Daily high rejection
✅Daily imbalance fill targets
🔑 Remember, to participate in trading comes always with a degree of risk, therefore as professional risk managers it remains vital that we stick to our risk management plan as well as our trading strategies.
📈The rest, we leave to the balance of probabilities.
💡Fail to plan. Plan to fail.
🏆It has always been that simple.
❤️Good luck with your trading journey, I shall see you at the very top.
🎯Trade consistent, FRGNT X


GBPUSD H4 | Bullish Continuation Based on the H4 chart analysis, the price is falling toward our buy entry level at 1.3210, a pullback support.
Our take profit is set at 1.3364 a pullback resistance.
The stop loss is placed at 1.3119, an overlap support.
High Risk Investment Warning
Trading Forex/CFDs on margin carries a high level of risk and may not be suitable for all investors. Leverage can work against you.
Stratos Markets Limited (tradu.com):
CFDs are complex instruments and come with a high risk of losing money rapidly due to leverage. 63% of retail investor accounts lose money when trading CFDs with this provider. You should consider whether you understand how CFDs work and whether you can afford to take the high risk of losing your money.
Stratos Europe Ltd (tradu.com):
CFDs are complex instruments and come with a high risk of losing money rapidly due to leverage. 63% of retail investor accounts lose money when trading CFDs with this provider. You should consider whether you understand how CFDs work and whether you can afford to take the high risk of losing your money.
Stratos Global LLC (tradu.com):
Losses can exceed deposits.
Please be advised that the information presented on TradingView is provided to Tradu (‘Company’, ‘we’) by a third-party provider (‘TFA Global Pte Ltd’). Please be reminded that you are solely responsible for the trading decisions on your account. There is a very high degree of risk involved in trading. Any information and/or content is intended entirely for research, educational and informational purposes only and does not constitute investment or consultation advice or investment strategy. The information is not tailored to the investment needs of any specific person and therefore does not involve a consideration of any of the investment objectives, financial situation or needs of any viewer that may receive it. Kindly also note that past performance is not a reliable indicator of future results. Actual results may differ materially from those anticipated in forward-looking or past performance statements. We assume no liability as to the accuracy or completeness of any of the information and/or content provided herein and the Company cannot be held responsible for any omission, mistake nor for any loss or damage including without limitation to any loss of profit which may arise from reliance on any information supplied by TFA Global Pte Ltd.
The speaker(s) is neither an employee, agent nor representative of Tradu and is therefore acting independently. The opinions given are their own, constitute general market commentary, and do not constitute the opinion or advice of Tradu or any form of personal or investment advice. Tradu neither endorses nor guarantees offerings of third-party speakers, nor is Tradu responsible for the content, veracity or opinions of third-party speakers, presenters or participants.

US500, DXY, EURUSD, USDJPY & GBPUSD Daily Trade SetupsIn this update we review the recent price action in the SP500, Dollar Index, Euro, Cable & the Yen and identify the next high-probability trading opportunities and price objectives to target. To review today's video analysis, click here!

Bear I believe this market is going down . I’ve been watching it all day and it’s been a lot of fake outs . So let’s see what it does but I believe it’s going down.

GBPUSD Will Grow! Buy!
Please, check our technical outlook for GBPUSD.
Time Frame: 3h
Current Trend: Bullish
Sentiment: Oversold (based on 7-period RSI)
Forecast: Bullish
The price is testing a key support 1.336.
Current market trend & oversold RSI makes me think that buyers will push the price. I will anticipate a bullish movement at least to 1.342 level.
P.S
Overbought describes a period of time where there has been a significant and consistent upward move in price over a period of time without much pullback.
Disclosure: I am part of Trade Nation's Influencer program and receive a monthly fee for using their TradingView charts in my analysis.
Like and subscribe and comment my ideas if you enjoy them!

British PMIs fall, Trump says won't fire PowellThe British pound dropped as much as 0.7% earlier today and is under pressure. In the North American session, GBP/USD is trading at 1.3265, down 0.45% on the day.
The pound has taken advantage of broad US dollar weakness recently, rising 3% in the month of April. On Tuesday, the pound climbed as high as 1.3423, its highest level since September 2024.
UK PMIs reports softened in April, another reminder that that the UK economy is struggling. The Services PMI fell to 48.9 from 52.5 in March, below the market estimate of 51.3. There are growing fears that the UK will fall into recession and global economic uncertainty has led to decreased business activity.
The Manufacturing PMI eased to 44.0, matching the market estimate but lower than the March reading of 44.9. This was the lowest reading since August 2023 as the deteriorating global market outook has reduced demand for UK exports. The increase in employer tax contributions has hurt employment and lowered confidence.
The International Monetary Fund has lowered its 2025 global growth forecast to 2.8, down from 3.3% in January. The downgrade was in response to US tariffs and the IMF warned that an escalation of trade tensions between the US and other countries would create further market volatility and lead to even lower growth.
US stock markets are sharply higher on Wednesday after President Trump said that he had no intention to fire Federal Reserve Chair Jerome Powell. Trump had intensified his attacks on Powell in recent days, resulting in sharp slides in US equity markets and the US dollar.
Trump also said that China tariffs would drop "substantially" and investors hope this signals a de-escalation in the nasty trade war between the US and China.

GBP/USD For Bearishwait for pull-back near by entry point and then go short
general trend is up trend
current phase is pull-back
GBP under pressure
have fun :)

GBPUSD american tax policy is pushing prices down, we are retesting a historical resistence, for the second time, the probabilty of going bearish is equal to going bullish. the market sentiment is showing a bullish trend

GBP/USD Short 29/04Price is very overbought. Broke previous weeks high and grabbed liquidity. Early in the week for such a big move above 1.34000 and there is also no significant news to sustain another pump. 4hr closed bearish. Anticipating a retracement to 1.32000. The monthly is likely to pull back before it closes.

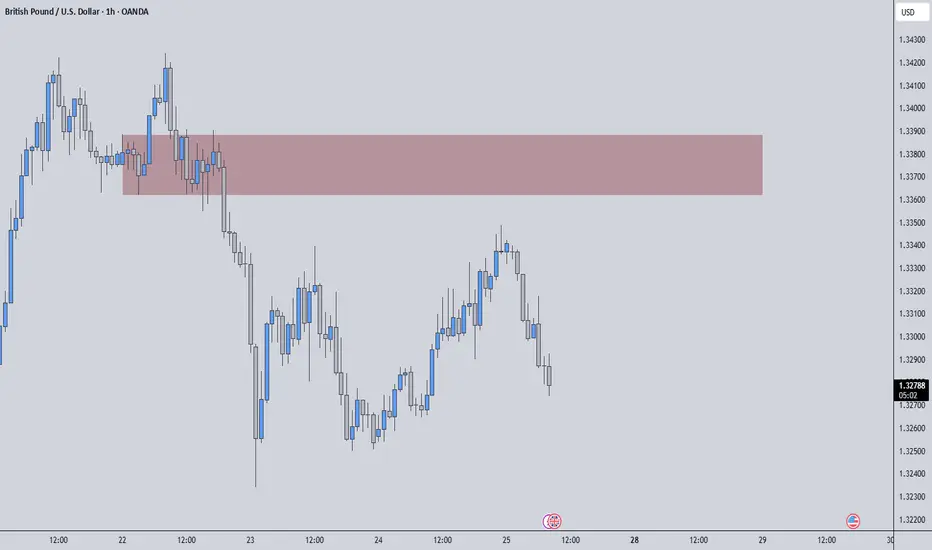
GBPUSD | Short-Term Resistance Forming – Stay Sharp for ReactionGBPUSD has been showing strength lately due to the UK’s early acknowledgment of recession risks and a more transparent economic approach. However, in the short term, we are now approaching a resistance zone that traders should pay close attention to.
🟥 Resistance Zone (Short-Term)
The current red zone overhead has historically acted as a supply area — we’ve seen hesitation and sell pressure emerge here before. If price approaches this area again, it’s important not to chase longs blindly. This level could lead to profit-taking or even a temporary reversal.
📌 What You Can Do:
If you're short-biased, look for lower timeframe weakness in this zone (e.g., rejection candles, market structure shifts) before jumping in.
If you're long-biased, wait to see if this resistance gets reclaimed with strength. Only then consider it a continuation signal — otherwise, it’s best to stay patient.
Always pair your setups with proper confirmation. You already know I never insist on an idea when price action tells another story. Confirmation is key.
Adaptability is your edge. Don’t fight the market — flow with it, and let the chart reveal your edge.
📌I keep my charts clean and simple because I believe clarity leads to better decisions.
📌My approach is built on years of experience and a solid track record. I don’t claim to know it all but I’m confident in my ability to spot high-probability setups.
📌If you would like to learn how to use the heatmap, cumulative volume delta and volume footprint techniques that I use below to determine very accurate demand regions, you can send me a private message. I help anyone who wants it completely free of charge.
🔑I have a long list of my proven technique below:
🎯 ZENUSDT.P: Patience & Profitability | %230 Reaction from the Sniper Entry
🐶 DOGEUSDT.P: Next Move
🎨 RENDERUSDT.P: Opportunity of the Month
💎 ETHUSDT.P: Where to Retrace
🟢 BNBUSDT.P: Potential Surge
📊 BTC Dominance: Reaction Zone
🌊 WAVESUSDT.P: Demand Zone Potential
🟣 UNIUSDT.P: Long-Term Trade
🔵 XRPUSDT.P: Entry Zones
🔗 LINKUSDT.P: Follow The River
📈 BTCUSDT.P: Two Key Demand Zones
🟩 POLUSDT: Bullish Momentum
🌟 PENDLEUSDT.P: Where Opportunity Meets Precision
🔥 BTCUSDT.P: Liquidation of Highly Leveraged Longs
🌊 SOLUSDT.P: SOL's Dip - Your Opportunity
🐸 1000PEPEUSDT.P: Prime Bounce Zone Unlocked
🚀 ETHUSDT.P: Set to Explode - Don't Miss This Game Changer
🤖 IQUSDT: Smart Plan
⚡️ PONDUSDT: A Trade Not Taken Is Better Than a Losing One
💼 STMXUSDT: 2 Buying Areas
🐢 TURBOUSDT: Buy Zones and Buyer Presence
🌍 ICPUSDT.P: Massive Upside Potential | Check the Trade Update For Seeing Results
🟠 IDEXUSDT: Spot Buy Area | %26 Profit if You Trade with MSB
📌 USUALUSDT: Buyers Are Active + %70 Profit in Total
🌟 FORTHUSDT: Sniper Entry +%26 Reaction
🐳 QKCUSDT: Sniper Entry +%57 Reaction
📊 BTC.D: Retest of Key Area Highly Likely
📊 XNOUSDT %80 Reaction with a Simple Blue Box!
📊 BELUSDT Amazing %120 Reaction!
I stopped adding to the list because it's kinda tiring to add 5-10 charts in every move but you can check my profile and see that it goes on..
GU-Wed-23/04/25 TDA-Heavy pullback, now what?Analysis done directly on the chart
Genuine opinions from people who've been following
my analysis:
How are you finding my analysis? Was it helpful? Is
there a way to improve somehow? I'm in the idea that
you can always improve something even if it's just a
little bit. But every single improvement will have good
impact in the long term.
Not financial advice, DYOR.
Market Flow Strategy
Mister Y

GBPUSD: UK Data Back in FocusGBPUSD traded to an 8-month high on Tuesday at 1.3424, as a new wave of dollar selling swept across FX markets at the start of the week. This time driven by fresh uncertainty surrounding US economic growth and by a barrage of social media comments across the Easter Holiday period from President Trump that seemed to challenge the independence of the Federal Reserve.
Now, as we look ahead to the remainder of the week, UK economic data is in focus, with the latest April Preliminary PMI Manufacturing and Services readings released at 0930 BST on Wednesday. These are potentially the first survey updates that will start to show the impact of US tariffs on UK economic growth, business sentiment and inflation, making them potentially important drivers for the future direction of GBPUSD.
They could also shed some light on whether the Bank of England may be able to cut interest rates, as many traders hope, at their next interest rate meeting at the start of May.
Then, on Friday, UK Retail Sales are released at 0700 BST. This release will be important in showing if UK consumers are still spending despite rising unemployment and stubbornly high prices. If they are, this may be taken as a positive for the UK economy and for GBPUSD, while any disappointment could lead to GBPUSD retesting lower levels again.
Technical Update: September 2024 Highs a Key Resistance Focus
So far during 2025, GBPUSD has seen a price recovery of nearly 11%, although as already discussed, this may be due more to broad based USD weakness, rather than outright GBP strength.
Even so, latest upside has neared 1.3434, the September 2024 failure level, which may prove something of a line in the sand this week. Closing defense of 1.3434 may help determine where next directional risks lie.
Much appears to depend on this week’s UK data and reaction to it, but traders may also be focusing on how the 1.3433 failure high is defended on a closing basis. Successful breaks may lead to a more sustained phase of price strength, but without such moves, risks could turn lower again.
However, what are the levels we may need to monitor over coming sessions?
Possible Resistance Levels:
As we have established, traders after what has already been a strong recovery, may view the 1.3433 high as important, with closing breaks required to suggest risks to continue attempts to push to higher price levels.
If closing breaks of 1.3433 do now materialise, it might be an indication of potential to challenge 1.3640, the February 2022 high, even towards 1.3748, equal to the January 10th 2022 rejection level.
Possible Support Levels:
With the 1.3433 price high remaining intact, Tuesday’s weakness from this area could now see focus shift back to support. If these give way, it might in turn point to possibilities of a deeper retracement of April strength.
The first support may now prove to be 1.3313, equal to half the April 17th to April 22nd strength, with closing breaks perhaps suggesting further downside pressure. This could suggest possibilities towards 1.3148/1.3203, a combination of the April 7th low and 38.2% Fibonacci retracement of the April phase of price strength.
The material provided here has not been prepared in accordance with legal requirements designed to promote the independence of investment research and as such is considered to be a marketing communication. Whilst it is not subject to any prohibition on dealing ahead of the dissemination of investment research, we will not seek to take any advantage before providing it to our clients.
Pepperstone doesn’t represent that the material provided here is accurate, current or complete, and therefore shouldn’t be relied upon as such. The information, whether from a third party or not, isn’t to be considered as a recommendation; or an offer to buy or sell; or the solicitation of an offer to buy or sell any security, financial product or instrument; or to participate in any particular trading strategy. It does not take into account readers’ financial situation or investment objectives. We advise any readers of this content to seek their own advice. Without the approval of Pepperstone, reproduction or redistribution of this information isn’t permitted.

Cable H1 | Approaching an overlap supportCable (GBP/USD) is falling towards an overlap support and could potentially bounce off this level to climb higher.
Buy entry is at 1.3200 which is an overlap support.
Stop loss is at 1.3110 which is a level that lies underneath an overlap support and the 38.2% Fibonacci retracement.
Take profit is at 1.3415 which is a multi-swing-high resistance.
High Risk Investment Warning
Trading Forex/CFDs on margin carries a high level of risk and may not be suitable for all investors. Leverage can work against you.
Stratos Markets Limited (tradu.com):
CFDs are complex instruments and come with a high risk of losing money rapidly due to leverage. 63% of retail investor accounts lose money when trading CFDs with this provider. You should consider whether you understand how CFDs work and whether you can afford to take the high risk of losing your money.
Stratos Europe Ltd (tradu.com):
CFDs are complex instruments and come with a high risk of losing money rapidly due to leverage. 63% of retail investor accounts lose money when trading CFDs with this provider. You should consider whether you understand how CFDs work and whether you can afford to take the high risk of losing your money.
Stratos Global LLC (tradu.com):
Losses can exceed deposits.
Please be advised that the information presented on TradingView is provided to Tradu (‘Company’, ‘we’) by a third-party provider (‘TFA Global Pte Ltd’). Please be reminded that you are solely responsible for the trading decisions on your account. There is a very high degree of risk involved in trading. Any information and/or content is intended entirely for research, educational and informational purposes only and does not constitute investment or consultation advice or investment strategy. The information is not tailored to the investment needs of any specific person and therefore does not involve a consideration of any of the investment objectives, financial situation or needs of any viewer that may receive it. Kindly also note that past performance is not a reliable indicator of future results. Actual results may differ materially from those anticipated in forward-looking or past performance statements. We assume no liability as to the accuracy or completeness of any of the information and/or content provided herein and the Company cannot be held responsible for any omission, mistake nor for any loss or damage including without limitation to any loss of profit which may arise from reliance on any information supplied by TFA Global Pte Ltd.
The speaker(s) is neither an employee, agent nor representative of Tradu and is therefore acting independently. The opinions given are their own, constitute general market commentary, and do not constitute the opinion or advice of Tradu or any form of personal or investment advice. Tradu neither endorses nor guarantees offerings of third-party speakers, nor is Tradu responsible for the content, veracity or opinions of third-party speakers, presenters or participants.

GBPUSD Analysis with ICT ConceptsMy current outlook on the British Pound is bearish, with an expectation of lower levels in the near term.
A key level I am anticipating price to reach is the Weekly Open, which has not yet been touched.
Yesterday's price action seems to be confirming this potential move towards the Weekly Open.
Therefore, I am actively looking for confirmed short position opportunities to align with this view.
Trade safe!

THOUGHTS ON THE GBP/USD MARKETGBP/USD 1H - Yes we are wanting to see weakness in the USD this week, however price may trade us lower initially to clear the orders fully before the move higher.
We have seen that price has broken structure fractally on the 30M timeframes, again this could be short lived and this could be just to clear the inefficient structure before taking us higher again, missing the zone we have marked out below.
This is why it is important that with every trade we place we wait for relevant confirmation before entering to avoid getting caught out. I will be waiting for price to trade us up and breaking structure fractally before I look to take the market short.
Even then it will only be an intraday/day trade, one that I will look to close by the end of week. I will keep you all posted with anything I do on this pair. SIT ON YOUR HANDS AND WAIT!

#GBPUSD: Massive Swing Sell Is In Making 1200+ Pips Worth? **FX:GBPUSD Price Analysis**
GBPUSD price has recently experienced an overbought condition, primarily due to the significant decline of the DXY index. This decline can be attributed to the ongoing trade dispute between China and the United States, which has resulted in a drop in the DXY index to its lowest point in the past eighteen months.
Conversely, the GBP has gained strength due to positive economic indicators indicating robust growth in the United Kingdom. This has made the GBP more attractive to investors.
The FX:GBPUSD price is expected to continue its upward trend and potentially reach the 1.35 level. However, it is also possible for the price to reverse its direction from this point.
**Targets:**
If the trade is activated, three targets have been set for the FX:GBPUSD price. These targets can be adjusted based on your own analysis and trading strategy.
We extend our sincere gratitude for your unwavering support and well wishes.
Best regards,
Team Setupsfx_

GBP/USD - ShortPrice is in a small downtrend on the Daily, because of this, i am looking for shorts on the smaller timeframes.
There was a 4H FVG that was broken, creating an IFVG. Price had retraced to thay level before continuing down, this created a 1H Order Block.
The Order block sits within the 4H IFVG, Yesterdays High and Equilibrium.
Both GBPUSD And EURUSD are aligning this way.
GBPUSD looks the stronger option.

Liquidity drag, potential upsideA very slow and surprising Tuesday given easter break is finished. Liquidity was flowing through from Monday up until the close. Today we have seen a very slow climb to the downside - not much of a reaction from our recent political news with Trump & the Jerome Powells thoughts on cutting rates.
Personal opinion - markets were very reactionary on the tarrifs. There is some consensus for bad news to come out in the UK which are labelled "high importance" - price action could be factoring in this for today, however, we must consider the fact of how slow bears did today technically both in European & US markets sessions.
Swing to the upside & knock off to knock off 1.34 before anything further. However, we can still see a potential short term continuation to the mid 50s in 1.32 , where I will slowly take away positions.
No stop loss, swing trade, opened positions ranging from 1.3345-1.3375 areas. Just wanted to share an idea in the midst of now of a good speculative entry.

GBPUSD TRADE PLAN H1GBPUSD TF H1
SELL/SHORT PLAN
cancel if price break ma100(blue),or price break structure
take profit max 1.32000
