GBPUSD BUY TRADE PLAN🧭 GBPUSD SWING TRADE PLAN
📅 Date: April 4, 2025
🔒 Format: Institutional Swing Blueprint
🔖 Plan Type: Reversal to Continuation
📈 Bias & Trade Type: Bullish (Trend Continuation After Pullback)
🔰 Confidence Level: ⭐⭐⭐⭐ (80%)
Why?
• W1 bullish breakout structure and HTF trend support
• D1 bullish continuation leg, large liquidity sweep on Friday
• H4 breaker block + imbalance filled
• H1 strong reaction wick off bullish order block
• USD weakness post macro shock (tariff-induced sell-off)
📌 Status: PRE-TRADE (Active Setup, Awaiting Confirmation)
📍 Entry Zones:
🟩 Primary Buy Zone: 1.2975 – 1.2995
(Overlap of H4 OB, H1 FVG base, discount zone)
🟨 Secondary Buy Zone (Deeper Tap): 1.2940 – 1.2955
(H1 bullish rejection base + 61.8% Fib + Volume cluster)
❗ Stop Loss:
🔻 1.2915
(Below deeper OB + invalidation of last bullish candle wick base)
🎯 Take Profits:
🎯 TP1: 1.3075
🎯 TP2: 1.3135
🎯 TP3: 1.3220
📏 Risk:Reward
Approx. 1:2.5 – 1:3.5, depending on execution and confirmation
🧠 Management Strategy:
• Enter only on bullish confirmation candle (e.g., engulfing / wick rejections)
• SL to BE at TP1
• Partials at TP2, full close or trail beyond TP3
• If price drops below 1.2915 cleanly → stand down, wait for new setup
⚠️ Confirmation Criteria:
• Bullish engulfing or strong wick rejection from buy zone
• Volume spike near zone lows
• Break of H1 internal structure back toward 1.3020+
⏳ Validity:
48 hours from NY open
🌐 Fundamentals:
• GBP strength continues with macro resilience
• USD sentiment remains fragile post tariff tensions
• BoE remains neutral/hawkish, Fed uncertainty rises
📋 Final Summary:
GBPUSD remains in a macro bullish structure. The recent pullback was sharp but orderly. If the primary or secondary buy zone holds, this presents a high-probability continuation leg. We will treat this as a trend-protected pullback buy opportunity.
GBPUSD.P trade ideas

Gbp/Usd Harmonic PatternFX:GBPUSD
Bearish bat pattern in making TF 30 mins
Market is completing it's C-D leg .
After completion of C-D leg , take sell trade and target for 0.382%


Gu outlook (15min)The flag patter held price well together with the 15min ob.
Entry was at the 5min engulfing
Hope someone caught the trade.

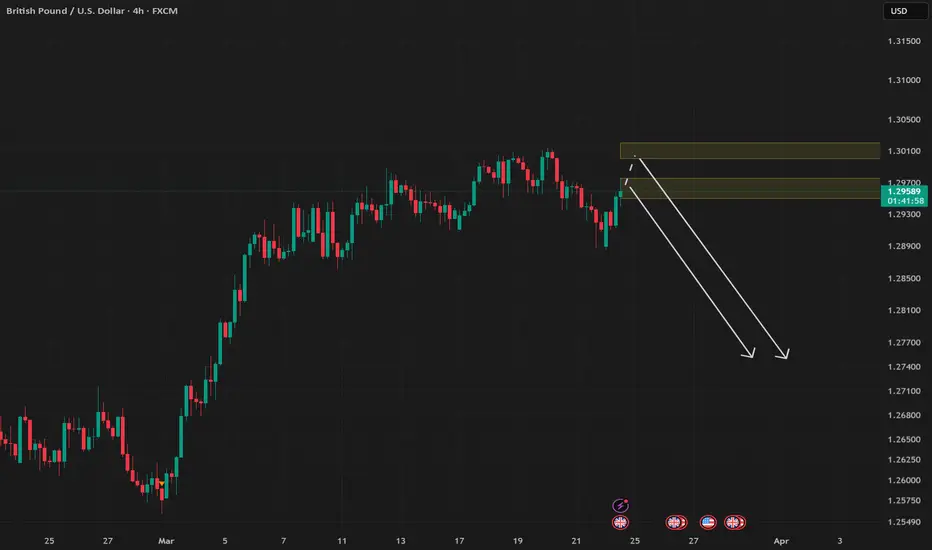
GBPUSD SELL TRADE PLAN🔥GBP/USD TRADE PLAN🔥
✅ Market Bias: Bearish 📉 (Downtrend) ✅ Trade Type: Trend Continuation
📌 ENTRY TYPE: Sell Trade – Pullback Entry ⭐ Confidence Level: 🔵⭐⭐⭐⭐⭐ (High)
📌 STATUS: Price is within the entry zone; monitoring for confirmation signals.
📍 ENTRY ZONE (SELL):
Primary Entry Zone: 1.2950 - 1.2975
Secondary Entry Zone (if deeper pullback occurs): 1.3000 - 1.3025
📌 STOP LOSS & TAKE PROFIT TARGETS:
🚨 Stop Loss: Above 1.3030 (Invalidation level)
🎯 Take Profit Targets:
🥉 TP1: 1.2850 (Partial profits & SL to breakeven)
🥈 TP2: 1.2800
🥇 TP3: 1.2750 (Final target)
📌 Risk-Reward Ratio:
Primary Entry Zone: Approximately 1:3
Secondary Entry Zone: Approximately 1:4
📌 Reason for Entry:
Bearish Trend: GBP/USD has been dominated by a downward correctional wave, indicating a bearish outlook.
Technical Resistance: The pair faces resistance near the 1.3000 psychological level, which has previously acted as a strong barrier.
Fibonacci Confluence: The 50% Fibonacci retracement level aligns with the entry zone, providing additional confluence.
📌 CONFIRMATION REQUIRED BEFORE SELLING:
H1 Bearish Candlestick Rejection: Look for a pin bar or engulfing pattern at the entry zone.
Volume Increase at Supply Zone: Indicates strong selling pressure.
Lower Timeframe Bearish Divergence: On M15/H1 charts for extra confluence.
❌ DO NOT take the trade if the price breaks above 1.3030 without a bearish reaction.
📌 RISK MANAGEMENT REMINDER:
💰 Risk 1-2% per trade. Move SL to breakeven after TP1 to secure profits.
📌 TRADE VALIDITY & INVALIDATION CONDITIONS:
✅ Trade Validity: Must tap entry within the next 24 hours.
❌ Invalid if:
Price misses the entry zone and moves straight to TP1/TP2.
Fundamental shift changes trade bias (e.g., major news event).
Price breaks above 1.3030 = Trade invalidated.
📌 FUNDAMENTAL CHECKS & SENTIMENT ANALYSIS:
GBP Weakness: The British pound has fallen significantly against the US dollar, testing key support levels.
USD Strength: The US dollar remains strong amid global economic uncertainties.
COT Report: Indicates institutions adding to USD long positions, reducing GBP longs.
🚀 FINAL TRADE PLAN SUMMARY:
SELL GBP/USD on a pullback into 1.2950 - 1.2975 (or 1.3000 - 1.3025 if a deeper correction occurs).
Targeting: 1.2850 → 1.2800 → 1.2750.
SL: Above 1.3030.
**Trade valid for the next 24 hours.
🚀 EXECUTE WITH INSTITUTIONAL PRECISION! 🔥
GBPUSD 4H SHORT [UPdate]In line with expectations of a decline in GBPUSD, the price interacted with the primary order block. To feel safe in this position, I move the stop order to $1.29620
I expect the downward trend I mentioned in the main review to continue to my targets:
$1.28609
$1.28030
$1.27534
$1.26722

GBPUSD Broke the channel support, Fake breakdown? GBPUSD was moving within an upward trend channel, but last week it broke through the lower support line. It is now testing this support, which has become its resistance. Will it decline further, or was this a false breakout? Let's find out.

GBPUSD LONGS CONCEPTMarkets are choppy and so is cable.
I wanna see Tuesday's low being maintained as the low of the week and an expansion to prev weekly highs.
I was awaiting a HTF Mss with confirmation of how the market will close above prev daily highs.
Getting an entry on this one can be tricky unless the dollar index will be strongly drawn to the downside.
Lets tape read this together. I'll share more afterwards.
Stay tuned, & if you have not, hit the boost & follow button for more insights

GBPUSD BUY based on a combination of Supply-demand & Reversal On the weekly timeframe, we have a demand zone based on rally-base-rally pattern, and I expect a bounce off of that base, but I'm waiting to see a higher high on the 4-hour timeframe and enter a long trade on the retest of its previous high.
I'm trying to combine the Supply & Demand trading with Reversal trading on this trade!

Last attempt in seeking short!Still currenty seeking shorts on gbpusd as long as the market doesnt break above 1.34

GBPUSD BUY Well let's try another idea for today, i can see gbpusd make 3rd wave up to make HnS pattern and then massive sell if powell doesnt cut rates(emergency) , Monday is scary day and there is chance to lose trades as there is no structure yet , let's see if this plays out !
3 RRR
GL Traders
Not advice !

GBPUSD BUY !I have in mind this buy , let’s hope markets plays out like this, as Trump’s tarrifs is affecting markets. We can see clearly downtrend and all the time market push itself down, i could see before Tariff announcment it could go up as we can't know what happens after announcment
2.5 RRR
GL Traders
Not Advice

GU-Mon-7/04/25 Top down analysis-Huge liquidity grab on GU!Analysis done directly on the chart
You don't have to be a genius to understand
macro economically what's happening in the market.
Use economic calendar, FinancialJuice to stay up to date.
Not financial advice, DYOR.
Market Flow Strategy
Mister Y

LEAP: GBPUSD Week 15 Swing Zone/LevelsFollowing last week's sharp whipsaw that ended in a downtrend due to the tariff announcement, the expectation is for the downward trend to continue. That said, price action may ultimately tell a different story.

Short till 1.28788Failure of price to displace above 1.29401 has warranted bearish momentum down to 1.28788

GU-Wed-2/04/25 Top down analysis-Have patience on GUAnalysis done directly on the chart
Not the best week even for the best traders.
Don't feel discouraged, quality over quantity.
Have you seen good setups in this messy
Market condition and amid uncertainty? Know
how to preserve and protect your capital
during hard times and maximize profits when
smooth price action with clarity in the market
comes.
Not financial advise, DYOR.
Market Flow Strategy
Mister Y

GBPUSD selloffWe wait for this retest and then hope for best, overrall markets should still head downwards as Tariffs are in play, but you always never know what will happen, this will be my play today , I think it was called ''silver bullet'' pattern.
2.7 RRR
GL Traders
Not advice !

GBPUSD: 2000+ Pips Buying Opportunity! Dear Traders,
Hope you are doing great, we have an excellent buying opportunity on GU which worth up to 2000 pips. Please wait for price to make correction and enter accordingly. Use accurate risk management.


Bullish Rectangle of CableChart Shapes Work Very Well When News and Financial Indicators also Confirm Them. You See Here a Bullish Rectangle in GBPUSD Day Chart. For Long Time Holders It is A Good Trade Time.

GBP/USD BUY ENTRY @1.28580 H4 chart analysisEntry Point: Around 1.28580
Stop Loss (SL): Around 1.27183
Take Profit (TP): Approximately 1.31000 (based on the green target zone)
Support Zone: Between 1.27183 and 1.28580 (highlighted in red)
Resistance Zone: Around 1.31000
The setup shows a potential bullish move with a Risk/Reward Ratio of 2.71, indicating a favorable trade opportunity. Let me know if you'd like additional details or tips for presenting this to your client.

GBPUSD FORECASTIn this analysis we're focusing on 4H time frame for GBPUSD. As we know that market trend was bullish and today I'm looking for a buy side opportunity. According to my analysis, if the market price wants to continue its move to the upside, it will need to first retest the key levels drawn on the chart before it can continue its upward movement. Let's see what happens and which opportunity market will give us. Always remember when price reaches our key levels wait for confirmation. After confirmation execute your trades.
Always use stoploss for your trade.
Always use proper money management and proper risk to reward ratio.
This is just my analysis or prediction.
#GBPUSD 4H Technical Analyze Expected Move.

This GBP/USD Move Will Catch Most Traders Off GuardGBP/USD has been in a strong uptrend over the past few weeks, with consistent bullish momentum. However, last week we saw the pair move into a period of range-bound consolidation—that is, until geopolitical headlines shook things up.
Following the news of Trump’s tariff announcements, the pair initially spiked aggressively to the upside, only to see a sharp 500-pip drop the next day. While this move might seem like a reversal at first glance, I believe it's a healthy pullback within a broader bullish trend.
Here’s why:
✅ The recent decline cleared out late buyers, creating a potential liquidity zone for institutions.
✅ Prior to the drop, the market took out sell-side liquidity from the range, then quickly reversed — a classic "grab and go" move.
✅ Structure remains intact to the upside, and I believe this pullback presents a high-probability buying opportunity.
📈 I’m expecting GBP/USD to retest and likely break last week’s high, with potential for another 500+ pip move to the upside in the coming sessions.
🛑 As always, manage risk carefully—nothing moves in a straight line, and fundamentals remain a factor.
If you found this insight helpful, give it a boost! 🔥
