GBPUSD BUY NOW!!!GBPUSD formed a bullish flag pattern or called a falling wedge on the 30min chart am looking forward to see price make a bigger bounce back off this zone to 1.35055 that's my goal target.
GBPUSD.P trade ideas

GBPUSD pays attention to buying opportunities on pullbacksIn the 4-hour chart, GBPUSD broke through the triangle consolidation and bulls are currently in the lead. Currently, we can pay attention to the support around 1.335. If it falls back and stabilizes, we can consider continuing to buy. The upward target is 1.350-1.364.

GBPUSD H4 | Bearish Reversal Based on the H4 chart analysis, we can see that the price is testing our sell entry at 1.3431 which is a swing high resistance.
Our take profit will be at 1.3294 an overlap support level.
The stop loss will be placed at 1.3558, above the 161.8% Fibo extension.
High Risk Investment Warning
Trading Forex/CFDs on margin carries a high level of risk and may not be suitable for all investors. Leverage can work against you.
Stratos Markets Limited (tradu.com):
CFDs are complex instruments and come with a high risk of losing money rapidly due to leverage. 63% of retail investor accounts lose money when trading CFDs with this provider. You should consider whether you understand how CFDs work and whether you can afford to take the high risk of losing your money.
Stratos Europe Ltd (tradu.com):
CFDs are complex instruments and come with a high risk of losing money rapidly due to leverage. 63% of retail investor accounts lose money when trading CFDs with this provider. You should consider whether you understand how CFDs work and whether you can afford to take the high risk of losing your money.
Stratos Global LLC (tradu.com):
Losses can exceed deposits.
Please be advised that the information presented on TradingView is provided to Tradu (‘Company’, ‘we’) by a third-party provider (‘TFA Global Pte Ltd’). Please be reminded that you are solely responsible for the trading decisions on your account. There is a very high degree of risk involved in trading. Any information and/or content is intended entirely for research, educational and informational purposes only and does not constitute investment or consultation advice or investment strategy. The information is not tailored to the investment needs of any specific person and therefore does not involve a consideration of any of the investment objectives, financial situation or needs of any viewer that may receive it. Kindly also note that past performance is not a reliable indicator of future results. Actual results may differ materially from those anticipated in forward-looking or past performance statements. We assume no liability as to the accuracy or completeness of any of the information and/or content provided herein and the Company cannot be held responsible for any omission, mistake nor for any loss or damage including without limitation to any loss of profit which may arise from reliance on any information supplied by TFA Global Pte Ltd.
The speaker(s) is neither an employee, agent nor representative of Tradu and is therefore acting independently. The opinions given are their own, constitute general market commentary, and do not constitute the opinion or advice of Tradu or any form of personal or investment advice. Tradu neither endorses nor guarantees offerings of third-party speakers, nor is Tradu responsible for the content, veracity or opinions of third-party speakers, presenters or participants.

GBP Rebounds on Retail Sales – But USD Still in Control📌 GBP Bounces on Strong Retail Sales, But USD Strength Keeps Pressure On 💷📉
The British Pound (GBP) rebounded on Friday after UK Retail Sales data surprised to the upside. According to the Office for National Statistics (ONS), retail sales rose by 0.4% in March, beating expectations of a -0.4% decline. On a yearly basis, growth accelerated to 2.6%, outpacing the forecast of 1.8%.
However, despite the positive data, traders remain confident the Bank of England (BoE) may still cut interest rates by 25 bps to 4.25% in the May meeting, due to persistent global uncertainties and softer inflation expectations.
Meanwhile, the US Dollar (USD) gained ground across the board as trade tensions between the US and China appeared to ease. Durable Goods Orders in the US jumped by 9.2% in March — a clear sign of business confidence and policy impact.
📊 Technical Outlook – GBP/USD
GBP/USD briefly recovered from an intraday low of 1.3280 but remains under pressure near key resistance.
On the upside, the psychological barrier at 1.3500 remains a major hurdle.
To the downside, the April 3rd high around 1.3200 now acts as strong support.
💼 Trading Plan
🟢 BUY ZONE:
Entry: 1.32500
SL: 1.32000
TP: 1.33300
🔴 SELL ZONE:
Entry: 1.34180
SL: 1.34700
TP: 1.33500
📌 Stay alert ahead of key BoE guidance and further US-China headlines — volatility may increase as we head into May.

GU for sell Looking at the weekly strong resistance, the price might come to the downside. Triggering my sell from lower time for better entering.

GBPUSD(20250430)Today's AnalysisMarket news:
The European Central Bank expects prices to rise 2.9% over the next 12 months, up from 2.6% in February, according to a monthly survey released on Tuesday. This is the highest level since April 2024. The three-year indicator rose slightly to 2.5%. The ECB's first five-year forecast was 2.1%.
Technical analysis:
Today's buying and selling boundaries:
1.3409
Support and resistance levels:
1.3471
1.3448
1.3433
1.3385
1.3370
1.3347
Trading strategy:
If the price breaks through 1.3409, consider buying, the first target price is 1.3433
If the price breaks through 1.3385, consider selling, the first target price is 1.3370

Where market reverse?Hello all. I consider 2 important situations. one of them will be end of correction. can you guess which one is correct? and why? Plz CM me. I wanna hear your ideas.

Sterling Bulls Wrestle 2024 HighsThe British Pound has rallied more than 11.1% off the yearly low with GBP/USD trading into uptrend resistance at fresh yearly highs. Building momentum divergence highlights the risk for exhaustion here and while the broader outlook remains constructive, the immediate advance may be vulnerable near-term while below this slope.
Initial support rests with the objective weekly open at 1.3313 and is backed by the April opening-range high (ORH) at 1.3207. A break / close below the median-line would be needed to suggest a more significant high was registered this week / a larger correction is underway. Subsequent support seen at 1.3111 with broader bullish invalidation raised to the 1.30-handle.
A topside breach / close above the upper parallel would expose subsequent topside objectives at the 2019 high at 1.3515 backed by the 1.36-handle and the 2022 high-day close (HDC) at 1.3705- both levels of interest for possible topside exhaustion / price inflection IF reached.
The British Pound rally off the yearly lows has extended into uptrend resistance at the yearly highs on building bearish momentum divergence- mounting risk for exhaustion here. From a trading standpoint, a good zone to reduce portions of long-exposure / raise protective stops- losses should be limited to 1.32 IF price is heading higher on this stretch with a close above the upper parallel needed to fuel the next leg of the advance.
-MB

Pound Pressured by BOE Cut ExpectationsGBP/USD dipped to approximately 1.3425 during early Asian trading on Tuesday, as a slight rebound in the U.S. dollar put pressure on the pair. The dollar was supported by easing U.S.-China trade tensions, following China’s decision to exempt certain U.S. imports from tariffs, despite its denial of ongoing negotiations.
Meanwhile, expectations of a 25 basis point rate cut by the Bank of England in May continue to weigh on the pound. Markets are now focused on an upcoming speech by BoE Deputy Governor Dave Ramsden, with any dovish remarks likely to add further downside pressure on the GBP.
If GBP/USD breaks above 1.3430, resistance levels are at 1.3500 and 1.3550. Support is at 1.3200, followed by 1.3050 and 1.2960.


check the trendIf the price can consolidate above the current support level, the upward trend will likely continue. Otherwise, the correction will continue to the specified support levels.

GBPUSD 1.50 ?👀 Market Insight – GBP/USD
After a long time, I’ve revisited the currency pairs — and GBP/USD has caught my attention!
The setup is looking strong and is preparing for a move toward the 1.50 benchmark, sooner or later. 📈
Stay tuned — opportunities are lining up!

GBPUSD SHORT FORECAST Q2 W17 D25 Y25GBPUSD SHORT FORECAST Q2 W17 D25 Y25
Professional Risk Managers👋
Welcome back to another FRGNT chart update📈
Diving into some Forex setups using predominantly higher time frame order blocks alongside confirmation breaks of structure.
Let’s see what price action is telling us today!
💡Here are some trade confluences📝
✅Weekly order block rejection
✅Daily order block rejection
✅15’ order block
✅Tokyo ranges to be filled
🔑 Remember, to participate in trading comes always with a degree of risk, therefore as professional risk managers it remains vital that we stick to our risk management plan as well as our trading strategies.
📈The rest, we leave to the balance of probabilities.
💡Fail to plan. Plan to fail.
🏆It has always been that simple.
❤️Good luck with your trading journey, I shall see you at the very top.
🎯Trade consistent, FRGNT X

GBPUSD - Will the dollar go up?!The GBPUSD pair is above the EMA200 and EMA50 on the 4-hour timeframe and is moving in its ascending channel. If the pair corrects down towards the demand zone, it can be bought in the direction of its rise.
According to the latest Reuters survey of economists, U.S.-imposed trade tariffs have had a significant negative impact on the business environment in the United Kingdom. The assessment suggests that global trade tensions, combined with America’s protectionist policies, have undermined the confidence of British companies and investors in the country’s economic outlook. Market pricing reflects expectations that the Bank of England will cut interest rates by 0.84% over the course of this year.
The survey indicates that the UK’s GDP growth for 2025 is expected to average 0.9%, down from the previous estimate of 1%. Growth for 2026 is now projected at 1.2%, also lower than the 1.4% forecast made in March.
In terms of monetary policy, there is a strong consensus among economists that the Bank of England is on a gradual path toward easing interest rates. Projections suggest that the base rate will decline by 25 basis points each quarter throughout 2025, reaching 3.75% by year-end. Notably, all 67 economists participating in the poll expect the Bank of England to cut rates by 25 basis points at its May 8 meeting, bringing the rate down to 4.25%.
Meanwhile, the U.S.Federal Reserve, in its latest Beige Book release, reported that economic activity across the country has shown “little change.” The report detailed that only five districts experienced “modest growth,” three noted activity was “about flat,” and four reported “slight to moderate declines.” The Fed stated, “The outlook in several districts deteriorated notably due to heightened economic uncertainty, particularly stemming from tariffs.”
On employment, most districts experienced “little to slight” increases. One district noted a “modest increase,” four reported “slight gains,” another four observed no change, and three recorded “slight declines” in employment levels.
At the same time, prices continued to rise across the country. Six districts described price growth as “modest,” while the other six reported it as “moderate.” The Fed explained that most districts expected input costs to rise further due to tariffs.
UBS has issued a warning that Donald Trump’s calls for rate cuts may erode confidence in the Federal Reserve’s independence and fuel greater uncertainty in financial markets.
UBS analysts believe that reduced investment and consumption in the U.S. economy are primarily driven by increased economic uncertainty, rather than restrictive monetary policy. They emphasize that markets are highly sensitive to any perceived threats against the Fed’s autonomy, and in the current climate, it is this economic volatility—more than interest rate levels—that is harming the economy.

GBPUSD needs to fill an imbalance at the upsideGBPUSD has had it's short term retracement after a rally to the upside. It is now looking like a reversal back bullish at least to the last unfilled imbalance at the 1.3365 area. It may also break though it and continue to go up due to the dollar weakening.

GBPUSD SHORT FORECAST Q2 W17 D23 Y25GBPUSD SHORT FORECAST Q2 W17 D23 Y25
Professional Risk Managers👋
Welcome back to another FRGNT chart update📈
Diving into some Forex setups using predominantly higher time frame order blocks alongside confirmation breaks of structure.
Let’s see what price action is telling us today!
💡Trade confluences📝
✅Weekly Order block rejection
✅15’ order block created
✅15’ wick rejections via order block
✅Intraday bearish breaks of structure
✅Tokyo ranges to be filled
✅1’ break of structure
✅1’ bearish engulfing candle fill
✅Sell limit order on the 1’ candle fill
🔑 Remember, to participate in trading comes always with a degree of risk, therefore as professional risk managers it remains vital that we stick to our risk management plan as well as our trading strategies.
📈The rest, we leave to the balance of probabilities.
💡Fail to plan. Plan to fail.
🏆It has always been that simple.
❤️Good luck with your trading journey, shall see you at the very top.
🎯Trade consistent, FRGNT X

GBPUSD: 1.25 BORIS JOHNSON mometumPositioning for 2020
Boris Trump FEVER ... US wants to depreciate dollars for jobs jobs jobs
and BREXIT shall make the pound stronger than ever ...

possibility of uptrendThe price is expected to stabilize above the current support area and then continue the upward trend.
If the price breaks through the green support area, the downward trend is likely to continue to the next support levels.

GBPUSD is in the Selling DirectionHello Traders
In This Chart GBPUSD HOURLY Forex Forecast By FOREX PLANET
today GBPUSD analysis 👆
🟢This Chart includes_ (GBPUSD market update)
🟢What is The Next Opportunity on GBPUSD Market
🟢how to Enter to the Valid Entry With Assurance Profit
This CHART is For Trader's that Want to Improve Their Technical Analysis Skills and Their Trading By Understanding How To Analyze The Market Using Multiple Timeframes and Understanding The Bigger Picture on the Charts

GBPUSD Discretionary Analysis: Bounce at 1.33Hello traders.
On GBPUSD, I'm watching this 1.33 zone closely. It's where I'll be looking for a reaction. It can be a solid bounce spot if it shows signs.
Discretionary Trading: Where Experience Becomes the Edge
Discretionary trading is all about making decisions based on what you see, what you feel, and what you've learned through experience. Unlike systematic strategies that rely on fixed rules or algorithms, discretionary traders use their judgment to read the market in real time. It's a skill that can't be rushed, because it's built on screen time, pattern recognition, and the ability to stay calm under pressure.
There's no shortcut here. You need to see enough market conditions, wins, and losses to build that intuition—the kind that tells you when to pull the trigger or sit on your hands. Charts might look the same, but context changes everything, and that's something only experience can teach you.
At the end of the day, discretionary trading is an art, refined over time, sharpened through mistakes, and driven by instinct. It's not for everyone, but for those who've put in the work, it can be a powerful way to trade.

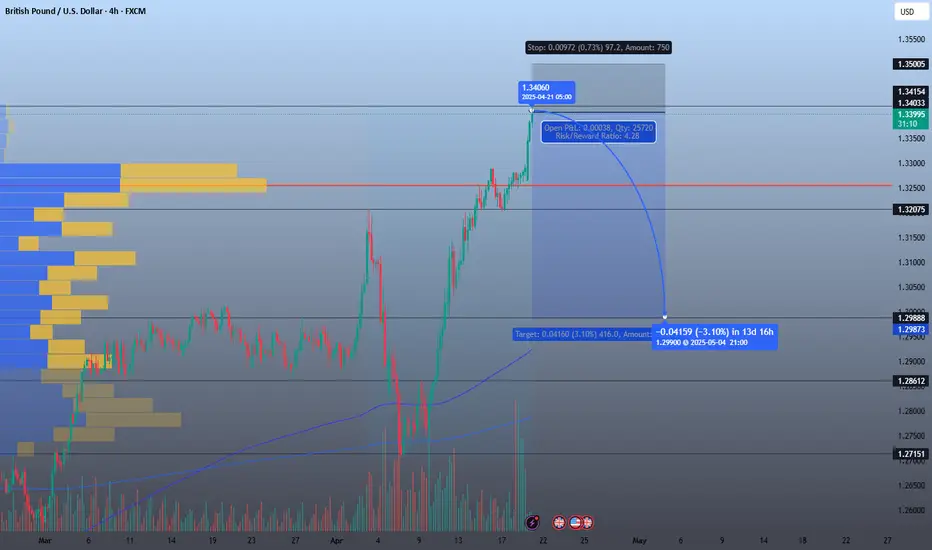
Sell OpportunityGBP/USD Sell Setup – Strong Rejection at Key Resistance
Entry: 1.3406
TP: 1.2990
SL: 1.3500
RR: 4.28
Analysis:
Price hit a strong resistance zone with heavy volume profile rejection and long-wick candle, indicating possible exhaustion. After an extended rally, a retracement is expected. Clean structure breakdown could take price back to the 1.3000 psychological level.
Bias: Bearish
Timeframe: 4H
Outlook: Short to mid-term (1–2 weeks)
GBPUSD at Key Resistance - Time to Sell?OANDA:GBPUSD has reached a key resistance level, marked by significant selling pressure. This area has historically acted as a key supply zone, increasing the likelihood of a bearish reaction if sellers step in again.
The current market structure suggests that if the price confirms a rejection from this resistance level, there is a high probability of a downward move. I anticipate that if rejection occurs, the market may head lower toward the 1.30950 level, which serves as a logical target within the current market structure. However, a break above this resistance would invalidate the bearish bias and could lead to further upside.
This setup reflects the potential for a retracement after an impulsive move, supported by the confluence of previous price behavior and the current structure. If you agree with this analysis or have additional insights, feel free to share your thoughts in the comments!

GBP/USD Pullback PotentialIt took awhile for Cable to finally mount a rally above the 1.3000 handle. That price was resistance multiple times in March, but it wasn't until the next month that prices were able to finally sustain a push above the big figure. It wasn't exactly a clean trend, especially considering the sell-off on April 4th, which broke through a number of supports; but the response that was intense as GBP/USD jumped back-above 1.3000 and ran all the way into 1.3250.
Which presents us with the current scenario...
Wednesday brought an indecision candle right at that psychological level and so far today on Thursday, there's more indecision showing. This doesn't necessarily portend reversal but it does highlight that bulls may want to try to be patient here and look for a pullback.
For support, both the Fibonacci level at 1.3105 and the psychological level at 1.3000 were resistance on the way up but have yet to show support after the breakout. Bulls holding higher-lows at either of those spots keeps the door open for continuation into longer-term resistance around Fibonacci levels at 1.3328 and 1.3414. - js
