SELL GBPUSDThis is an opportunity to go short on this pair, lets get the pips and stay on a solid risk management plan.
GBPUSD.P trade ideas

GBPUSD sell GBP is starting to lose its strenght and USD is starting to gain its strenght , lets see what market has prepared for us , this is trade im in . IF everything goes as we can see we should see GBP melting versus USD . This one is big one !
6 RRR
GL Traders
NOT ADVICE !

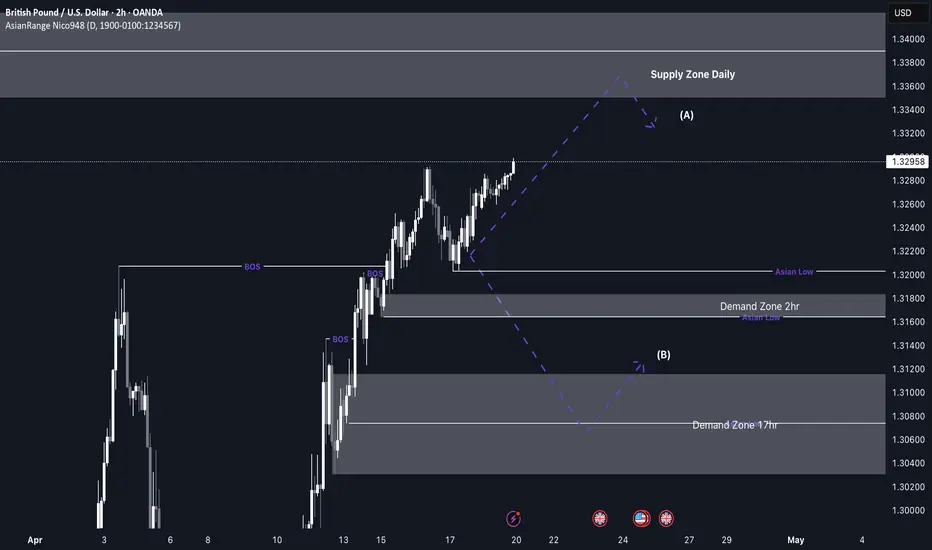
GBP/USD upcoming shorts from 1.33600 back down to demandMy focus this week for GU is around a key daily supply zone that price is currently approaching. As we near this level, I expect price to slow down and begin distributing, potentially leading to a deeper retracement. I anticipate the short setup to form around Tuesday, depending on how price reacts.
If price does retrace, I’ll be watching the 2-hour and 17-hour demand zones, where we could see a bullish reaction and a potential rally from those levels. Since GU has been overall bullish, this would be a counter-trend short, followed by a possible continuation to the upside.
Confluences for GBP/USD Shorts:
- Price is overbought, indicating a potential correction to clear liquidity and fill imbalances.
- Plenty of downside liquidity and imbalances that price could target.
- Approaching a strong daily supply zone, which could act as a key reversal point.
- Unmitigated demand zones below, which may need to be tapped before price continues higher.
P.S. If price doesn’t reach the daily supply zone, I’ll remain patient and look for a buy opportunity to ride price up toward that supply level.
Wishing everyone a great trading week ahead!
GBPUSD 30M CHART PATTERNThis chart displays a GBP/USD 30-minute timeframe with a bullish harmonic pattern, possibly a Gartley or Bat pattern, forming a potential long (buy) trade setup.
Here’s a quick breakdown:
Green Arrows: Indicate the harmonic pattern completion and potential entry point for a buy.
Red Arrow: Marks a previous resistance or pattern completion level.
Blue Lines: Represent the projected price movement after pattern completion.
Green Zone: Target area (Take Profit levels).
Red Zone: Risk area (Stop Loss level).
Two Take Profit Levels:
First TP is at the

GBPUSD - NEXT STOP @1.34343? [UPDATE]TRADE UPDATE
As planned for the week price traded to my POI just as i'd anticipated (without getting to my DOL first) so i took my Long Position and it got to my TP for a quick 1:3RR.
KEY TAKEAWAY
I followed my plan and waited for price to come to my level without chasing it(even after the quick spike up to begin the week).
Patience Pays!

GBP is bullish but looks weakThere can be a short pullback, which can be a quick move also
The momentum is very low but the volume is still high


Wave Outlook Correction on GBP/USDFX:GBPUSD The wave outlook for GBP/USD suggests a continued upward movement. A further increase is anticipated to complete the fifth wave.

GBPUSD Will Grow! Long!
Please, check our technical outlook for GBPUSD.
Time Frame: 9h
Current Trend: Bullish
Sentiment: Oversold (based on 7-period RSI)
Forecast: Bullish
The price is testing a key support 1.329.
Current market trend & oversold RSI makes me think that buyers will push the price. I will anticipate a bullish movement at least to 1.342 level.
P.S
Overbought describes a period of time where there has been a significant and consistent upward move in price over a period of time without much pullback.
Disclosure: I am part of Trade Nation's Influencer program and receive a monthly fee for using their TradingView charts in my analysis.
Like and subscribe and comment my ideas if you enjoy them!

Short term retracement on GBPUSD before continuing the uptrendGBPUSD has been flying for a while now due to dollar weakening.
From my analysis it looks like it is currently making a short term retracement to fill some imbalances before continuing to the upside again.

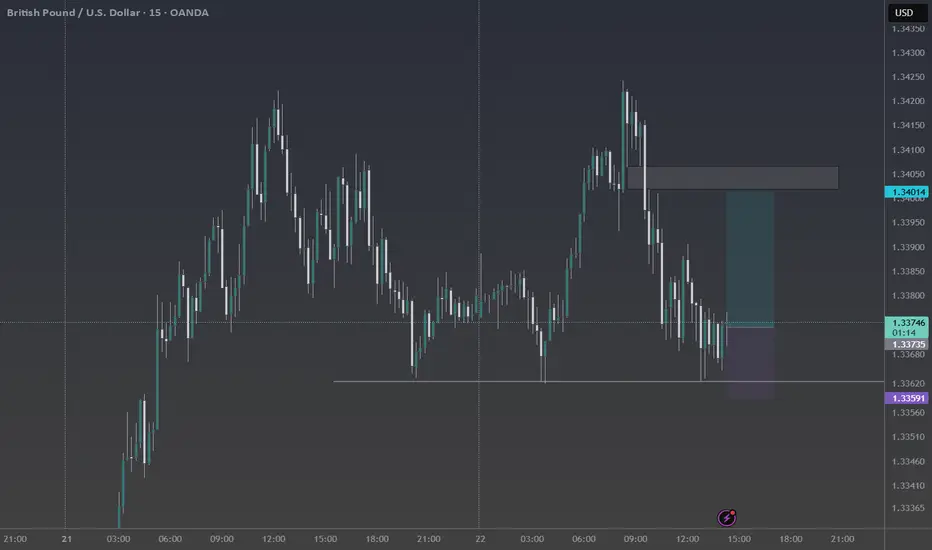
GBPUSD long before a short term bearish retracementBased on my technical analysis, it looks like GBPUSD wants to fill a small imbalance at the 1.34010 range before making a bigger retracement down. We also have a triple bottom forming at 1.3362 area which supports a move to the upside.
UK Inflation Eases, But Pound StrengthensThe British Pound rose above $1.34 on Tuesday, its highest level in seven months, supported by broad dollar weakness. This gain came despite UK inflation softening more than expected, with headline CPI at 2.6% and services inflation down to 4.7%. Easing price pressures led markets to raise expectations for Bank of England rate cuts, now pricing in 86 basis points of easing by year-end, with a fourth cut increasingly likely.
If GBP/USD breaks above 1.3430, resistance levels are at 1.3500 and 1.3550. Support is at 1.3300, followed by 1.3200 and 1.3050.

I'm selling GBPUSDWithout long talks so you will see it on time, enter this trade, you wont regret it.
A correction is eminent

GBPUSDRising wedge with bearish divergence, break of 1.3360 , which is the neckline of double top, break of this neckline starts the immediate sell pressure.

GBP/USD: The Wizard's Descent from the Double Top MountainGBP/USD: The Wizard's Descent from the Double Top Mountain
Technical Analysis:
GBP/USD 4H chart shows a clear Double Top formation at approximately 1.3725, a critical resistance level
The Treasure Hunter indicator has shifted color, signaling bearish momentum building (Hero taking damage)
Our Wizard's Journey progress bar indicates we're at 50% completion of the Mountain Pass, suggesting we're at a prime reversal point
Currently testing Elite Level 235 resistance zone (2345 XP), with declining XP Progress (35%)
Forecast:
Anticipating a significant pullback from current resistance
Initial Minion Zone at 1.3200 provides first target level
Watch for confirmation with HERO's Health declining from current 100%
Trading Strategy:
Short position opportunity forming with ELITE LvL 2 resistance rejecting price advance
Stop loss placement above Double Top at 1.3750
Risk/reward favorable with multiple support levels to target
Watch 4H candle closes below 1.3690 for entry confirmation
Quest Status: Active - Prepare for the wizard's descent from the mountain peak!

GBP-USD Short From Resistance! Sell!
Hello,Traders!
GBP-USD went up sharply
Made a retest of the
Horizontal resistance level
Of 1.3432 from where we
Are already seeing a local
Bearish reaction so we
Are locally bearish biased
And we will be expecting
A local bearish correction
Sell!
Comment and subscribe to help us grow!
Check out other forecasts below too!
Disclosure: I am part of Trade Nation's Influencer program and receive a monthly fee for using their TradingView charts in my analysis.

GBP/USD M15 – Breakout AlertGBP/USD M15 – Breakout Alert
The GBP/USD pair on the 15-minute timeframe is showing a potential buying opportunity following the breakout of a consolidation pattern. This breakout indicates a possible shift in momentum to the upside, increasing the likelihood of continued bullish movement in the near term.
Trade Idea – Long Setup:
Entry: Consider entering around the trendline zone of the breakout pattern (approx. 1.32200–1.32300).
Target 1: 1.33214
Target 2: 1.33600
Stop Loss: Below recent structure low or Ichimoku cloud support.
This setup is backed by momentum indicators and breakout structure. Keep an eye on volume and price action near the entry zone for confirmation.
If you find this analysis helpful, please hit the like button and drop a comment to support!
Your engagement motivates me to keep sharing more setups and insights.
Best regards,
JAMES_GOLD_MASTER_MQL5

#GBPUSD #IDEA#GBPUSD #IDEA On GU idea i will looking for sell by using M3 For entry and Aim for M15 low that is a SELLSIDE resting Belovw\e

GBPUSD SHORT FORECAST Q2 W17 D23 Y25GBPUSD SHORT FORECAST Q2 W17 D23 Y25
Professional Risk Managers👋
Welcome back to another FRGNT chart update📈
Diving into some Forex setups using predominantly higher time frame order blocks alongside confirmation breaks of structure.
Let’s see what price action is telling us today!
🔑 Remember, to participate in trading comes always with a degree of risk, therefore as professional risk managers it remains vital that we stick to our risk management plan as well as our trading strategies.
📈The rest, we leave to the balance of probabilities.
💡Fail to plan. Plan to fail.
🏆It has always been that simple.
❤️Good luck with your trading journey, shall see you at the very top.
🎯Trade consistent, FRGNT X

Bearish reversal off overlap resistance?The Cable (GBP/USD) is rising towards the pivot which is an overlap resistance and could reverse to the 1st support.
Pivot: 1.3417
1st Support: 1.3102
1st Resistance: 1.3637
Risk Warning:
Trading Forex and CFDs carries a high level of risk to your capital and you should only trade with money you can afford to lose. Trading Forex and CFDs may not be suitable for all investors, so please ensure that you fully understand the risks involved and seek independent advice if necessary.
Disclaimer:
The above opinions given constitute general market commentary, and do not constitute the opinion or advice of IC Markets or any form of personal or investment advice.
Any opinions, news, research, analyses, prices, other information, or links to third-party sites contained on this website are provided on an "as-is" basis, are intended only to be informative, is not an advice nor a recommendation, nor research, or a record of our trading prices, or an offer of, or solicitation for a transaction in any financial instrument and thus should not be treated as such. The information provided does not involve any specific investment objectives, financial situation and needs of any specific person who may receive it. Please be aware, that past performance is not a reliable indicator of future performance and/or results. Past Performance or Forward-looking scenarios based upon the reasonable beliefs of the third-party provider are not a guarantee of future performance. Actual results may differ materially from those anticipated in forward-looking or past performance statements. IC Markets makes no representation or warranty and assumes no liability as to the accuracy or completeness of the information provided, nor any loss arising from any investment based on a recommendation, forecast or any information supplied by any third-party.

GBP/USD MAY SEE A PUSH TO THE DOWN SIDE. The first quarter 0f 2025 was marked with a long ride to the upside for the GBP/USD market.
As the second quarter approaches we might see a change in the market character, as the market as reached an Order Block in the weekly Time frame.
I predict the market should dropped to 1.26000 region.
Stop Loss : 1.33040
Take Profit : 1.26000
That is over 700pips to the downside


Breakout (fully closed outside)confirmation To enter safely wait for a candle to fully close outside those rectangle OR wait for a candle to close outside, let go down just wait so a completely rest. There must be rejection in order to see that the market want to go down
