GU SELL SETUP After break of structure a resistance formation was made which leads to a sell. Sell on a resistance
GBPUSD.P trade ideas

GBPUSDlooking for short my entry price will b 1.3265
n profit target im looking at 1.2521
lets see where its take us ,just an idea to share

GBPUSDGBPUSD still showing some strength and needs more upside before any drop.
Disclosure: We are part of Trade Nation's Influencer program and receive a monthly fee for using their TradingView charts in our analysis.

EURUSD and GBPUSD Analysis todayHello traders, this is a complete multiple timeframe analysis of this pair. We see could find significant trading opportunities as per analysis upon price action confirmation we may take this trade. Smash the like button if you find value in this analysis and drop a comment if you have any questions or let me know which pair to cover in my next analysis.

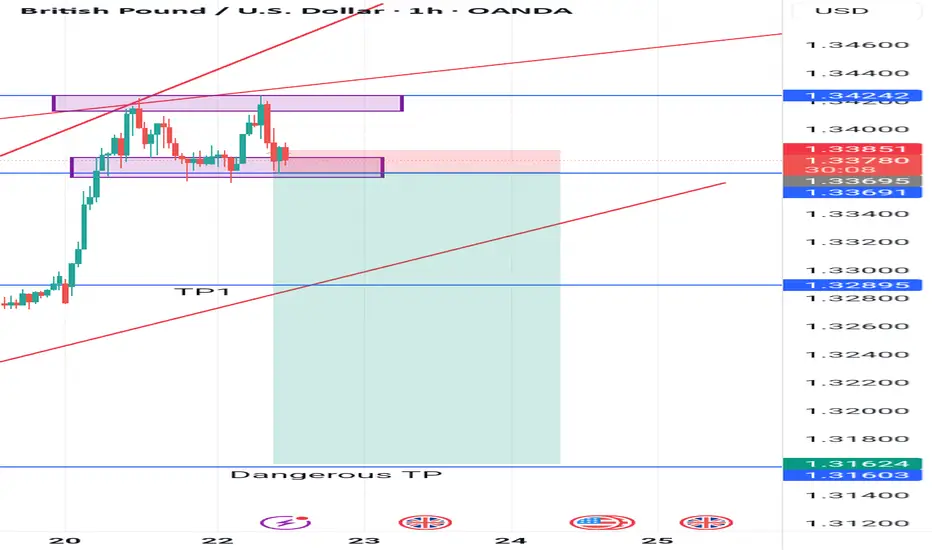
Breakout and retest The market is consolidating, bouncing on our support and resistance. ON a daily timeframe you can see a double top ,even on H1. The confusing thing is on the day we are in a uptrend movement, so in order to see if the market is selling now it must break our support once our support becomes our resistance we sell . Use TP1 to be safe ,use a trailstop if you will going for TP2
Super Short then Super Long!Hello all. I think market is making subwaves for a big picture. Market passed some very important levels and needs to go higher. A Critical zone can push the price lower and then a Node can cause the price to jump. be happy and have a nice life* (wink)

GBP/USD Ready for Takeoff!Hi Traders ! Price action remains strong within the uptrend channel, supported by the 20 EMA, while the 200 EMA stays well below—confirming bullish momentum.
Target zone: 1.34234
RSI shows strength with more room to rise.
Stay sharp, traders! If the price continues to respect the channel, we might see a strong bullish push soon.
📌 Disclaimer:
This content is for educational and informational purposes only and does not constitute financial advice. Always do your own analysis and consult with a professional before making trading decisions.

GBPUSD Let’s see if sellers step in.GBP/USD Trade Update: Holding My Sell at 1.32480
I entered a sell trade at 1.32480, expecting a reversal based on key technical and fundamental setups. But with GBP/USD now sitting at 1.33814, I have to reassess market conditions while still staying true to my trading approach.
Fundamental Overview – Why I Still Favor Downside
This week’s economic events could create volatility, and I’m paying close attention to:
UK PMI (April 23): Expected declines in Manufacturing (44.1) and Services (51.0) suggest economic weakness, which could weigh on GBP.
US Durable Goods Orders (April 24): Mixed expectations—headline at +1.8%, but ex-defense and transportation are negative, meaning uncertainty in USD strength.
UK Retail Sales (April 25): Forecasted at -0.3%, signaling weaker consumer spending. This aligns with my sell bias, as slowing UK economic data could trigger renewed selling pressure.
If the UK data disappoints, GBP/USD could struggle to hold higher levels, reinforcing my trade.
Technical & Price Action Analysis
Resistance Holding at 1.342–1.345:
Strong resistance is forming here. If bulls fail to push past this zone, my sell trade could still play out.
Wick formations near this level suggest some rejection, but confirmation is needed.
Key Support Levels for a Potential Drop:
1.330–1.331 (Flipped Resistance, Now Support) – Watching if price retests this zone.
1.326–1.327 (Major Support) – If momentum shifts, price could revisit this area.
1.321 (Stronger Support) – If price weakens further, this becomes my downside target.
Momentum is slowing, but the bullish trend is still intact unless price rejects at 1.342–1.345.
Volume Profile & Institutional Behavior – Are Big Players Selling?
Signs of Institutional Unloading:
Buy-side orders appear strong, but price is not breaking higher with conviction. This could mean large traders are selling into the rally.
Watching for a delta imbalance where buyers dominate order flow, but price fails to rise. This is a classic distribution sign.
Why This Matters: If institutions are offloading positions near 1.342–1.345, we could see price stall and reverse. My focus is on whether this resistance holds or breaks. That will define whether my sell trade remains valid.
My Trade Management Plan – Staying Patient
As a daily trader, I wait for the daily candle close before making adjustments.
If price rejects 1.342–1.345, I’ll hold my position with targets back toward 1.330–1.327.
If price breaks above resistance and holds, I may need to reevaluate my stop-loss placement.
Final Thoughts – Trusting My Process
I’m still holding my sell at 1.32480, but I recognize that buyers are testing key resistance. If institutions are quietly distributing, we could see a shift back to the bearish side, but I’m waiting for confirmation at the daily close.
I’ll update once the daily candle closes. Let’s see if sellers step in.

GBPUSD💡Chart analysis of the GBP/USD currency pair (daily timeframe). Ascending Channel The price is moving within a clear ascending channel. This reflects a recent upward trend. The upper boundary of the channel represents resistance, and the lower boundary represents support.
Supply Zone Illustrated in red above the chart. This is an area that has previously experienced strong selling pressure, and the price is expected to encounter resistance there. The price is currently in this area, which could indicate a potential reversal. MACD Indicator There is no current indication of a clear reversal or weakening trend. However, since the price has reached a strong supply zone, the indicator may slow down or signal a reversal soon.
⛔️Not investment advice. For educational purposes only.

DeGRAM | GBPUSD Strengthening Pound📊 Technical Analysis
- Uptrending channel
The GBP/USD pair is moving steadily within the ascending channel, having recently tested key support levels (“break and retest”).
- Key Resistance
Immediate resistance at $1.32; a break of this level means further strengthening of bullish sentiment.
- Predicted Scenario
A confirmed break above $1.32 opens the way to 1.33.
Fundamental Analysis 💡
Strong UK wage growth (5.9%) and GDP growth (0.5%) support GBP strength. A weaker USD amid easing trade tensions also favors GBP/USD.
✨ Summary
Positive fundamentals complement a clear bullish technical situation. Keep a close eye on a break above $1.32 to confirm the continuation of GBP/USD upside!
-------------------
Share your opinion in the comments and support the idea with a like. Thanks for your support!

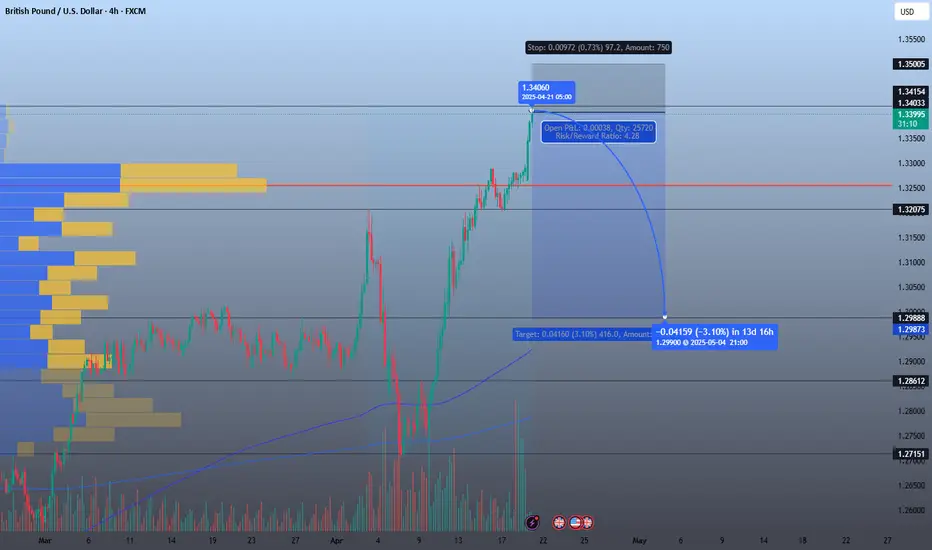
Sell OpportunityGBP/USD Sell Setup – Strong Rejection at Key Resistance
Entry: 1.3406
TP: 1.2990
SL: 1.3500
RR: 4.28
Analysis:
Price hit a strong resistance zone with heavy volume profile rejection and long-wick candle, indicating possible exhaustion. After an extended rally, a retracement is expected. Clean structure breakdown could take price back to the 1.3000 psychological level.
Bias: Bearish
Timeframe: 4H
Outlook: Short to mid-term (1–2 weeks)
Daily Analysis for GBP/USD📊 Daily Analysis for GBP/USD
🔼 The pair is currently in a strong uptrend with no clear signs of a downside reversal.
📉 We are waiting for a corrective move down to the identified demand zones, where we will look for buying opportunities.
🎯 The target is the supply zone marked in grey on the chart.
✅ Recommendation: Buy after the correction with proper risk management.

Current lastweek #Intraweek trade.Gbpusd lastweek.
MON_FRI
My view on this pair using SMC model.
The trend is your friend.
It Was a good trade.
We try again next week.

GBP/USD M15 – Breakout AlertGBP/USD M15 – Breakout Alert
The GBP/USD pair on the 15-minute timeframe is showing a potential buying opportunity following the breakout of a consolidation pattern. This breakout indicates a possible shift in momentum to the upside, increasing the likelihood of continued bullish movement in the near term.
Trade Idea – Long Setup:
Entry: Consider entering around the trendline zone of the breakout pattern (approx. 1.32200–1.32300).
Target 1: 1.33214
Target 2: 1.33600
Stop Loss: Below recent structure low or Ichimoku cloud support.
This setup is backed by momentum indicators and breakout structure. Keep an eye on volume and price action near the entry zone for confirmation.
If you find this analysis helpful, please hit the like button and drop a comment to support!
Your engagement motivates me to keep sharing more setups and insights.
Best regards,
JAMES_GOLD_MASTER_MQL5

GBPUSD - Tariffs Are Great For The United KingdomYou'd think that with all the tariffs being imposed on different countries, including the UK, the currency market would take a freefall....
So we all thought... Since the beginning of January 2025, Cable has been on a raging rally, gaining close to 10% if you were holding sterling in comparison to the US dollar.
With the 90 days hold on tariffs in full swing, will cables sentiment change in the near term?

GBPUSD Sell GBP Index has big gap , which has to be filled at some point . USD had massive loss yesterday we have to retest at some point . GBPUSD 30 min and 1 H timeframe made silver bullet strategy to the downside that means we have chance to move down massive today
4 RRR
GL Traders
NOT ADVICE !

GBPUSD Long - 80% probabilityWeekly candle bullish will reach weekly highs
Stop behind H4 Swing SR Level
80% probability trade, 1.9:1 RR trade.

GBPUSD Short 4/22/2025GBP/USD Short Setup – Multi-Timeframe Rejection at September High
We're entering a short on GBP/USD based on a clean confluence of structure, pattern, and timing.
Daily Chart:
Price is rejecting a key resistance level from the week of September 20–27 — the high from that week has now been tapped five times in the last week, with today marking yet another rejection.
Intraday Timing:
Yesterday (Monday): London session tapped the September high.
Today (Tuesday): Pre-London rally hit that same level and failed again.
This sets the tone for a double-tap liquidity run that’s now looking exhausted.
4H Chart:
Bearish rejection wick is forming (potential hammer) — still two hours left, but current structure suggests selling pressure off the highs.
1H Chart:
We’ve printed a clean double top, and the most recent candle is closing as a bearish engulfing, rejecting straight off the key zone.
Entry: 1.33932
Stop: 1.34303
Target 1 (conservative): 1:1.2 R:R — midline from Sunday’s Asia session.
Target 2 (extension): 1.32986 — a clear structural level and liquidity pocket from previous demand.
With momentum turning and buyers failing to break higher despite multiple attempts, this setup leans heavily bearish for the next few sessions

#GBPUSD #IDEAGu today i looking for a selling on M15 to in order Gu pullback to rebalance market back
i will wait on M3 or M5 to show some selling model before deside to sell

DOW Theory GBPUSD 1 hour time frame Higher Highs and Higher LowsDOW Theory GBPUSD 1 hour time frame Higher Highs and Higher Lows
Entry Point for Long trade on the break of Last Higher High.
1 percent risk for 1 percent reward

GBPUSD Short Ideia - Still expecting more from this trade.I still expect more drops from GU. I will post soon a second entry point suggestion for NY Session. Lets goooooo

Weekly Forex Market Analysis:GBPUSD–Issue 207(FreeThe analyst predicts that the GBP/USD rate will increase within the time specified on the countdown timer. This prediction is based on a quantitative analysis of the price trend
___Please note that the specified take-profit level does not imply a prediction that the price will reach that point. In this framework of analysis and trading, unlike the stop-loss, which is mandatory, setting a take-profit level is optional. Whether the price reaches the take-profit level or not is of no significance, as the results are calculated based on the start and end times. The take-profit level merely indicates the potential maximum price fluctuation within that time frame.

GBPUSD INTRADAY bullish breakout supported at 1.3288GBP/USD maintains a bullish bias, with the broader trend and structure supporting upside continuation. The recent intraday move appears to be a bullish breakout toward a key prior consolidation area.
Key Support: 1.3288 – aligns with the previous consolidation zone and potential bullish inflection point.
Upside Targets:
1.3435 – initial resistance level
1.3500 and 1.3580 – medium to long-term bullish targets
If price finds support at 1.3288 and forms a bullish reversal, it would confirm the continuation of the uptrend toward the mentioned resistance levels.
However, a break and daily close below 1.3288 would invalidate the bullish scenario, suggesting deeper retracement toward 1.3210, with further support at 1.3120 and 1.2980.
Conclusion
GBP/USD remains bullish above 1.3288. Look for a bounce from this level to confirm upside continuation. A daily close below 1.3288 would turn the outlook bearish, exposing lower support levels.
This communication is for informational purposes only and should not be viewed as any form of recommendation as to a particular course of action or as investment advice. It is not intended as an offer or solicitation for the purchase or sale of any financial instrument or as an official confirmation of any transaction. Opinions, estimates and assumptions expressed herein are made as of the date of this communication and are subject to change without notice. This communication has been prepared based upon information, including market prices, data and other information, believed to be reliable; however, Trade Nation does not warrant its completeness or accuracy. All market prices and market data contained in or attached to this communication are indicative and subject to change without notice.
