GBPUSD I Weekly CLS Model 2 I Target CLS LowHey, Market Warriors, here is another outlook on this instrument
If you’ve been following me, you already know every setup you see is built around a CLS range, a Key Level, Liquidity and a specific execution model.
If you haven't followed me yet, start now.
My trading system is completely mechanical — designed to remove emotions, opinions, and impulsive decisions. No messy diagonal lines. No random drawings. Just clarity, structure, and execution.
🧩 What is CLS?
CLS is real smart money — the combined power of major investment banks and central banks moving over 6.5 trillion dollars a day. Understanding their operations is key to markets.
✅ Understanding the behaviour of CLS allows you to position yourself with the giants during the market manipulations — leading to buying lows and selling highs - cleaner entries, clearer exits, and consistent profits.
🛡️ Models 1 and 2:
From my posts, you can learn two core execution models.
They are the backbone of how I trade and how my students are trained.
📍 Model 1
is right after the manipulation of the CLS candle when CIOD occurs, and we are targeting 50% of the CLS range. H4 CLS ranges supported by HTF go straight to the opposing range.
📍 Model 2
occurs in the specific market sequence when CLS smart money needs to re-accumulate more positions, and we are looking to find a key level around 61.8 fib retracement and target the opposing side of the range.
👍 Hit like if you find this analysis helpful, and don't hesitate to comment with your opinions, charts or any questions.
⚔️ Listen Carefully:
Analysis is not trading. Right now, this platform is full of gurus" trying to sell you dreams based on analysis with arrows while they don't even have the skill to trade themselves.
If you’re ever thinking about buying a Trading Course or Signals from anyone. Always demand a verified track record. It takes less than five minutes to connect 3rd third-party verification tool and link to the widget to his signature.
"Adapt what is useful, reject what is useless, and add what is specifically your own."
— David Perk aka Dave FX Hunter ⚔️
GBPUSD trade ideas

GBPUSD: First red dayHello traders and welcome back on this analysis regarding GBPUSD, as always I never try to predict the direction of the market, long and short are only the setup I'm currently looking for, during the day.
I use technical analysis exclusively to find a proper risk reward for my trades, eventually I position myself in the market.
GBPUSD looks currently pretty interesting to me, and I'm looking to complete a pump and dump template started on Monday.
Just few words about the previous week, the previous Tuesday which placed the weekly high, it's a level which began an interesting bearish move, and currently the market is retesting that level.
The previous Tuesday and Wednesday placed the weekly range, and I'm gonna see how the price will behave on the extreme.
This week, last week of April, I can see on Monday a strong impulsive move, which is our pump for the weekly template, the market triggered long breakout traders and closed as well above the previous week high, other time frames/big players are involved on further movements.
Tuesday, the market stayed pretty much inside, it kinda triggered the daily high, but the most important signal to me, is that it closed as a first red day after a full day of consolidation up high.
Today, a bearish move looks like has already started, but considering still plenty of space down low, I can still be looking for further downward move.
Major red news are on schedule at 10am NYT, so no action will be taken before that time.
However I will be looking for the market to pump up 25/50pip, coiling for an explosive bearish move, targeting the low of Monday (which would eventually complete the weekly pump and dump), and potentially trailing a partial even lower.
I will update this post after the news at 10am NYT
Gianni

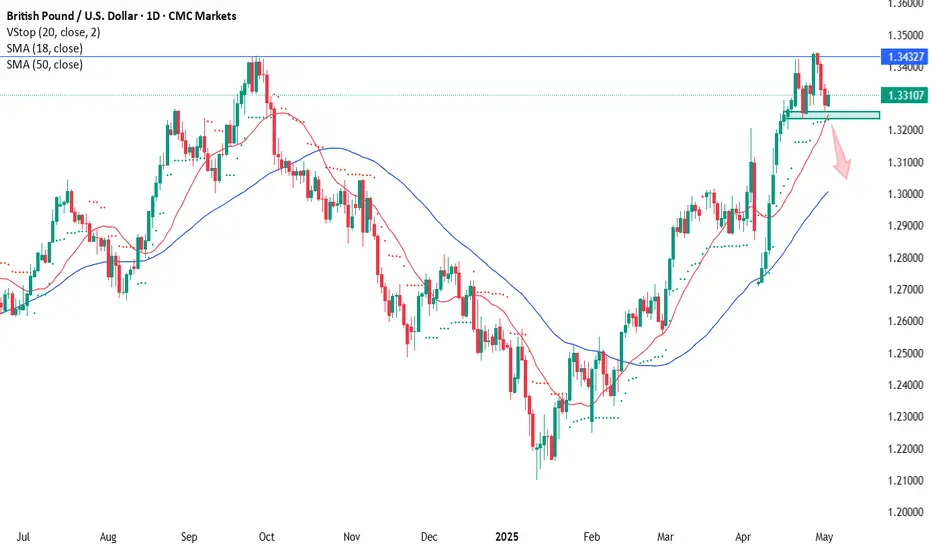
GBP/USD Short Trade Setup: Reversal from 1.34370 with Target at Entry Point:
Marked at 1.34370, where the analyst anticipates a reversal or price rejection.
Stop Loss:
Positioned above at 1.34975, covering a 2.62% risk margin. This is a protective level in case the price moves against the trade.
Target (Take Profit):
Set at 1.31015, just above a strong support zone around 1.30818. This is where the analyst expects the price to eventually fall.
Resistance Point:
Noted around 1.33007 – 1.32859, acting as an intermediate level of interest and possible price reaction zone.

GBPUSD BULLISH OR BEARISH DETAILED ANALYSISGBPUSD is currently trading around 1.33400 and is displaying a promising bullish setup. The price action is coiling within a symmetrical triangle, which typically signals a potential breakout. A clear bullish structure has already formed following the recent impulse wave, and with the consolidation tightening, we are now closely watching for a breakout to the upside. The expected bullish breakout aligns with the projected target of 1.36000, offering a strong risk-reward opportunity for trend-following traders.
From a fundamental standpoint, the British pound is showing resilience despite broader dollar strength. Recent comments from the Bank of England have maintained a cautious yet firm tone regarding inflation control, hinting at the potential for rates to stay elevated longer than markets previously priced in. Meanwhile, the U.S. dollar index has seen some pressure amid mixed economic data and increasing speculation that the Federal Reserve may hold rates steady in the upcoming sessions.
Technically, GBPUSD remains well-supported above the 1.32500 level, with buyers defending key horizontal and trendline support areas. The recent compression in price suggests that volatility is about to expand, typically favoring the direction of the initial trend, which in this case remains bullish. Momentum indicators are beginning to curl higher, further supporting a breakout scenario.
In summary, GBPUSD is setting up for a high-probability bullish continuation. A confirmed breakout from the triangle could ignite a fresh rally toward 1.36000, especially if supported by dovish Fed rhetoric and firm UK economic sentiment. This setup is one to watch closely as it aligns both technically and fundamentally, positioning it as a favorable opportunity for medium-term swing trades.

GBPUSD Daily CLS Nested in Weekly CLS, Model 2 at 61.8Hey, Market Warriors, here is another outlook on this instrument
If you’ve been following me, you already know every setup you see is built around a CLS range, a Key Level, Liquidity and a specific execution model.
If you haven't followed me yet, start now.
My trading system is completely mechanical — designed to remove emotions, opinions, and impulsive decisions. No messy diagonal lines. No random drawings. Just clarity, structure, and execution.
🧩 What is CLS?
CLS is real smart money — the combined power of major investment banks and central banks moving over 6.5 trillion dollars a day. Understanding their operations is key to markets.
✅ Understanding the behaviour of CLS allows you to position yourself with the giants during the market manipulations — leading to buying lows and selling highs - cleaner entries, clearer exits, and consistent profits.
🛡️ Models 1 and 2:
From my posts, you can learn two core execution models.
They are the backbone of how I trade and how my students are trained.
📍 Model 1
is right after the manipulation of the CLS candle when CIOD occurs, and we are targeting 50% of the CLS range. H4 CLS ranges supported by HTF go straight to the opposing range.
📍 Model 2
occurs in the specific market sequence when CLS smart money needs to re-accumulate more positions, and we are looking to find a key level around 61.8 fib retracement and target the opposing side of the range.
👍 Hit like if you find this analysis helpful, and don't hesitate to comment with your opinions, charts or any questions.
⚔️ Listen Carefully:
Analysis is not trading. Right now, this platform is full of gurus" trying to sell you dreams based on analysis with arrows while they don't even have the skill to trade themselves.
If you’re ever thinking about buying a Trading Course or Signals from anyone. Always demand a verified track record. It takes less than five minutes to connect 3rd third-party verification tool and link to the widget to his signature.
"Adapt what is useful, reject what is useless, and add what is specifically your own."
— David Perk aka Dave FX Hunter ⚔️

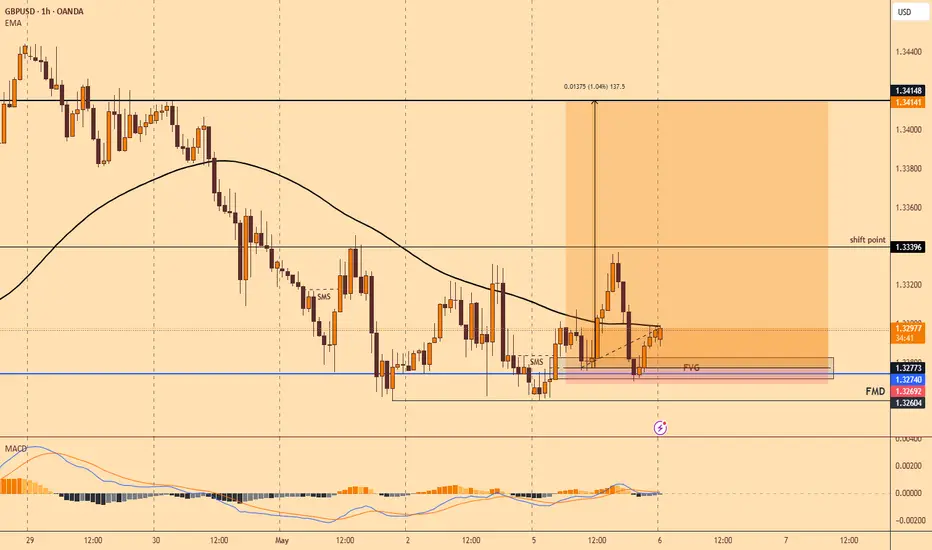
#GBPUSD: Major Swing Sell Coming On GU, What's your views? OANDA:GBPUSD , as discussed in our previous analysis, where we predicted price would reach our target area and then reject it. The price has almost reached this area, and we are now waiting for it to fully complete the move so that we can take a swing sell on the GBP. Currently, the British pound is stronger and bullish due to the UK’s strong economic growth. However, this is not the case for the US dollar. The dollar is struggling to keep up with other currencies and is currently the worst-performing currency of the month of April.
While focusing on GBPUSD as a pair, it has been extremely bullish since the start of April. However, we are now at a point where there are no strong reasons for the pair to remain bullish and continue its uptrend. There are fundamental signs that will eventually reverse the bearish trend.
Our advice to all is to wait for the price to do its thing. Once it reaches our target area, it may show strong bearish dominance. However, this is not a guarantee that it will behave as we expect. There are two targets that you can focus on once you trade is activated.
Good luck and trade safely!
Thank you for your unwavering support! 😊
If you’d like to contribute, here are a few ways you can help us:
- Like our ideas
- Comment on our ideas
- Share our ideas
Team Setupsfx_
❤️🚀

GBPUSD breakout could target 1.47GBPUSD is testing key resistance and may be gearing up for a breakout toward 1.47, with a potential 17:1 reward. Even if it reaches just a third of that move, the setup remains highly attractive.
This content is not directed to residents of the EU or UK. Any opinions, news, research, analyses, prices or other information contained on this website is provided as general market commentary and does not constitute investment advice. ThinkMarkets will not accept liability for any loss or damage including, without limitation, to any loss of profit which may arise directly or indirectly from use of or reliance on such information.

GBP/USD Short Trade Setup – Targeting 1.31580 from 1.34281Entry Point: 1.34281
Stop Loss: 1.34554 (about 27 pips above entry)
Target Points:
Target One: 1.32698
Final Target (EA Target Point): 1.31580 (approx. 270 pips from entry)
Risk/Reward Ratio: Favorable, given the tight stop and wider target.
📈 Chart Features
Highlighted Zones:
Resistance Zone (top purple area): A strong supply zone, where price reversed multiple times.
Support Zone (bottom purple area): Historical demand zone, previous price reactions.
Orange Circles: Represent key swing highs and lows (likely used to confirm the zones or a double/triple top/bottom pattern).
Moving Averages:
Red Line: Likely a shorter-period MA (e.g., 20 EMA).
Blue Line: Likely a longer-period MA (e.g., 50 or 200 EMA), often used for trend confirmation.
🧠 Interpretation
Price Action: The chart suggests the price recently hit a resistance zone and is expected to reverse.
Trade Bias: Bearish – expecting the market to drop from the resistance.
Indicators Support:
Price has rejected multiple times at the top.
Entry is slightly below resistance, confirming a potential reversal.
Targets align with support and past consolidation zones.

GU-ID 0125GU is been bullish on th HTF. After the last BOS to the upside, market pulled back down to discount zone. Now that price has taken out a significant low, it is showing bullish strengths. 4-H OB is being formed and I'm taking this buy from the OB targeting the last swing high

GBPUSD I Weekly CLS, KL - M OB, Model 1 , Target 50% CLSHey, Market Warriors, here is another outlook on this instrument
If you’ve been following me, you already know every setup you see is built around a CLS range, a Key Level, Liquidity and a specific execution model.
If you haven't followed me yet, start now.
My trading system is completely mechanical — designed to remove emotions, opinions, and impulsive decisions. No messy diagonal lines. No random drawings. Just clarity, structure, and execution.
🧩 What is CLS?
CLS is real smart money — the combined power of major investment banks and central banks moving over 6.5 trillion dollars a day. Understanding their operations is key to markets.
✅ Understanding the behaviour of CLS allows you to position yourself with the giants during the market manipulations — leading to buying lows and selling highs - cleaner entries, clearer exits, and consistent profits.
🛡️ Models 1 and 2:
From my posts, you can learn two core execution models.
They are the backbone of how I trade and how my students are trained.
📍 Model 1
is right after the manipulation of the CLS candle when CIOD occurs, and we are targeting 50% of the CLS range. H4 CLS ranges supported by HTF go straight to the opposing range.
📍 Model 2
occurs in the specific market sequence when CLS smart money needs to re-accumulate more positions, and we are looking to find a key level around 61.8 fib retracement and target the opposing side of the range.
👍 Hit like if you find this analysis helpful, and don't hesitate to comment with your opinions, charts or any questions.
⚔️ Listen Carefully:
Analysis is not trading. Right now, this platform is full of gurus" trying to sell you dreams based on analysis with arrows while they don't even have the skill to trade themselves.
If you’re ever thinking about buying a Trading Course or Signals from anyone. Always demand a verified track record. It takes less than five minutes to connect 3rd third-party verification tool and link to the widget to his signature.
"Adapt what is useful, reject what is useless, and add what is specifically your own."
— David Perk aka Dave FX Hunter ⚔️

GBP/USD - Watch out for a possible rejection!The British pound is currently moving towards the upside, showing a gradual but steady climb. However, it is approaching a significant resistance area that could pose a challenge to further gains.
-------------------------------
Double top
This resistance zone was previously a strong support level before the market formed a double top pattern and subsequently broke below it. As is often the case in technical analysis, this former support has now flipped into resistance, making it a key area where price could face strong selling pressure and potential rejection.
-------------------------------
1h FVG
Adding to the confluence, this resistance zone aligns closely with a 1h Fair Value Gap (FVG). FVGs often attract price back into them before a reaction occurs, making this area even more significant for a potential reversal.
-------------------------------
Golden Pocket
Just below the FVG lies the "Golden Pocket", the 61.8% Fibonacci retracement level from the most recent drawdown. The Golden Pocket is one of the most closely watched Fibonacci levels by traders and is known for its strong influence on price action. Its proximity to the current structure increases the likelihood of a notable reaction, as many market participants will be watching this area closely for signs of rejection.
-------------------------------
Conclusion
Overall, the combination of previous support-turned-resistance, the 1-hour FVG, and the Golden Pocket retracement forms a high-probability zone where the British pound could encounter heavy resistance and a potential downside move.
-------------------------------
Thanks for your support.
- Make sure to follow me so you don't miss out on the next analysis!
- Drop a like and leave a comment!

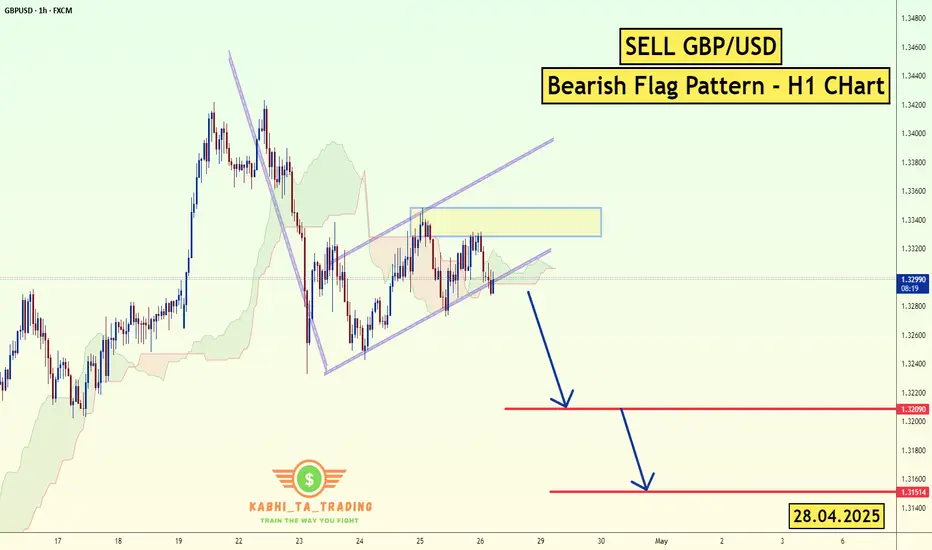
GBP/USD - H1 - Bearish Flag (28.04.2025)FX:GBPUSD The GBP/USD Pair on the H1 timeframe presents a Potential Selling Opportunity due to a recent Formation of a Bearish Flag Pattern. This suggests a shift in momentum towards the downside in the coming hours.
Possible Short Trade:
Entry: Consider Entering A Short Position around Trendline Of The Pattern.
Target Levels:
1st Support – 1.3209
2nd Support – 1.3151
🎁 Please hit the like button and
🎁 Leave a comment to support for My Post !
Your likes and comments are incredibly motivating and will encourage me to share more analysis with you.
Best Regards, KABHI_TA_TRADING
Thank you.
Fundamental Update :
on Monday as the trade tensions between the U.S. and China provided some relief to investors, while a stronger dollar further weighed on prices.
The U.S. dollar TVC:DXY rose 0.2% against a basket of currencies, making bullion more expensive for overseas buyers. TVC:DJI SP:SPX NASDAQ:IXIC also rising .
GBPUSD COT and Liquidity AnalysisCOT Report Analysis:
Overall we can see strong bullish sentiment in the COT.
and price will most likely continue higher- in the longterm.
Longs 91K, Short 67K We can see longs decreasing = profit taking and pullback needed
to rebuild. There is no heavy shorting = market is still Bullish , but long will be rebuild in lower
prices.
Hey what up traders welcome to the COT data and Liquidity report. This is a big part of my FX Trading. Im always trying to trade with the Big players so knowing their positions is good thing.
Please be aware that institutions report data to the SEC on Tuesdays and data are reported on Fridays - so again we as retail traders have disadvantage, but there is possibility to read between the lines. Remember in the report is what they want you to see, that's why mostly price reverse on Wednesday after the report so their cards are hidden as long as possible. However if the trend is running you can read it and use for your advantage.
I created this simple free indicator which you can find in the my scripts. It's highlighting the day of the real report - Tuesday.
Here is the tip if the level has confluence with the high volume on COT it can be strong support / Resistance.
Analysis done on the Tradenation Charts
Disclosure: I am part of Trade Nation's Influencer program and receive a monthly fee for using their TradingView charts in my analysis.
"Adapt what is useful, reject what is useless, and add what is specifically your own."
— David Perk aka Dave FX Hunter ⚔️

GBP-USD Local Long! Buy!
Hello,Traders!
GBP-USD is making a local
Correction but the pair will
Soon hit a horizontal support
Level of 1.3204 and as the pair
Is in the uptrend we will be
Expecting a local bullish
Rebound and a move up
Buy!
Comment and subscribe to help us grow!
Check out other forecasts below too!
Disclosure: I am part of Trade Nation's Influencer program and receive a monthly fee for using their TradingView charts in my analysis.

SellsA trading plan that id like to see play out,if we break the levels this could be the start of a nice drop

GBPUSD BULLSGBPUSD BULLS soon to be activated, we go long at the single tap and trde the long pull back.

GBPUSD ALLIGN WITH GOLD A POTENTIAL REVERSAL Because GBPUSD is in a strong uptrend and consolidating just below resistance, we can anticipate a breakout or buy the dip for continuation.

GBP/USD: Awaiting break below 1.3230For GBP/USD, the situation is similar to EUR/USD.
I’ll wait for confirmation of a further decline — specifically, a break below the support level at 1.3230 — before entering a short position.
I don’t see any alternative scenarios at the moment. There’s no long setup, and I don’t trade consolidation phases.
📝Trading plan:
Open a short position upon a break below 1.3230. The target is 1.3030.
GBPUSD SHORTMarket structure bearish on HTFs DH
Entry at both Weekly and Daily AOi
Weekly Rejection at AOi
Daily Rejection at AOi
Previous Structure point Daily
Around Psychological Level 1.33000
H4 EMA retest
H4 Candlestick rejection
Levels 4.49
Entry 90%
REMEMBER : Trading is a Game Of Probability
: Manage Your Risk
: Be Patient
: Every Moment Is Unique
: Rinse, Wash, Repeat!
: Christ is King.

GBP / USD Waiting for the breakout of the rising trend line and the close below the volume zone to enter the sell position.

GU-Thu-1/05/25 TDA-Possible bounce up from DR 1.32496?Analysis done directly on the chart
React to candles, you get to see how
really price is doing. It requires time and
effort, it's not easy!
Not financial advice, DYOR.
Market Flow Strategy
Mister Y

Bullish ScenarioH4 is bullish and on the m15 TF it made a shift is structure then a pullback to a FVG now we are expecting a rise in price up.
GBPUSD Swing Trade, BULLISHPrice Action tells me that GBPUSD is ready to climb once again, continuing it's bullish momentum. We are taking advantage of the range between the Swing Low and Swing High. Price has created a HH during the retracement, signaling Bulls are back in play. M15 finally showed bullish momentum during the retracement of the new HH. 3 Targets on the highs, last target being the Swing high.
