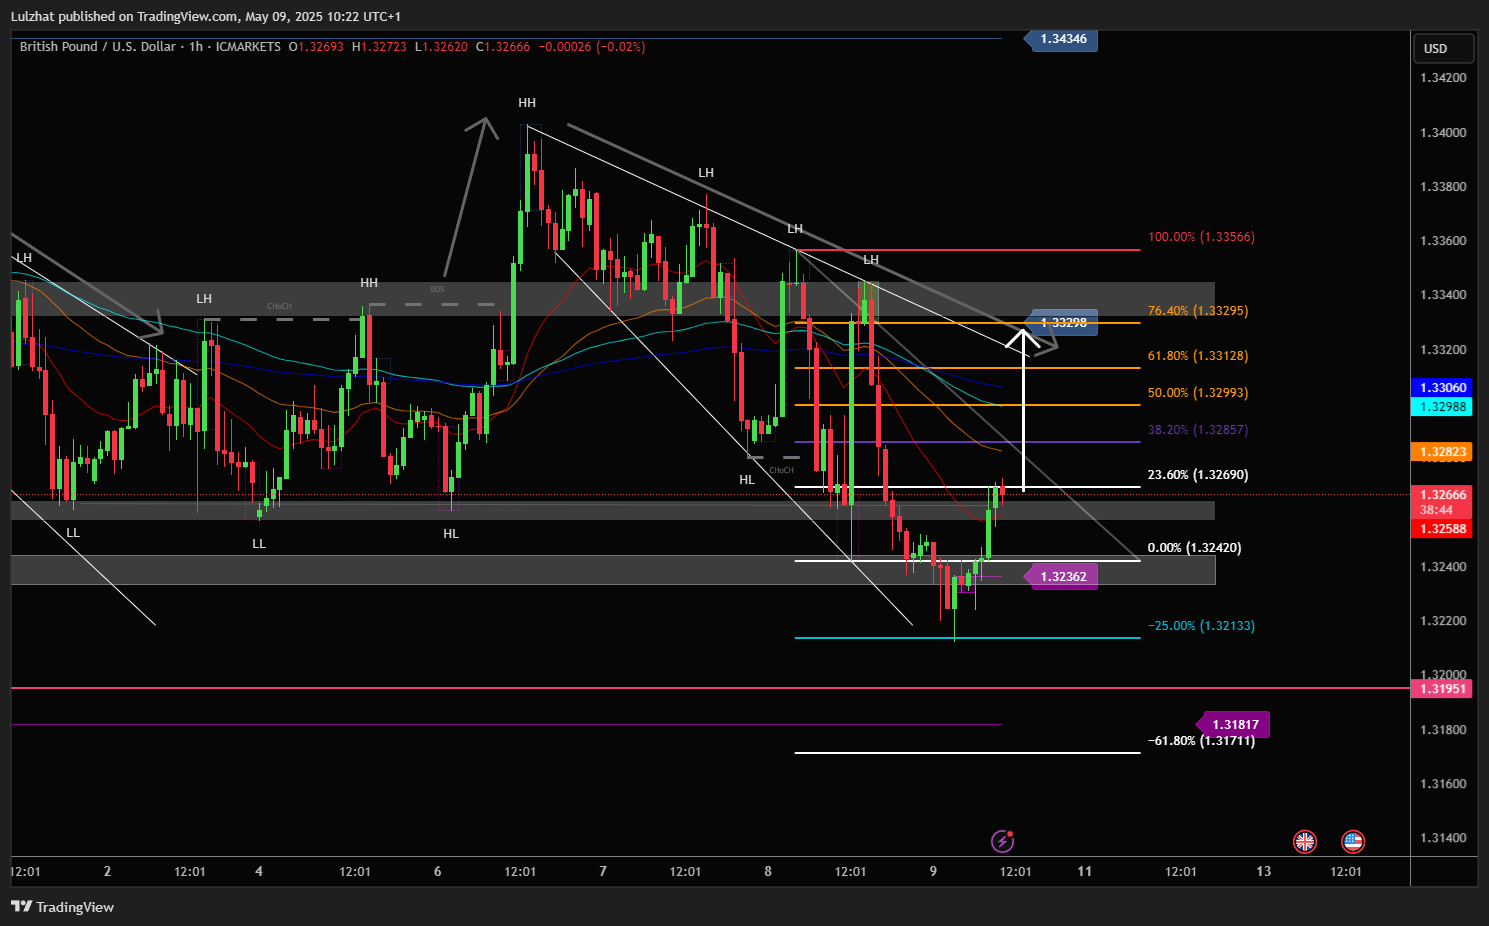
GBPUSD The monthly chart indicates a double top formation, with the weekly closing beneath the institutional zone. The daily chart is displaying the emergence of an M pattern. To successfully breach the monthly resistance, a retest is required.
GBPUSDIdea: GBPUSD 1h FORECAST Hello guys, let me tell you that this is our next move direction, this is our forecast weekly outlook, in which we are going to tell you to buy from here and our target will be up to the resistance area.