GMTUSDT_F4FB46 trade ideas

Bullish on $GMTWe are at a sensitive zone which has a breaker and a FVG.
In daily TF we are bullish.
Our ideal area for stoploss is below the OB+

GMT ANALYSIS (1D)It's been a long time since the correction started after GMT's heavy climbs ended.
When it was going up, it seemed like GMT would go up forever, but make no mistake, no ups or downs in the financial markets last forever.
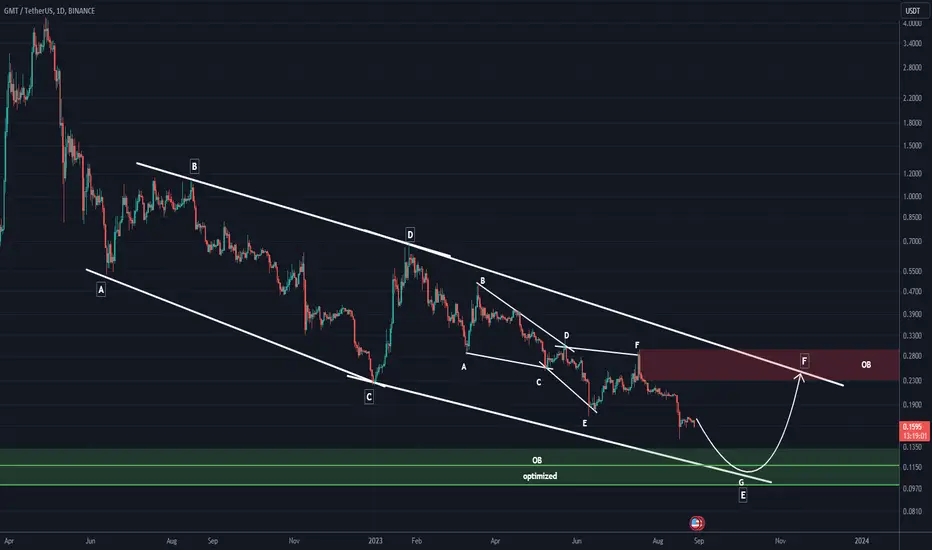
By examining the GMT waves in terms of price and time, we can see that we are in a downward and corrective diametric.
If we examine the corrective waves in more detail, we can get more details. So that the E wave of this large diameter itself has become a smaller diameter, and now we are inside the G wave of this smaller diameter.
The green area is where the major E branch of this major diametric can end and we enter the major F wave of this major diametric.
The optimized zone is the best zone for buy/long positions.
If the price only reached the green ob area and did not reach the optimized area and then gave bullish signs or confirmations, think about the buy/long position.
The red zone can be a safe zone target for F wave upward movements.
For risk management, please don't forget stop loss and capital management
Comment if you have any questions
Thank You
GMT/USDT is Ready For a Potential Correction | GMT AnalysisYello Paradisers, let's zoom in on GMT!
💎At the moment, it's oscillating within a specific range, and we're eyeing a potential downward breakout on the horizon.
💎If this breakout materializes as anticipated, it's likely to catalyze a swift corrective move.
💎Worth noting are the dual confirmed order blocks in the shorter timeframe. Due to existing liquidity, the price is projected to gravitate towards these levels.
💎In a previous cycle, what was once a demand zone flipped into a supply area, leading to a marked price decline and zeroing in on the prior Order Block (OB).
💎As always in the ever-fluid crypto landscape, staying alert and adaptable is your golden ticket. Keep your charts fresh and stay tuned for more updates. Happy trading!


GMTUSDT is collecting new liquidity?New Liquidity from $0.1681: The current market situation involves GMTUSDT attracting fresh liquidity from the $0.1681 price level. Liquidity often gathers at specific price points and can influence price movements.
Breakout Target: $0.1858 Area: According to the analysis, for a potential long trade, the price needs to establish a clear breakout above the $0.1858 area. A breakout signifies a substantial price movement beyond a significant resistance level, indicating the potential initiation of a bullish trend.
Plancton's Rules Application: In accordance with Plancton's Rules and aligned with the analysis, there is consideration of a new long position if the price successfully experiences the mentioned breakout. A long position involves acquiring the asset with the expectation of its price rising.

GMT MACRO ANALYSIS 2ND SCENARIO UPDATENZX:GMT scenario 2 seems to be the favorable scenario after scenario 1 after it has been invalidated (see the previous analysis for context)
Now I have a not entirely new scenario that stays in between scenarios 1 & 2. It means we're in some kind of Elliotewave Expanded Flat X-cyan on macro and we've just completed wave B-yellow of it ABC and we're about to begin wave C-yellow leading the price to at least $0.7
10 reactions to this post and I'll update it daily.
#cryptocurrencies #STEPN #GMT

GMTUSDTOpportunity for the crypto futures traders to go short on GMTUSDT at market price, first tp is 0.1975 while the second tp is 0.1811 and the trade will be invalidated at 0.2112

GMT LONG & SHORT TERMHello Traders and everyone, I am Hadi Karaali, Known as SNIPERS_FX
If you like the idea, do not forget to support with a like and follow.
GMT WHAT'S NEXT!
As we can see price is still around a strong support zone, where we will be looking for new longs from a long- and short-term perspective.
However, for the bulls to kick in from a long-term perspective we need a break above the marked major swing high from Daily time frame.
Meanwhile, from a shorter-term perspective price is sitting around a minor support zone which is our previous swing high broken upward,
Then for the bulls to kick in from a short-term we need a break above the marked swing high then a movement higher would be expected.
If you like this kind of analysis don't forget to like and follow
and as usual follow your trading plan and manage your risk.
Be patient and good luck!

Keep an eye on $GMT/USDTDid you find this crypto market analysis helpful? Stay updated about the latest crypto market update.
Please continue to follow my analysis and feel free to ask any queries, you may have. I am here to assist you.
TradingView: @FarmanBangashh

GMT/H4GMT token can move towards higher goals by maintaining this order block and collecting liquidity. (strong dependence on bitcoin trend).
En:0.2070
TP:0.25—0.30
Sl:close 2 4H candle below 0.19

#GMT/USDT is at crucial Support zone in 4-Hour TF!NZX:GMT needs to hold this zone to gain bullish momentum. Breakdown below this zone is a bearish sign for #GMTUSDT, and it can retest PML in coming days.

GMT break-out
GMT is breaking out its trendline since Mai 2022.
Volume indicators CMF and MFI are also breaking their trendline.
Massive pump is very likely, specially after the good news from XRP today (XRP named not a security).
Short-term TPs are Fib 0.236 and 0.382.
Mid-term TPs are Fib. 0.5 and 0.618.


GMTUSDT Daytrade Short 1st goal is .237
GMT is falling, 0.24 will fall also, around 24 it is a good short opportunity


GMT could go up?! As you can see, there's a slight bullish divergence on the 15 minute time frame where the lower lows of the Price Action are slanting downwards whereas the lower lows of the RSI and the CCI are slanting upwards.
I've bought GMT at $0.236.
Will update you guys if it does move UP from here.
As always, do your OWN EXTENSIVE research before buying anything.

GMT ascending triangleGmt is having a clean breakout after forming ascending triangle pattern on 4h chart
1d chart downtrend over
looking for a bull run from

Short $GMTNZX:GMT is close to a strong resistance, so a short will be good here. Use the following parameters:
Entry: 0.2610
TP: 0.2
SL: 0.278

intrested weekend with crypto!Well, if we are lucky and Bitcoin rises, we will have more fun with this currency, which always exceeds our expectations


GMTUSDTPrice broke and retested a significant zone, creating a bullish N wave formation. All three moving averages gave me two conformations and an entry signal.

early entryso if we have chance for this SHORT and I'll update TRAGETS bellow inshallah, this entry depend on 200EMA and OB
