GMTUSDT 15m : Long positionCompleting the f-wave of the diametric in the previous analysis
Rally starts the price increase from 0.86 to 1.16.
Read the previous analysis.
GMTUSDT_F4FB46 trade ideas

GMT - Running it down💪📉Reasons to take short:
⭐️ Today BTC futures exprire, I expect trend reversal for BTC
⭐️ Trendline 8 days long
⭐️ Trendline is clean
⭐️ Price slowly approaching the trendline
⭐️ 5th touch
⭐️ 45 ATR
⭐️ Under VWAP
Will enter when price squeezes to the trendline on 5m timeframe, the base will form and the tape will get faster.
If you don't understand the previous sentence, just use swing stop-loss 3-5%
Fix profit by parts:
1% - 1/3
2% - 1/3, stoploss to breakeven
What's left, hold to the maximum
What do you think of this idea? What is your opinion? Share it in the comments📄🖌
If you like the idea, please give it a like. This is the best "Thank you!" for the author 😊
P.S. Always do your own analysis before a trade. Put a stop loss. Fix profit in parts. Withdraw profits in fiat and reward yourself and your loved ones

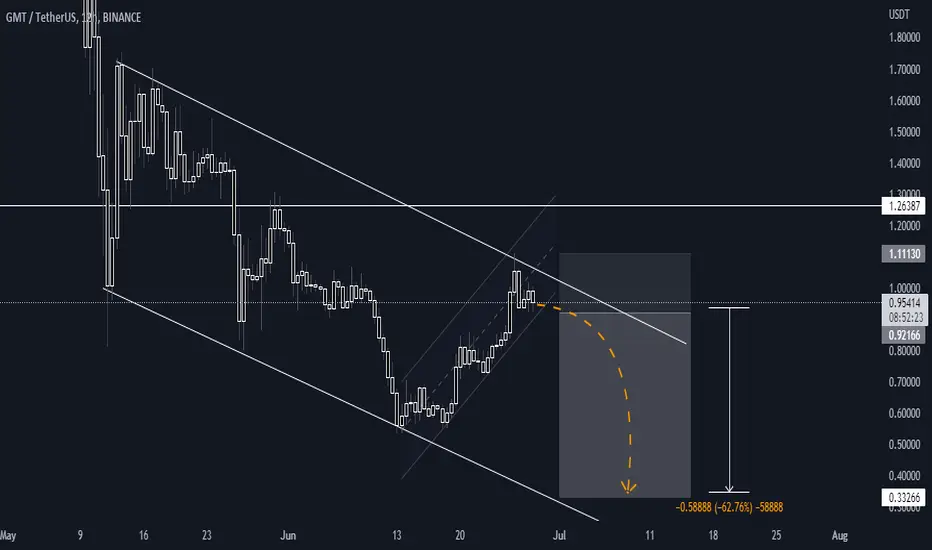
GMT ShortGMT broken down its bullish trendline, we wait for the pullback and then enter for short position.
Entry: 0.985 , 1.005 , 1.035
SL: 1.1115
TP1: 0.805
TP2: 0.765
TP3: 0.715
Target: 0.685

❗️Do you like these interesting charts?The blue trend line was broken (after many collisions :)
What do you see? --> Comment
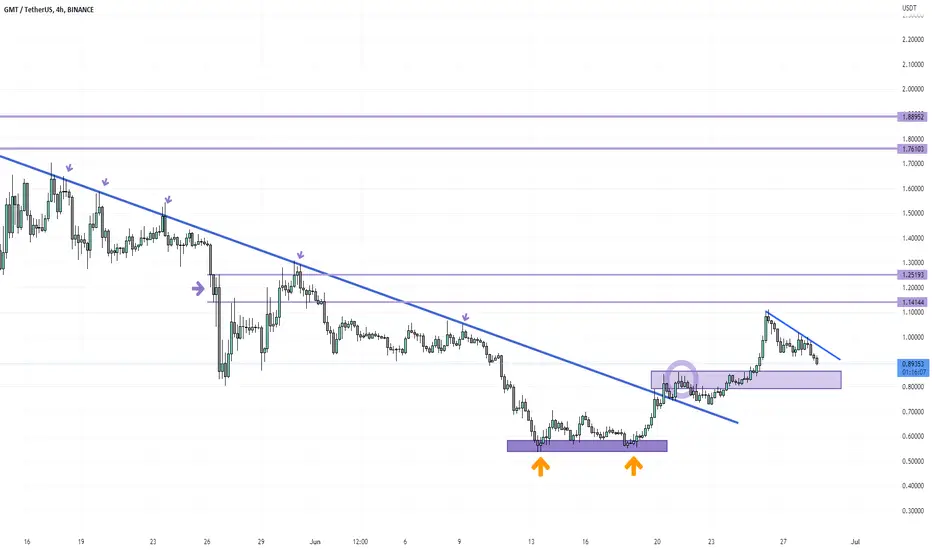
GMTUSDT TA 4H Follow us for more analysis & Feel free to ask any questions you have, we are here to help.
⚠️ This Analysis will be updated ...
📅 06.25.2022
⚠️(DYOR)
❤️ If you apperciate my work , Please like and comment , It Keeps me motivated to do better ❤️

GMT long ideaTaking longs here, with a stop just below the recent swing low, and below the support trend line.
Path to success shown on the chart.


Sounds like an uptrend, doesn't it? GMTUSDTHi, I hope today is a lucrative day for all of us (:
The momentum of the uptrend is strong. I do not have a signal for a strong downtrend, I think the price will react to one of the ranges ($ 0.88684 or $ 0.75182).
We have to wait to see if the blue range is lost or not, if the range is maintained a buy deal can be made.
Do not forget the loss limit.
It would be great if you could share your thoughts with us.

GMTUSDT🔥 IS THAT 60% OF THE PROFIT?!Subscribe to a channel that would receive new information about the cryptocurrency market✅
Greetings to all👋
GMT the price has formed an ascending channel inside the main channel, the asset is approaching the lower limit test, I expect a cut and subsequent falls.
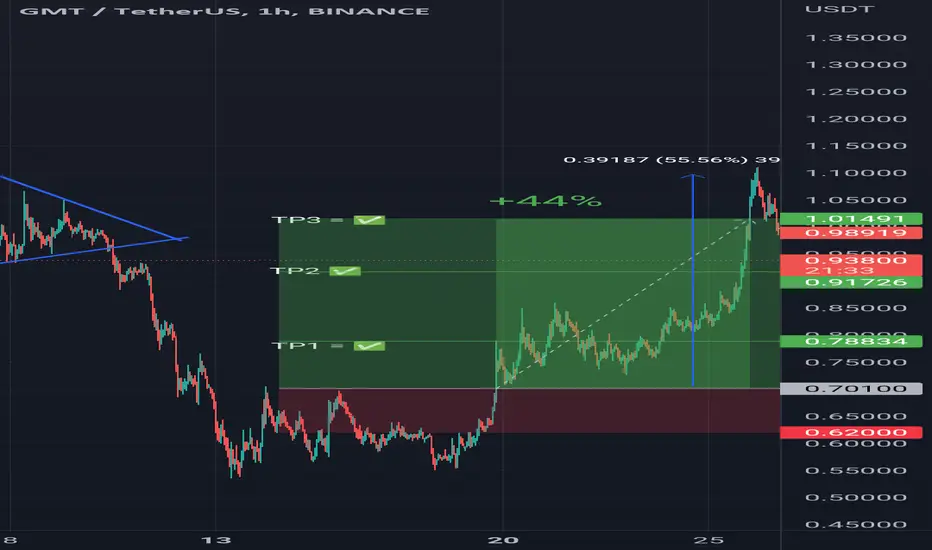
gmtTP1 ✅TP2 ✅TP3✅ 😎👌 Congratulations everyone
The deal was closed yesterday with a profit of +55%
This deal was posted on my account You can go in and check ------------- The link to the deal is in the first comment
GMTUSDT Forecast : Short positionEntry : 1.15$
Stop loss : 1.32$
Take prfit 1 : 0.43$
Take profit 2 : 0.28$
" It is currently in the f wave of of F of Diametric, after the end of this wave in the form of g wave will rise to the range of 1.16$
It will then enter the downward wave of G, the target of this wave is in the range of 0.28 $. "

GMT RefueledAfter it’s daily sell-off, it looks like GMT has refueled for another push to the upside. GMT has been in this descending channel and it’s having a breakout. RSI and Momentum are calling for a reversal at the bottom of Wave C. I expect GMT to retest resistance and we’ll go from there.
This chart based off of The Elliot Wave Theory, Fibonacci, EMA’s, MacD , RSI , Momentum, and resistance/support zones combined with patterns.

STEPN GMT token already give 100% profit and can give even more Hello TradingView community and my subscribers, please if you like ideas do not forget to support it with your like and comment, thank you so much and we will start.
Today I want talk with you about Stepn SMT token chart.
As you can see price decrease in accumulation (support ) zone 0.50-0.90
And already starts grow and give investors 100% profit from bottom.
I think gmt can continue to grow because all market is growing now and price already break resistance line.
I think price can rise from 150% to 400% from bottom level 0.55
Resistance zone between two targets 2.05 and 2.65 USD.
So, I'm waiting for this scenario.
This is my opinion, I really hope this will be useful for you.
Be ready and take care your money. Have a great profit !

GMTUSDT (STEPN) Daily tf Range Updated till 26-06-22GMTUSDT (STEPN) Daily timeframe range. good thing it didn't brokeout of its low like many others. which is a good rep at this condition of the market. alltho it dropped 86% from its top, pretty much the holders from top are rekt now totally depending on luck and developers how they improve it. it do have a close up range for swing positions. and decent amount of quality holders and buyers interest which helped it to follow-up those range spaces.

GMT Trading patternAlot of plays on the smaller tf.. u can leave that and focus on the bigger picture .

2022-06-26 _ GMTUSDTfor GMTUSDT the trend is showing bullish, now take some distribution, then it will act accrodingly

GMT is breaking outGMT is breaking its trendline and also the neckline of the cup & handle pattern.
If breakout confirmed (with a 4H candle' close above the trendline), the proposed targets are in chart.

GMT brief gain 💡🚀Hello 🐋
Based on the chart after a long time, correction to the downside the price is close to the major support and breaks the red trend line to the upside ✔️
if
the price doesn't break the support level (our green trend line and our round number$1) to the downside, we will see more gain beside the range market is an acceptable scenario too 📖💡🚀
if
the price breaks the round number to the upside, we will see more gain 📖🚀
Please, feel free to share your point of view, write it in the comments below, thanks 🐋

GMT 2022GMT is a Solana token that governs STEPN, a lifestyle app that encourages users to “move-to-earn.” STEPN users with NFT sneakers can earn GMT by walking or running outdoors. GMT can be used to pay for digital items and upgrades as well as staking and voting on future changes to the platform.
entry tg chart
thanks

GMT/Stepn for $1. We expect a correction in the near future!💎▪️GMT came to $1. Many will sell, so expect a correction soon.
💎In order not to miss a buy signal, subscribe and stay tuned for new ideas. Every day I post 10 profitable ideas per day.

GMT: + 20% tradeHello everybody,
GMT broke the resistance of 0.8 and retested it as support, I expect a nice upward momentum shortly.
target: 1.06 $
stop: close below 0.8 $

GMTUSDT (SHORT)Pullback entry
Orderblock
Imbalance
There's a high chance this trade gets invalidated if BTC will fly. That's why my stop-loss is kinda tight, to keep my risk low.

GMT’s ABC Correction We've just completed Wave 5 at the top of resistance. If we break 74 cents (support), we will go down to the next strong support at .60 cents. The support at 67 cents is weak and it’ll take a lot to bounce at that level. The RSI and momentum are also calling for a reversal. This further validates my TA.
Stop loss - 0.86
Minimum TP- 0.74
This chart based off of The Elliot Wave Theory, Fibonacci, EMA’s, MacD, RSI, Momentum, and resistance/support zones combined with patterns.
