Stepn to an Elliott Wave Clarity Hunt.Some interesting structures here, looking for a break here to lead to some clarity. There is a trade here in my opinion, but depending on the break, could lead to even more setups to watch for, MO.
Check out some of my other stuff and give a like and follow if helpful. Cheers!
GMTUSDT_F4FB46 trade ideas

GMT is based on 1 stop lossHello everyone, let's take a look at the GMT to USDT chart over the 1 day timeframe. As you can see, the price is moving below the local downtrend line.
Let's start with determining the stop loss that we should take into account in the coming days. As you can see, we have a fixed 3 stoploss:
SL1 - $ 0.997 where the price is currently located.
SL2 - $ 0.907
and
SL3 - $ 0.798
Now let's move on to the targets that we can take into account, as you can see the targets are at the price:
T1 - $ 1,027,
T2 - $ 1,165,
and
T3 - $ 1,279
Looking at the CHOP indicator, we can see that in the 1-day interval we still have some energy for further moves, and the MACD indicator shows that we are following the local upward trend.


GMT/USDT (SHORT)Entry1 1.07800 - 1.04400
Entry 2: 1.13100 - 1.11350
Targets: 1$, 0.97000, 0.92800, 0.86900, 0.80000
Stoploss: 1.18000

GMTAfter searching and following up And comparing this currency to the nature of the market now, we reached these goals
You can benefit from oscillation with us
TP1_ 0.801 🟢
TP2_ 0.565 🟢

GMT; Where is the Bottom?Hello Traders! CTDave here again with another daily price analysis chart.
Today I will be analyzing GMT, a coin that has produced a lot of attention to itself. Many might have generated lots of profit from it, and others might have lost a lot during its’ crash because of the China ban. You might ask “Where is the bottom?” and a possible answer lies down below
As you can see, there is a strong resistance level (marked with a “Resistance” bubble), and GMT is almost at that level. The red arrow shows how I expect the price to move. The RSI also shows that GMT is almost overbought which shows that it’s going down. Now, if the price retraces when hitting the $1.05 level, we know that the price might follow the blue arrow. If it tanks lower, then upon reaching the $0.85 level, it might either go up (orange arrow) or continue down (green arrow).
Thanks for reading!
As always, I encourage everyone to please like, comment, and share my ideas, and follow me for more of these posts to be kept updated. Happy trading! Thank you!
Note: I am not a financial advisor, please do not trade solely based on my trading decisions. Do your own research or consult a professional financial advisor before conducting a trade.

GMT is a Ponzi. Trade it when patterns appears. GMT is a Ponzi. Trade it when patterns appears.
we trade a trend line break out patterns only

GMT, below the uptrend line.The following content is machine translation:
GMT, below the uptrend line.
On the 4-hour chart, it hit a low of 0.8 on May 12, stopped falling and rebounded, and then stepped back and rebounded around 0.8. The high point of this rebound is lower, and it currently falls below the rising trend line of this rebound, and it may drop again. To the vicinity of 0.8, bearish.
The zero axis below the speed line of the macd indicator will run below. The RSI indicator is near the oversold zone, bearish.
In operation, it has fallen below the rising trend line, but the continuous decline and the RSI indicator are rising near the oversold zone, and it may rebound a bit. Here, you can wait for the rebound to weaken and go short and look down at around 0.8.

Stop buying GMTAn unfinished ABC correction, a huge hype, a bunch of non-professional traders buying off every strait.
What other reasons are needed to definitely go even lower? We know what faith in a project is, but it's more like a financial pyramid from which it's not too late to get out. Ready to sit out another -55%?
We closed all the takes back in April and have been short since May 4, the choice is yours.
Attached a link to a similar situation with SHIB.

TARGET PROJECTION FOR GMTUSDT IN THE DIARYPrice formed a double bottom pattern, in a downtrend, also characterizing a descending triangle and, in my view, if it breaks ~up, the price can seek this price projection.
Obviously it may take a few days, even because the chart is in the diary. But I believe you can look for that price region.
disclaimer
*** In accordance with CVM Instruction No. 598, of May 3, 2018, Art. 21, I declare that the recommendations of this analysis reflect solely and exclusively my personal opinions and perceptions and that they were prepared independently and autonomously. Not being considered a purchase and/or sale recommendation. ***
Any questions do not hesitate to contact me. I'm happy to be able to help you in the best way I can. 🙏

GMTUSDTPERP/BINANECI'm not sure for 100% if you want take this trade do your search before you enter the position
And do what you want in your money

Long gmt For the past few weeks we have seen a strong run of bear market and right now it seems we are at the end of the bear Market first bitcoin moving above the 30-31k resistance and right now making a pull back to shoot over for me gmt strong support and entry is 0.9 -0.8 first
Entry 0.9-0.8
First tp 1.3
Second tp 2.0
Stop loss 0.7
DYOR
NAFA

GMTUSDTPERP/BINANECDo 10x and TP:1.109/SL:1.154
This is not sure for 100% do your search and enter if you want

GMT LONGPerfect spot to bag some GMT now
Ready to get out of the falling wedge with the loss of bearish price momentum
Extremely bullish
NFA

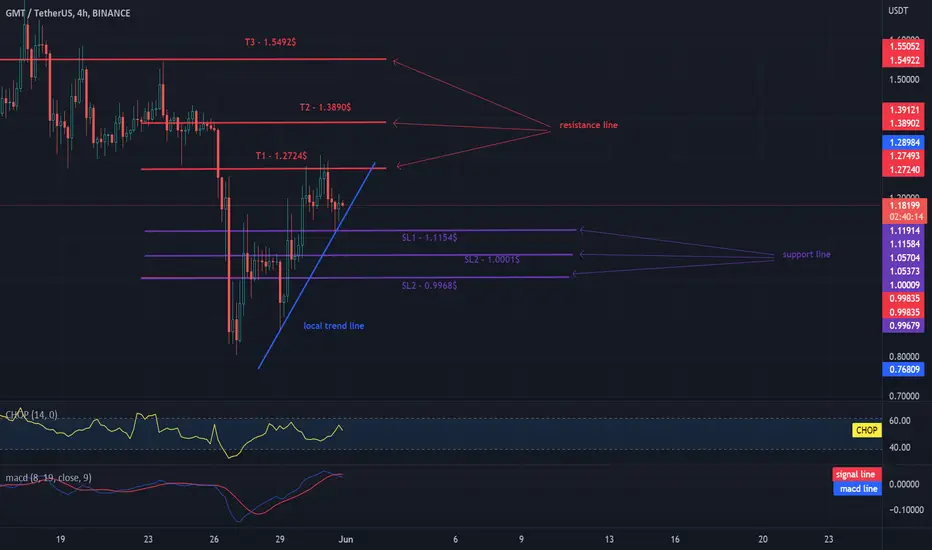
GMT has rebounded from resistance and is gaining energy. 4HCHARTHello everyone, let's take a look at the GMT to USDT chart over the 4 hour timeframe.
As you can see, the price is moving above the local trendline.
Let's start by identifying the stop loss we have in the near future:
SL1 - $ 1.1154
SL2 - $ 1,0001
SL2 - $ 0.9968
Now let's move on to the goals we may consider:
T1 - $ 1.2724
T2 - $ 1.3890
T3 - $ 1.5492
Looking at the CHOP indicator, we can see that in the 4H interval we have a lot of energy for the next move, while in the MACD indicator we see that the blue line crosses the red one from above, which could potentially lead to a further decline in the price.
Be careful and use stoploss in the short-term game.
GMTUSDT ! double bottom. Will there be a change in trend?GMTUSDT in consolidation. A double bottom pattern is forming around the 0.800 support. A false breakdown of the strong support at 1.1000 was also made. The price returns beyond the level and consolidates above.
I'm guessing the price will go up. Change from a downtrend to an uptrend. The potential is great, I'm waiting for the price increase. In the short term - 1.7281. In the medium term - resistance 2.7513
Sincerely, R. Linda!

🏃GMT: you can't run away from a SCAM.📊Actually, it`s +15% after the last idea. You can read about why the STEPN fell and possible scenarios of pump or dump in this idea.
📊At the moment on the volume indicator we can see an increase in volume at every test of the bottom, which means that the coin is being bought back. Especially it can be seen on the massive sell-off when the price temporarily renew its lows (2) and the coin has already risen by 50% after that. Definitely a sign of strength.
🔶1. $1.31-1.54 is the largest zone of value, a strong resistance for the price. After the 50% growth, GMT should consolidate under this area for some time, to accumulate the strength for continued growth.
🔶2. $1.87-2.02 - the first target, a value zone, an even number. Traders who bought a $1 coin will close their longs.
🔶3. $2,53-2,77 - the second target
✅Friends, trade with stop losses, this is a must. Remember, the Chinese players, were the main players and now this market is being shut down for STEPN. Even if the volume indicator shows buying, remember what happen to LUNA!
Do you think this is a scam or should we expect a strong growth of Move-2-earn projects and STEPN will be the largest of them? Let me know in the comments!
💻Friends, press the "like"👍 button, write comments and share with your friends - it will be the best THANK YOU.
P.S. Personally, I open an entry if the price shows it according to my strategy.
Always do your analysis before making a trade.

shorting $GMTwith trading buddies
ENTRY: 15m
4h weakening ng buying volume
15m ccc - antay butasin ang BB50
with buy volume dapat
exit: 43% on .5 area sa fib


Stepn (GMT)STEPN (GMT)
GMT a possible Leonardo Harmonic Pattern, similar to Bat Pattern but with slight difference based on fibonacci ratios.
Two possible scenario and PRZ:
● First scenario: Leonardo Harmonic Pattern (retrace at 0.786 of XA wave) + orderblock around 1.36 - 1.38, short position.
● Second scenario: Bat Harmonic Pattern with 0.886 retracement of XA wave, short position.
Please use low leverage (3-5x)

King is back! Gmt looking juicy :))There is an amazing positive divergence on daily and hourly!!
All the points are clear on the chart.
I am not sure on the last Tp but first 2 ones looking nice.

GMTUSDT Buy after break & fixation. StepNHello traders, Everything is clear on the chart for you like always.
Good luck.
If you like the idea, do not forget to support with a like and follow me for next analysis :)
Write your comment and opinion below to me

GMT : A bullish ideaGMT / H2 / Regular chart
GMT is bouncing from the double bottom support and if GMT Breaks the red downtrend line, I am expecting GMT To reach the Neckline of the double bottom pattern.
