#GMT/USDT 4HOUR UPDATE BY CRYPTOSANDERS !!Hello, dear traders welcome you to this GMT/USDT 4hr chart analysis.
I have tried my best to bring the best possible outcome in this chart.
Hello dear traders, we here new so we ask you to support our ideas with your LIKE and COMMENT, also be free to ask any question in the comments, and we will try to answer for all, thank you, guys.
As we can see from the above-mentioned chart that GMT /USDT is printing an inverse head and shoulder-like pattern which can happen.
If an inverse head and shoulder pattern creates then we can take a long entry:-$1.27,$1.42.
GMT has a resistance zone between $2.21-$2.20 which is the longest and strong resistance zone.
and stoploss:-$1.12
If we take an entry at the neckline level of an inverse head and shoulder pattern then we can gain almost 50% to the resistance level and if it breaks the resistance then more % will add.
We will keep updating you.
Thanks for your time, we hope our work is good for you, and you are satisfied, we wish you a good day and big profits.
THANK YOU.
GMTUSDT_F4FB46 trade ideas

Double the win : Long to ShortThis are my reasons
1.The chart above shows a bullish pennant signifying an up trend
2. But this up journey will be short lived using OB at the top and then it's a short to a major support zone

Dogi Formed on $GMTWhat happened to $Luna might happen to $GMT.....A Doji bearish candle formation signal a possible reversal since bitcoin is also
doing a reversal after hitting a $30750 mark and still holding a major support zone at $2900..
Lets short it and take profit...

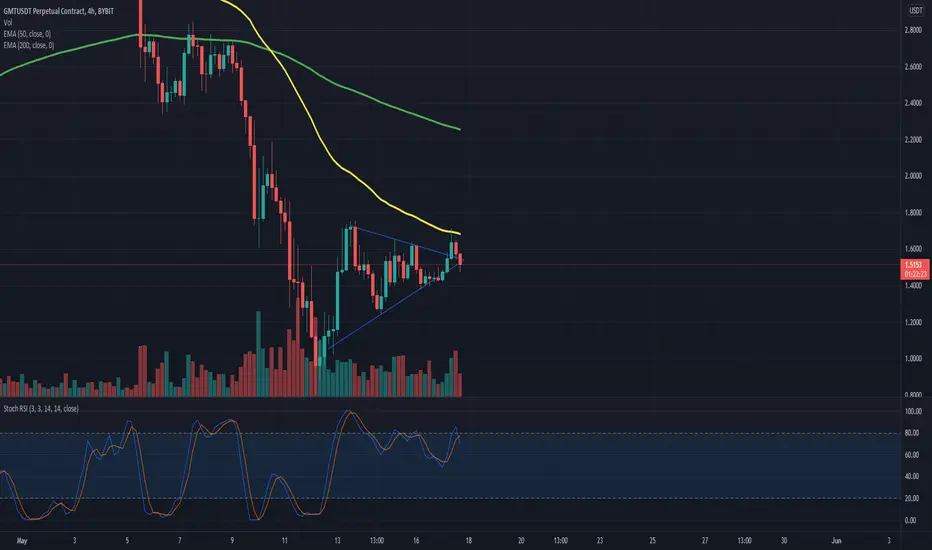
GMT CONTINUATIONOn the hourly chart of GMT a symmetrical triangle is in play. To know the price movement we have to wait for a breakout.

GMT/USDT BUYING SETUP (SWING)$GMT Breakout bullish pennant with strong buy volume, potential continue upward movement
MACD showing bullish crossover
Buy zone : 1.56 - 1.4 - 1.26
Target : 1.6286 - 1.7494 - 1.8933 - 2.0563
Stop : 1.15

GMTUSDT - a possible increaseP.S. Always do your own analysis before a trade. Put a stop loss. Fix profit in parts. Withdraw profits in fiat and reward yourself and your loved ones

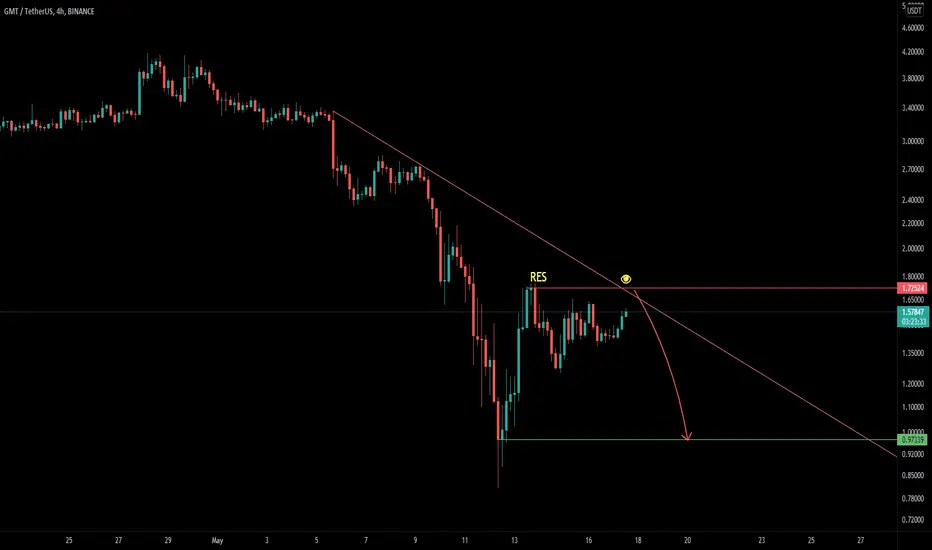
Static resistance is near priceIt seems that the price will decrease after the price hits the static resistance range.
GMT longSimilar to the setup on KNC.
Price and lagging strand above the cloud. Targets and stops on the chart.

GMTUSDTHello my friends , this is my idea about GMT chart , please check it by yourself and its not financial advice !
always manage your RISK

Is this enough speculation for you?...GMT in a "correction" in a downtrend, the case presented its ideal, we might have some supply zones higher which the market is gonna hunt for.

Prepare for some bullish turn of eventsA break above the symmetrical will most likely signify rally towards previous High.
disclaimer: Not reading advice

Symmetrical triangle A symmetrical triangle has formed on the 1hr TF. Wait for breakout in either direction

GMT/USDT good opportunity to buyHey Traders,
Our attention caught GMT /USDT. On weekends GMT has formed a nice higher-lows pattern so here we see 2 options that can happen.
Firstly - GMT will hold the trendline we drew zone and it will bounce to $2.30.
Secondly - it will fall and try to test $0.85 support line from where we should have a strong bounce back up.
If you like ideas provided by our team you can show us your support by liking and commenting.
Yours Sincerely,
Swallow Team
Disclamer:
We are not financial advisors. The content that we share on this website are for educational purposes and are our own personal opinions.

possible shortexpecting a drop to the 0.97-0.82$ zone unless we break out of the descending trendline which will singal a new uptrend
DISCLAIMER; THIS IS NOT TRADING ADVICE, its simply to educate you and myself and to note my progress

GMT - Buying strategyBYBIT:GMTUSDT
1H trend chart
-
GMT keeps consolidating and the low points are getting higher gradually.
If price can overcome the downtrend line, trading strategy as below.
-
Profit Targets:
a) 1.7342-----Fib(1)
b) 1.987~2.0893-----Fib(1.272~1.382)
Stop losses:
a) The relative low point after breaking out downtrend line-----Red horizontal ray
-
If you like this analysis, smash the "like button" and leave a comment below to share your thoughts
or let me know what crypto you want to see!
Trading is a reflection of yourself. Learn more daily and be ready for every opportunity.
Have a nice trading!


GMT 5 AND D From BC Target (Scalping )GMT 5 AND D From BC Target Scalping, my stop loss and my targets on chart, when he get the first target i will change my stop to it...

GMT/USDT 1HR CHART UPDATE BY Domino Crypto!!Hello, community members welcome to this GMT/USDT 1hr chart update by Domino crypto.
Don’t forget to hit the like button if you find this update helpful because this motivates me to bring this kind of update regularly.
Now, Let's get to the chart,
As we can see that above-mentioned chart is evident that GMT/USDT just broke out the neckline of this HEAD & SHOULDER PATTERN which is a bullish pattern.
GMT currently trading at the price level of $1.56.
Here I am expecting a retest towards the neckline which will be the confirmation to long GMT.
RSI also follows the lower trend line well and moves upside.
Some % below GMT also getting a back MA SUPPORT.
ENTRY:
leverage:-5x to 7x leverage
entry:-$1.49,$1.545
target:-40% to 50%
stoploss:- $1.407
NOTE: This is not financial advice. This is for education purposes only. I am not responsible for the profits or losses you generate from your investments.
DO YOUR RESEARCH BEFORE MAKING ANY TRADES.
Thank you.

GMTUSDT PERPI'm looking to go bullish a little on market
I feel this might actually go well, looking good. The market is still bearish but we can still pick up short LONGs entry.

LONG LUNAYOU MIGHT NOT WANT TO BELIEVE. Luna have been in consolidation for the past nine hours after reaching 0.00059500 and
have slighty in an uptrend.

Analysis.In a previous analysis, GMT analyzed that when it was at the $2 level, it would rise back up, warned that it would be dangerous to go near $4 and has continued to update the analysis to see how far it would fall.

GMT REVERSALIn one hand on the 15 minutes chart the price is forming lower lows. On the other hand the RSI indicator is forming higher lows.
we might see a little bounce in the price of GMT.
NB: If the rsi broke the support line and is no longer forming higher lows than this divergence will be invalid
