GMTUSDT.PHello Trader BINANCE:GMTUSDT.P
0.3725 this position is now at the key lev of gmt to fly again because of the potential I see there is a fairly high increase in market prices for this pair, 5% stop loss and 40% reward can be paid in installments on the spot. this chart is valid sym triangel
Please add a comment and Positive feedback and constructive criticism are important to authors and the community.
Disclamer: Not Financial Advice
GMTUSDT_F4FB46 trade ideas

#GMT/USDT#GMT
The price is moving in a descending triangle, which we penetrated once, and we are about to penetrate it again to the upside
On 3 levels of goals
Entry price is 0.3106
The first target is 0.3346
The second target is 0.3526
The third goal is 0.3725

gmt usdt longbuy now
target 1 0-50
target 2 0-66
target 3 1
target 4 open
stop loos close one day ander 0-2800

BIG SINGAL #GMTUSDT IS VERY BULLISH SOONBIG SINGAL #GMTUSDT journey, after a bump against a major resistance, it's now climbing from a key support level at $0.37. Staying above this level could very well pave the way for a bullish surge. Keep your sights on the next goal, the resistance at $0.57, with a breakthrough potentially pushing the price up to $0.79 AGAIN WILL BE UP OTHER MONTH $1.45-$2.25
the drive behind
GMT
starts to wane, anticipate a bullish resurgence from the firm support at $0.37. However, a fall beneath this pivotal point might signal a shift into bearish territory.
GMT-USDT WILL BULLISH $0.79 SOON
Thank You,please not forget buy today

#GMT Grand Metaverse Token, Being form a cup with handle.#GMT Grand Metaverse Token, now stands strong above 0.35, my target are on white dot lines, 0.45/0.68/1.0, being form a cup with handle patterns.

GMTUSD_1DHello 👋
📊 GMTUSDT analysis
The analysis style is based on Elliott waves.
According to the past and due to the failure of the upward trend line, the market can enter a new rising wave, which can complete this wave in the form of 5 rising waves.
The main support is 0.3666
Target wave 5 pieces 2.6000
💰 600% growth

GMTUSDT 1W Hello friends, I hope you are doing well, you can see the GMT graph in a week.
It is located in an ascending channel where the bottom and ceiling points of the channel are considered the best supports and resistances. The important point is the Como cloud. The chart is inside the cloud and the smoothed line above the cloud that I have specified can become stubborn resistance.
I hope that you have made the most of my previous ideas.
If you have a requested analysis, send a message

GMT moving UP!It looks like the confirmation is in on clearing the triangle. Expect the price to rise to .54 cent range.

GMTUSDT = SPOT TRADESo her 's GMT (Green Metaverse T)
İts is going to be Next Gala.
Take it As a Spot Trade guys.
CMP : 0.37
DCA : 0.35
Take Profit When you are desire with profits or move the stope loss above when its pump

🔥 GMT Long-Term Trend Shift: Big Signal!After 1.5 years of straight selling, GMT has finally confirmed a change of the long-term trend.
In my eyes, GMT is one of the better undervalued tokens on the market right now. It saw a huge move back in 2022, but lost around 95% of its value at some point. Relatively new token, so a lot of potential upside.
Stop under the weekly swing low, target at the all-time high.

GMT is a precious diamondThe GMT large diametric seems to be over.
This diametric caused a 97% drop in the GMT symbol and lasted for about 680 days.
We now seem to have entered a bullish wave C.
The targets are clear on the chart.
Buy from this coin and keep it in your bag.
Closing a daily candle below the invalidation level will violate the analysis
For risk management, please don't forget stop loss and capital management
When we reach the first target, save some profit and then change the stop to entry
Comment if you have any questions
Thank You

GMTUSDT 3D#GMT broke the falling wedge on 3-day chart. Currently facing horizontal resistance of $0.3724 level. #GMT is the next giant with 2~3x rally. Targets are:
$0.5172
$0.6342
$0.7512
$0.9178
$1.1300

GMTUSD 3DGMT ~ 3D 📈
#GMT Just need to break this resistance line for the bulls to dominate again. Make purchases gradually here, with a minimum target of 20%++

Triple top GMTUSDTTargets on screen, wait for confirmation
ETH fees are on top high so a drop expected soon, be prepared.
Still, the bullish market is not over yet.

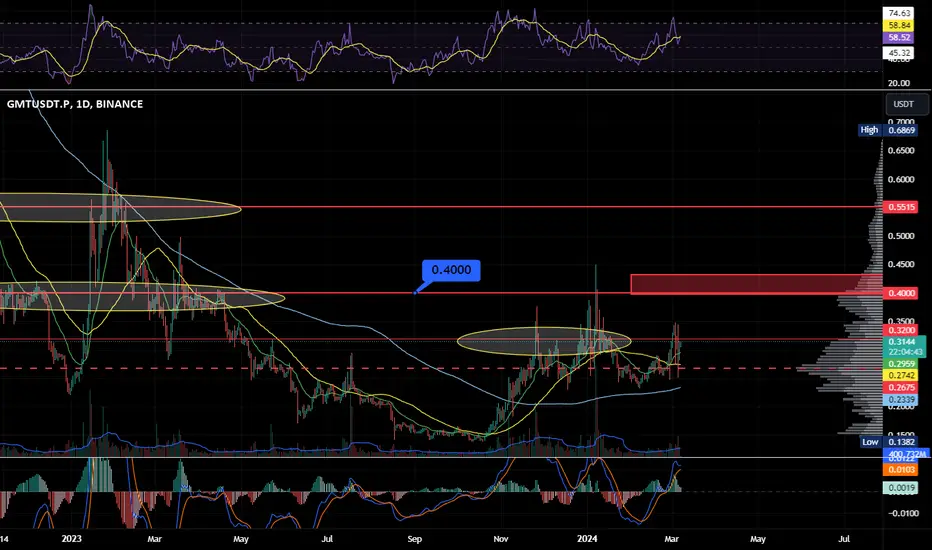
GMT #GMT $GMT #GMTUSDT#GMTUSDT GMT is breaking symmetrical triangle! i expect to see 0.4 very soon! keep an eye on long setup on GMT!

#GMT H&S or bull run?GMT look likes to form a head and shoulder pattern, btw if it can stand above 0.32 and then to test 0.40 it may perform a bull run.
GMT /USDT bullish ride from key demand? 👀 🚀 GMT today analysis💎 Paradisers, cast your eyes on #GMTUSDT! A striking trend has emerged as it finds its footing in a demand zone, hinting at an upcoming bullish journey.
💎 #GMT is threading through a descending channel and is on the verge of hitting a significant supply zone at $0.3203. As it approaches this supply level, keeping up the pace could drastically enhance the odds of breaking through. With sustained upward momentum, we're on track for promising bullish prospects.
💎 If the drive behind NZX:GMT starts to diminish, we're poised to seize a potential uplift from the key demand level at $0.2495. However, a descent below this critical juncture could signal a potential turn towards bearish territory.
💎 As always, ensure you're navigating with smart trading strategies and setting appropriate stop-losses! Keep an eye on the evolving market and stay tuned for further updates.

GMT/USDT I BUY SETUP✔︎📈 BINANCE:GMTUSDT SIGNAL
✔︎ENTRY : 0.3146
🏓TARGETS :
✔︎T1 : 0.3481
✔︎T2 : 0.3816
✔︎T3 : 0.4230
✘STOP : 0.2948
🚦Stop Trigger:
• If you make capital management: Stop is activated when one candle opening and closing
below the stop level of the same time frame of the signal.
• If you don't make capital management: Stop is direct without waiting for the candle to close.
💡Risk management :
• Enter the trade with 10% to 20% of your capital to reduce risk and save cash to enter other opportunities.
• Sell (25% to 50%) on (T1) and don't move your stop-loss.
• Sell 50% on (T2) and move your stop loss to the entry point.
• You are safe now, and the next 25% is up to you.
💡Reason for this trade:
BINANCE:GMTUSDT gives my trading system a sign of strength:
• My trading system is based on liquidity and reversal zones.
• When the liquidity is swept from one side under certain conditions, we will wait for the price on the other side.
The liquidity will attract the price like a magnet.
• the first side that has been swept:
1- liqudity pool
2- Successful auction (AMT)
• Opposite side targets:
1- range high
2- un mitigated wick
💡Entry setup
1- reclaim liqudity pool area
⚠️WARNING:
• I'm not a financial advisor.
• Do your own research (DYOR).

GMT Bullish - can it break out?GMT today is started a reversal pattern. At this time frame (this chart) we can see GMT is getting out the EMA ribbon.
- This could lead to a nice pump towards our target
However it can pullback again before a bullish momentum to happen.
Some targets on chart.
Enjoy!
What is GMT crypto?
GMT is a Solana token that governs STEPN, a lifestyle app that encourages users to “move-to-earn.” STEPN users with NFT sneakers can earn GMT by walking or running outdoors.

GMT Long - Bullish GartleyGMT has completed a type two bullish gartley above a key inflection point.
Target is the .618 and then the 1.618 which lines up with the next major resistance.
Looking amazing above this level, we are long.


$gmtusdt may rise 25%hellow everyone, during this bull week, I would like to trade BINANCE:GMTUSDT based on fib.
check the chart for enter and exit.

GMT/USDT Could GMT break the resistance and continue upward ??💎GMT has recently undergone significant market dynamics. Presently, GMT is undergoing an upward climb, with a backtest on the bearish OB underway. However, for GMT to sustain its upward trajectory, it needs to overcome the resistance in this area.
💎 A successful breakout above the resistance would pave the way for further upward movement. Additionally, breaching the Bearish OB would signify a bullish momentum, potentially leading GMT to reach our target strong resistance area.
💎 On the contrary, if GMT faces rejection at the resistance level, it could trigger a downward movement towards the demand area to establish new momentum. It's noteworthy that a Head and Shoulders (HNS) pattern is visible on the chart, indicating a potential reversal.
💎 Therefore, GMT must bounce back to the demand area. Failure to do so and a subsequent breakdown below the demand level would validate the HNS pattern, leading to a significant continuation of the downward movement.
