GMXUSDT 30%+ Short opportunity here?I found a possible short opportunity here in one of the largest up-trending tokens in the last 24 hours. You can see by all the previous structure of what I call the EMA (solid red smoothed Heikin Ashi candles) and how the actual price behaves when it break up through the mean. It is short lived (2-4 days) and the average move down is 35.94%.
Keep in mind to have a plan to add to your short if it move higher against you first, so spread a series of smaller short limit orders across 18% above the MA break would be what I am doing. I generally like to fill one short first, and let the price come to my better series of entries. Thus, averaging my entry and this gives me the opportunity to get out if price continues to move up. As I can get out on a retrace at break even or a small profit. Do not attempt this strategy unless you place small orders, don't go higher than 10x leverage and commit to managing the trade for multiple hours to get out unscathed. Something I would do at the start of my trading session, not when I need to get some sleep.
But this strategy works. I am nobody special and currently the #2 lead trader on Bitunix for copy trading at time of writing.
There are two lower highs on the 1H right now! So this is a high probability of profit.
GMXUSDT trade ideas

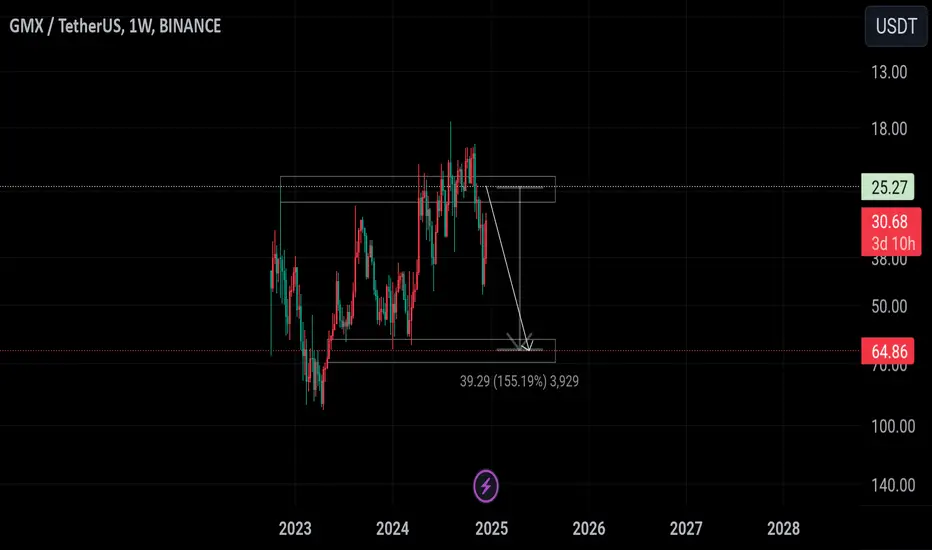
GMX is Still Bearish (12H)From the point where we placed a red arrow on the chart, it appears that GMX has entered a bearish diametric pattern.
It now seems that wave F is nearing completion.
The target is marked on the chart. it could be the green target box. If a daily candle closes above the upper red box, this analysis will be invalidated.
For risk management, please don't forget stop loss and capital management
Comment if you have any questions
Thank You

GMXUSDT 1DGMX ~ 1D Analysis
#GMX High risk trading, Buy after successfully penetrating this resistant line with a short -term target of at least 10%+.

GMX/USDTHello friends
Due to the heavy price drop on the indicated support, buyers have provided good support for the price, which has caused a good price growth.
Now you can buy in steps in the indicated support areas.
If you want to be with us in the Alt Season, send us a message.
*Trade safely with us*

GMXUSDT UPDATEGMXUSDT is a cryptocurrency trading at $15.52. Its target price is $30.00, indicating a potential 90%+ gain. The pattern is a Bullish Falling Wedge, a reversal pattern signaling a trend change. This pattern suggests the downward trend may be ending. A breakout from the wedge could lead to a strong upward move. The Bullish Falling Wedge is a positive signal, indicating a potential price surge. Investors are optimistic about GMXUSDT's future performance. The current price may be a buying opportunity. Reaching the target price would result in significant returns. GMXUSDT is poised for a potential breakout and substantial gains.

GMX/USDT 1W🩸 TSX:GMX ⁀➷
#GMX_IO. Macro chart Another
💯 Intermediate Target - $67
🚩 Macro Target 1 - $94
🚩 Macro Target 2 - $148
🚩 Macro Target 3 - $220
- Not financial advice, trade with caution.
#Crypto #GMX_IO #GMX #Investment
✅ Stay updated on market news and developments that may influence the price of GMX_IO. Positive or negative news can significantly impact the cryptocurrency's value.
✅ Exercise patience and discipline when executing your trading plan. Avoid making impulsive decisions driven by emotions, and adhere to your strategy even during periods of market volatility.
✅ Remember that trading always involves risk, and there are no guarantees of profit. Conduct thorough research, analyze market conditions, and be prepared for various scenarios. Trade only with funds you can afford to lose and avoid excessive risk-taking.

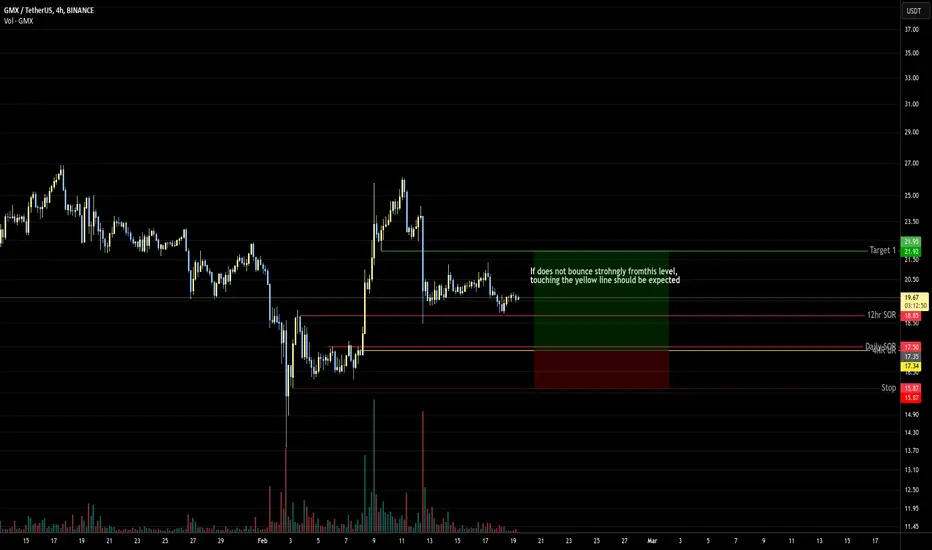
3 RRIf does not bounce strongly from this level, touching the yellow line should be expected. If it does make a new very local high, cancel this trade
#GMXUSDT at a Key Level: Reversal Up or Further DropThe BYBIT:GMXUSDT.P price is consolidating after a sharp decline and is currently hovering around $19.870. A breakout above resistance or a drop below support will define the next move.
Two possible scenarios:
🔵 Bullish scenario: Holding above $20.480 activates a long setup towards $22.025.
🔴 Bearish scenario: Losing $19.220 confirms a short setup towards $18.040.
⚡ Best approach – place both scenarios in your watchlist and wait for confirmation.
⚡ This allows traders to avoid guessing and enter only after confirmation.
⏱ 1H Timeframe
━━━━━━━━━━━━━━━━━━━━━━
📈 LONG BYBIT:GMXUSDT.P from $20.480
🛡 Stop Loss: $19.870
✅ Overview:
➡️ BYBIT:GMXUSDT.P is stabilizing around $19.870 - $20.065 (POC), the key liquidity zone.
➡️ The price is attempting a recovery but hasn’t broken $20.210 yet.
➡️ A confirmed breakout above $20.480 would open the way toward $21.250 and $22.025.
⚡ Plan:
✅ Bullish confirmation requires a breakout above $20.480 and consolidation.
✅ Monitor reaction at $20.065 (POC) – the key volume zone.
✅ If the breakout is weak, a pullback to $19.770 is possible.
📍 Take Profit targets:
🎯 TP1: $21.250 – local resistance.
💎 TP2: $22.025 – main profit-taking zone.
🚀 BYBIT:GMXUSDT.P is testing a key level — waiting for a breakout signal!
━━━━━━━━━━━━━━━━━━━━━━
📉 SHORT BYBIT:GMXUSDT.P from $19.220
🛡 Stop Loss: $19.770
✅ Overview:
➡️ If the price fails to break $20.065 and starts dropping, a test of $19.220 is expected.
➡️ A breakdown below $19.220 could trigger a move toward $18.655 and $18.040.
➡️ Volume indicators suggest possible distribution, increasing bearish pressure.
⚡ Plan:
✅ Bearish confirmation requires a break below $19.220 and consolidation.
✅ Watch reaction at $19.770 – if it holds, a reversal could form.
✅ If selling pressure increases, the drop could accelerate.
📍 Take Profit targets:
🎯 TP1: $18.655 – intermediate support.
💎 TP2: $18.040 – deep correction.
🚀 BYBIT:GMXUSDT.P is at risk of a breakdown — expecting a move to $18.040!

GMX Ending Diagonal
Based on the continued drop, I've switched my count to and ending diagonal, and we'd currently be in black 5 to end this downtrend cycle.
There are no bullish signals in place yet. A break of the mid-channel green trendline resistance would be a good indicator that the trend has reversed.

GMX Update
I am now considering GMX is making a more complex pattern, with multiple ABCs. It could be the initial wave of a leading diagonal, but at this moment it's just guesswork.
In the shorter term, I'm waiting for a break of the descending wedge which could signal the end of black C.
Bullish RSI divergence is already present, but without a higher high, it will just sit on my watchlist for now.

GMXUSDT 5DGMX ~ 5D
#GMX So far it still maintains this support block,. Buy in stages from here with a minimum target of 20%++

GMXGMX/USDT Analysis
📊 Introduction
GMX token is considered one of the high-risk assets in the cryptocurrency market, as its relatively low market cap leads to significant price volatility. However, GMX has attracted considerable attention from investors due to its high growth potential in areas related to DeFi and decentralized contracts. In this analysis, we will examine GMX's price structure within a descending channel and explore the possible scenarios ahead.
🔎 Technical Analysis
Overall Trend in the Descending Channel
Channel Structure: GMX is currently moving within a descending channel and has experienced a sharp price correction after hitting the upper boundary of the channel.
Key Levels:
Resistance Zone (Yellow): The range of $26.50 - $27.26, a break above which could pave the way for a bullish move.
Midline of the Descending Channel: This level plays a crucial role in determining the current trend, and breaking above it would be a strong indication of buyer dominance.
Bullish Scenario (Breakout of Resistance Zone)
If the price breaks the yellow resistance zone and stabilizes above it, a bullish move is likely to gain momentum.
After breaking both the resistance and the midline of the channel, the price will approach the upper boundary of the channel. A breakout here could lead to further upward movement towards target levels.
Take Profit Targets (TP):
TP1: $44.57 - $47.86
TP2: $57.68 - $61.98
TP3: $77.88 - $82
🔍 Key Insight: Due to GMX’s low market cap, a significant influx of liquidity could push the price even beyond these targets.
Relative Strength Index (RSI)
The RSI moving above the midline serves as a critical confirmation, signaling bullish momentum alongside the breakout from the resistance zone and the midline of the descending channel.
Volume
An increase in trading volume during the breakout of the resistance zone and midline is crucial. High volume can prevent fake breakouts and provide confirmation for the continuation of the bullish trend.
🔒 Risk Management Key Points
Suggested Entry Point:
Enter after the breakout of the yellow resistance zone ($26.50 - $27.26) and price stabilization above it.
Stop Loss (SL):
Place the stop loss below the lower boundary of the descending channel to mitigate the risk of potential volatility.
Trade Volume Management:
Given GMX’s high volatility and inherent risk, the trade volume should be adjusted according to the investor's risk tolerance.
✨ Final Conclusion
The analysis suggests that GMX token has significant growth potential, especially if key resistance levels are broken and new liquidity flows into the market. However, monitoring technical confirmations (such as RSI and trading volume) and staying alert to market trends are crucial for successful trade entry.

#GMX (SPOT) IN ( 21.00- 24.50) T.(83.00) SL(19.73)BINANCE:GMXUSDT
#GMX/ USDT
Entry( 21.00- 24.50)
SL 1D close below 19.73
T1 34.00
T2 44.00
T3 62.00
T4 83.00
______________________________________________________________
Golden Advices.
********************
* collect the coin slowly in the entry range.
* Please calculate your losses before the entry.
* Do not enter any trade you find it not suitable for you.
* No FOMO - No Rush , it is a long journey.
Useful Tags.
****************
My total posts
www.tradingview.com
**********************************************************************************************
#Manta #OMNI #DYM #AI #IO #XAI #ACE #NFP #RAD #WLD #ORDI #BLUR #SUI #VOXEL #AEVO #VITE #APE #RDNT #FLUX #NMR #VANRY #TRB #HBAR #DGB #XEC #ERN #ALT #IO #ACA #HIVE #ASTR #ARDR #PIXEL #LTO #AERGO #SCRT #ATA #HOOK #FLOW #KSM #HFT #MINA #DATA #SC #JOE #RDNT #IQ #CFX #BICO #CTSI #KMD #FXS #DEGO #FORTH #AST #PORTAL #CYBER #RIF #ENJ #ZIL #APT #GALA #STEEM #ONE #LINK #NTRN #COTI #RENDER #ICX #IMX #ALICE #PYR #PORTAL #GRT #GMT #IDEX #NEAR #ICP #ETH #QTUM #VET #QNT #API3 #BURGER #MOVR #SKL #BAND #ETHFI #SAND #IOTX #T #GTC #PDA #GMX #REZ #DUSK #BNX #SPELL #POWR #JOE #TIA #TFUEL #HOT #AVAX #WAXP #OGN #AXS #GALA #ONE #SYS #SCRT #DGB #LIT #QI #FIL #GLMR #ATOM #LTC #MANA #ONT #TLM #SLP #ROSE #NEO #EGLD

GMXUSDT: Buy Zones in Chaos! GMXUSDT: Buy Zones in Chaos! 💎
Blue box looks okey but green line will probably come.
When the market crumbles, opportunities arise. GMXUSDT is no exception.
Blue Box Zone: This is where I’ll take action. If the price reaches this carefully selected area, it’s a solid buying opportunity.
Remember, trading during such volatile times requires confirmation. Tools like CDV, volume profile, and structure breaks on lower time frames are essential.
Stay calm, stay calculated, and let’s make the most of this chaos. Boost, comment, and follow for more winning strategies! 🚀
Let me tell you, this is something special. These insights, these setups—they’re not just good; they’re game-changers. I've spent years refining my approach, and the results speak for themselves. People are always asking, "How do you spot these opportunities?" It’s simple: experience, clarity, and a focus on high-probability moves.
Want to know how I use heatmaps, cumulative volume delta, and volume footprint techniques to find demand zones with precision? I’m happy to share—just send me a message. No cost, no catch. I believe in helping people make smarter decisions.
Here are some of my recent analyses. Each one highlights key opportunities:
🚀 GMTUSDT: %35 FAST REJECTION FROM THE RED BOX
🎯 ZENUSDT.P: Patience & Profitability | %230 Reaction from the Sniper Entry
🐶 DOGEUSDT.P: Next Move
🎨 RENDERUSDT.P: Opportunity of the Month
💎 ETHUSDT.P: Where to Retrace
🟢 BNBUSDT.P: Potential Surge
📊 BTC Dominance: Reaction Zone
🌊 WAVESUSDT.P: Demand Zone Potential
🟣 UNIUSDT.P: Long-Term Trade
🔵 XRPUSDT.P: Entry Zones
🔗 LINKUSDT.P: Follow The River
📈 BTCUSDT.P: Two Key Demand Zones
🟩 POLUSDT: Bullish Momentum
🌟 PENDLEUSDT.P: Where Opportunity Meets Precision
🔥 BTCUSDT.P: Liquidation of Highly Leveraged Longs
🌊 SOLUSDT.P: SOL's Dip - Your Opportunity
🐸 1000PEPEUSDT.P: Prime Bounce Zone Unlocked
🚀 ETHUSDT.P: Set to Explode - Don't Miss This Game Changer
🤖 IQUSDT: Smart Plan
⚡️ PONDUSDT: A Trade Not Taken Is Better Than a Losing One
💼 STMXUSDT: 2 Buying Areas
🐢 TURBOUSDT: Buy Zones and Buyer Presence
🌍 ICPUSDT.P: Massive Upside Potential | Check the Trade Update For Seeing Results
🟠 IDEXUSDT: Spot Buy Area | %26 Profit if You Trade with MSB
📌 USUALUSDT: Buyers Are Active + %70 Profit in Total
🌟 FORTHUSDT: Sniper Entry +%26 Reaction
🐳 QKCUSDT: Sniper Entry +%57 Reaction
📊 BTC.D: Retest of Key Area Highly Likely
This list? It’s just a small piece of what I’ve been working on. There’s so much more. Go check my profile, see the results for yourself. My goal is simple: provide value and help you win. If you’ve got questions, I’ve got answers. Let’s get to work!

#GMX (SPOT) IN (29- 33) T. (85) SL(27.19)BINANCE:GMXUSDT
#GMX / USDT
Entry (29- 33)
SL 4H close below 27.19
T1 35
T2 36
T3 42
T4 85
______________________________________________________________
Golden Advices.
********************
* collect the coin slowly in the entry range.
* Please calculate your losses before the entry.
* Do not enter any trade you find it not suitable for you.
* No FOMO - No Rush , it is a long journey.
Useful Tags.
****************
My total posts
www.tradingview.com
1Million Journey
www.tradingview.com
www.tradingview.com
**********************************************************************************************
#Manta #OMNI #DYM #AI #IO #XAI #ACE #NFP #RAD #WLD #ORDI #BLUR #SUI #VOXEL #AEVO #VITE #APE #RDNT #FLUX #NMR #VANRY #TRB #HBAR #DGB #XEC #ERN #ALT #IO #ACA #HIVE #ASTR #ARDR #PIXEL #LTO #AERGO #SCRT #ATA #HOOK #FLOW #KSM #HFT #MINA #DATA #SC #JOE #RDNT #IQ #CFX #BICO #CTSI #KMD #FXS #DEGO #FORTH #AST #PORTAL #CYBER #RIF #ENJ #ZIL #APT #GALA #STEEM #ONE #LINK #NTRN #COTI #RENDER #ICX #IMX #ALICE #PYR #PORTAL #GRT #GMT #IDEX #NEAR #ICP #ETH #QTUM #VET #QNT #API3 #BURGER #MOVR #SKL #BAND #ETHFI #SAND #IOTX #T #GTC #PDA #GMX

GMXUSDT: 550% Profit PotentialGMXUSDT on the 4-hour timeframe is exhibiting a strong bullish setup with a potential 550% profit at 10x leverage. This long trade opportunity, identified using the Risological Swing Trading Indicator , is positioned to deliver significant returns. The price has broken through key resistance levels, confirming upward momentum.
Key Levels:
Entry: $29.525
SL: $26.955
TP1: $32.695 🔄
TP2: $37.825 🔄
TP3: $42.960 🔄
TP4: $46.130 🔄
Technical Analysis:
The trade commenced at $29.525, with a protective stop-loss at $26.955, ensuring a favorable risk-to-reward ratio. The price action has remained firmly above the Risological trend line, underscoring the strength of the current uptrend. Fibonacci extensions validate the profit targets, while the breakout above resistance levels signals a likely continuation to the upper targets. This setup demonstrates the precision and reliability of the Risological Swing Trading Indicator in identifying high-potential opportunities with controlled risk.
All the best!
Namaste!

#GMX: Profiting From Decentralized PerpetualsDescription:
This trading idea highlights GMX, the utility and governance token of the GMX protocol, a leading decentralized exchange for perpetual contracts and spot trading. GMX enables traders to execute leveraged positions with low fees and zero price impact, providing a unique value proposition in the DeFi ecosystem. The platform’s innovative architecture and its focus on transparency and security have garnered a growing user base and increased adoption. Additionally, GMX token holders benefit from protocol revenue sharing, further enhancing its appeal as a long-term asset.
Despite its potential, it’s important to recognize that the cryptocurrency market is highly volatile, with prices subject to significant fluctuations due to external factors such as regulatory changes, market sentiment, and macroeconomic trends. Investing in GMX requires careful consideration and a disciplined approach to risk management.
Disclaimer:
This trading idea is for educational purposes only and does not constitute financial advice. Trading cryptocurrencies like GMX involves significant risks, including the possibility of complete loss of capital. Always conduct thorough research, evaluate your financial position, and consult with a financial advisor before making any investment decisions. Past performance is not indicative of future results.

What currencies are Trend 2025?hello friends
This altcoin, which is active in the field of DEFI and can grow well in 2025, is now in a good range with the correction it has made, so it is a step to buy.
The second step is the lower range that we specified for you.
Note that DEX tokens can experience good growth in 2025.
So be sure to have it in your basket.
Be successful and profitable.

$GMX is bullishThe chart speaks for itself. I'm expecting this bullback to take the price a bit lower then a huge price surge. Just sell when the price reached around that white box. around 60-65$ and don't get greedy.
GMXUSDT Short Setup Crushes TP1! Bearish Momentum Eyes TP4GMXUSDT on the 4-Hour timeframe executed a short trade setup, successfully hitting TP1 and showing strong momentum to likely reach the remaining targets.
Trade Highlights:
Entry: $36.805
TP1: $30.815 (DONE)
TP2: $21.125
TP3: $11.430
TP4: $5.445
Stop Loss: $41.650
Technical Insights:
The downtrend is well-supported by bearish confirmations from the Risological Trading Indicator , with clear rejection at resistance levels. Momentum indicators suggest a continuation of the bearish move.

[GMX] could increase its price between (+76%) to (+110%)GMX is trying to get above the anchored vwap from apr 2023 high and if it can close a weekly candle above $38,85 it will be a good sign to get to higher prices, it is above value area high since may this year to now and broke the falling wedge in the monthly timeframe. The target is between fibonacci retracement levels, value area high from 2023 highs and monthly level.
TARGET: $63,260 TO $76,105 up to (+110%)

GMX Uptrend CountMy primary count considers we're currently in green wave III inside blue wave 3.
Pullbacks are buying opportunities.
We probably won't see anything below 35.00 again.

GMXUSDT: The Blue Box as a Strong Demand ZoneThe blue box on this chart highlights a carefully identified demand zone, which signals a key area of potential buying interest. This zone is derived from technical analysis and represents a level where buyers are likely to regain control, pushing prices higher. Here's a detailed breakdown of this analysis:
1. Understanding the Demand Zone
A demand zone is a price area where significant buying interest exists, often leading to a reversal or sustained upward move. These zones are derived from historical price action and are reinforced by various confluence factors.
Blue Box Characteristics: This blue box represents a primary demand zone. It is based on the last significant area of consolidation before a strong bullish move, making it a key level of support.
Confidence Level: The blue box is considered high-confidence due to confluences such as Fibonacci retracement levels, order block dynamics, and volume profile analysis.
2. How Was This Zone Identified?
This demand zone is drawn using the following methods:
Fibonacci Retracement: The 0.618–0.786 range, drawn from the last swing low to swing high, aligns with the demand zone.
Order Block Analysis: The blue box highlights the last bearish candle before a significant bullish breakout, indicating institutional activity.
Volume Profile: This zone coincides with a high-volume node, suggesting strong accumulation by market participants.
Market Structure: The zone respects the higher low pattern in the overall bullish structure, reinforcing its importance.
3. How to Trade the Blue Box
When the price approaches the blue box, consider the following strategies:
Wait for Confirmation: Monitor the price action for bullish signals, such as a hammer, engulfing candle, or bullish divergence on RSI/MACD.
Set Stop-Loss Orders: Place stop-losses slightly below the demand zone to account for potential false breakouts.
Target Levels: Set take-profit levels at the next resistance zones or Fibonacci extension levels (e.g., 1.272 or 1.618).
4. Additional Confirmation Signals
Strengthen the reliability of trades using these signals:
Volume Spikes: Look for increased volume as the price enters the blue box, signaling buyer interest.
Bullish Divergences: Identify divergences between price and momentum indicators like RSI or MACD.
Break of Local Resistance: A strong break above nearby resistance after testing the blue box further validates the demand zone.
5. Example Scenarios
Scenario 1: Price retraces into the blue box and forms a bullish engulfing candle. Enter a long position with a stop-loss below the zone and target the previous swing high.
Scenario 2: Price consolidates within the blue box, forming higher lows on lower timeframes. This signals accumulation, presenting a lower-risk entry.
This analysis is designed to provide clarity and actionable insights for your trading. While no strategy is infallible, the blue box demand zone offers a high-probability setup based on proven technical principles.
I keep my charts clean and simple because I believe clarity leads to better decisions.
My approach is built on years of experience and a solid track record. I don’t claim to know it all, but I’m confident in my ability to spot high-probability setups.
My Previous Analysis
🐶 DOGEUSDT.P: Next Move
🎨 RENDERUSDT.P: Opportunity of the Month
💎 ETHUSDT.P: Where to Retrace
🟢 BNBUSDT.P: Potential Surge
📊 BTC Dominance: Reaction Zone
🌊 WAVESUSDT.P: Demand Zone Potential
🟣 UNIUSDT.P: Long-Term Trade
🔵 XRPUSDT.P: Entry Zones
🔗 LINKUSDT.P: Follow The River
📈 BTCUSDT.P: Two Key Demand Zones
🟩 POLUSDT: Bullish Momentum
🌟 PENDLEUSDT: Where Opportunity Meets Precision
🔥 BTCUSDT.P: Liquidation of Highly Leveraged Longs
🌊 SOLUSDT.P: SOL's Dip - Your Opportunity
🐸 1000PEPEUSDT.P: Prime Bounce Zone Unlocked
🚀 ETHUSDT.P: Set to Explode - Don't Miss This Game Changer
🤖 IQUSDT: Smart Plan
⚡️ PONDUSDT: A Trade Not Taken Is Better Than a Losing One
💼 STMXUSDT: 2 Buying Areas
