Bearish-Crab PatternGood morning and good weekend to everyone. We now are climbing steady. We since noon yesterday now can see a trend going up successfully. The market has flipped a switch to follow another Flubberbuster. We now have a Bearish-Crab pattern. We all on February 11 are going to a 1.10 mark. Small dip is able to be possible at 1.05 this evening. We on the 10 at 2:30 will enter a dip down to .9103030 or lower. This morning we all can see dip after 1.05. On February 9 we all can see a dip to .92916 or less. Not moneies advice. The gains forward.
GRTPERP trade ideas


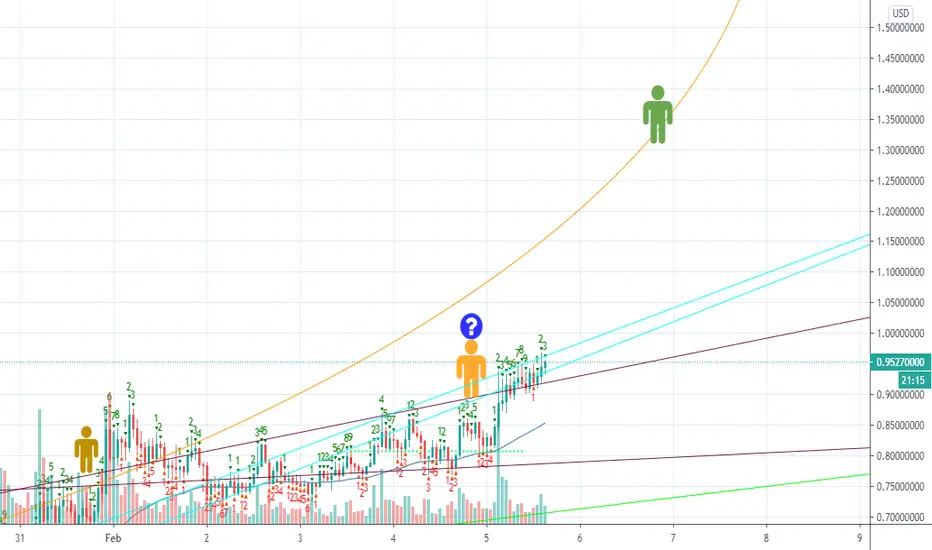
GRTUSD Bearish Crab PatternGRTUSD Bearish Crab Pattern
Depending on Bitcoin's performance we could see GRT touch the $1.15-1.17 area.
Point B of the harmonic is the most important (POINT) in the development of this pattern.
Point B's candles closed below the .786 making this a valid Bearish crab pattern.
All patterns can fail depending on Bitcoin!


#GRT is free to launch now. Buy everything below 1$.$GRT is free to launch now. Buy everything below 1$.
Do not miss the rocket 🚀


GRT NEW SUPPORT LEVELHI GUYS!
Congrats to everyone who took their profits out at $1. I know you been patiently waiting for that moment. looks like we do have a strong support at $.86 - $.87. What is your next prediction for GRT?

The Graph TokenHello Traders,
The GRT is showing a lot of potential upside. We already seen an initial push to the upside upon release on Coinbase. We then had a period of accumulation forming the cup. The handle has already finished forming as well. We also have a W shape forming currently. The break of the cup head will push this token to $1.15 as the profit target. With this setup CUP and HANDLE. You will typically see that 80-90% of the time it reaches the 1 to 1 measure move of the cup (take profit area) and then reverses back to retest the top of the cup before moving higher. The new accumulation phase will take longer before a push above all time high will happen.
If you also look at GRT/ETH pair, you will see that GRT will out perform ETH by 70-80% at current price. Meaning it is better to hold GRT over Ethereum for this next month.
Let me know what you think.


Thoughts .... GRTUSD ?At 0.425 i shared here that GRTUSD to be trading above a dollar..
Its has reached 0.95 :)
So what you guys think about? where it will be heading ? :)
i also shared about NUUSD momentum and its much higher aswell :)
look my previous ideas shared here
your like and support will motivate me to keep sharing :)
Happy Trading :)
GRT: Buckle Up!GRT is breakout out of the correction from earlier this week. Put your astronaut suits on. We're going to the moon.

GRT A cup 'n handle to go with your price discoveryObvious cup and handle to break into new ATH and price discovery for GRT. This is clearly an Elliott Wave 3. I posted a $1.95 target for the third wave, but I'm beginning to think that's too conservative as GRT has such strong momentum. That was the 2.618 Fibo extension. Let's move that up to the 4.618 extension at $3.38. Of course, there will be pullbacks along the way, but GRT is doing what GRT does.


$GRT Technical Analysis (BULLISH)What's up everybody! Thanks for taking the time to check out my detailed analysis of The Graph's $GRT! This is only my 3rd published Idea, but likely my most technical so let's get right into it! TL;DR at the bottom!
It's looking like $GRT might be gearing up for another run towards the highly sought after level of $1 or more! Before this happens though, there are a few things that I personally would like to see that would give the next leg up a little more power...
1) RSI - 4H chart: The RSI gradually finding support between the 55-45 range. This would indicate a healthy, prolonged consolidation period and more room to rock back up to 80.
2) MACD - 4H chart: The MACD gradually forming another bullish cross between 0.024-0.01 would indicating a new upward trend beginning.
3) Maintaining Support: The bottom of the recent bullish pennant must hold as support. If it fails to do so, we will likely see a retrace the the mid-level or lower-level of the macro broadening ascending wedge.
Using Fibonacci Extensions, I created Fib cluster ranges for the 61.8%, 78.6%, and 100% extension levels. For you swing traders, these can be used as Take Profit/reversal ranges that we will likely hit on the next run up.
Coincidentally, when the $0.27 correction at the beginning of the ascending wedge is applied the average close price of the most recent pennant, a $0.27 rally would take us to $1.08... right in the middle of the extension clusters!
TL;DR
RSI and MACD could fall a little further before the next run. 55-45 and 0.024-0.010 respectively would be ideal IMO.
Fib extension clusters point to $1+ soon.
I will be taking profit in the middle of these clusters at $1.08
Feel free to comment your opinion, and give this a thumbs up if you found it useful!
*This is NOT trading advice. I am NOT a financial advisor. What is shown and said in this analysis is purely speculation. Remember to trade with a stop-loss and DYOR!*

GRT | Cup & Handle Formation Play OutI had anticipated a broadening descending wedge formation playing out, until aggressive buyers breached this trend-line much earlier than expected. However, the price has and continues to be rejected at the completed cup rim, which is very common in this formation.
Dropping volumes, a red hot daily RSI along with other technical’s still lead me to believe that the handle has not played out fully yet. I anticipate a slight down trend leading to the forming of the handle on the 4hr+ time frames, where I will look to make some entries around the $0.66 - $0.70. These entries will be appetisers, as until the breakout confirmation; by way of a decisive breach and daily close above the upper resistance trend-line happens, I will remain unconvinced about the $1 breach just yet.
The drop to my target price area in the descending channel will also gain further price traction for a stronger push and close over the $1.
BTC price action should also be referenced for market conditions and volatility.
This is crypto and we are in a bullish cycle, so anything can happen, but key fundamentals and technical’s should be observed before selling your family and going all in.
Let me know your thoughts and drop some feedback.

The Ten Day Shit Good morning to every one! We all are in a support level between the .899 and .687. If we shit by the 8th , we can see .48 by noon on February 11th. However, through out this descending wedge pattern, we can see a profit of chances of gains of 30% if you put buy in properly in time. After these period of 7 days there is slight chance we can be “walking the dog” for 3 days or more.

Are we ready for $1 ?RSI LOOKS GOOD
MACD LOOKS GOOD
ICHIMOKU LOOKS GOOD
MA LOOKS GOOD
what is it going to do?

GRT has fundamental potentialmost people are over-sized #DeFi and undersized utilities;
• $GRT, the crypto indexer; i.e. google search engine of #Crypto;
• token unlock upcoming only in March so this still has time to run;
• $1 take-profit; with potential for price discovery.

CUP AND HANDLE M15Looks like it could also be forming a cup and handle pattern on the m15 timeframe.

GRT CUP AND HANDLEGRT forming a cup and handle pattern. We should soon see massive move on the upside.


Technical Analysis & Predictions 2/3/21*DISCLAIMER: I am not a financial advisor and this is not financial advice as these are purely my opinions and speculations. I may also own or trade any of the symbols and cryptocurrencies mentioned in this video so do not make your trading or investing decisions based on this video. I do not guarantee any results nor am I responsible for your actions. You should always do your own due diligence before trading or investing in this market as it is extremely risky. Affiliate links are also included in this same video description section here and if you decide to support me by using any of them, I may receive a referral bonus or commission.
*Follow me for the latest cryptocurrency analyses on my watchlist
*Thank you to those who donated, I very much appreciate it.
*Let me know in the comment section if you agree or disagree, would love to hear your ideas too.
