Can GRT Prices smash through to $0.13?!
GRT price resiliently hovering above $0.080.
Potential bounce back target set for $0.13.
Death cross and triangle breakdown observed.
Despite 288% rise, GRT slipped below $0.10.
Bullish support spotted at $0.0868.
78.60% Fibonacci level tests at $0.0868, indicating bullish potential.
Double bottom pattern hints at upward trajectory.
RSI showcases bullish divergence at $0.0868.
Bullish reversal could challenge $0.1128.
If resistance prevails, a potential fall to $0.0537.
GRTPERP trade ideas

Late to the dump party but still... Why is this happening
BITSTAMP:BTCUSD pre halving year, expected downturn
BITSTAMP:BTCUSD breaking important trendline in log
BITSTAMP:ETHUSD getting crushed
VANTAGE:BTCETH Bearish patterns
COINBASE:BTCUSD 6 months straight up, summer lull incoming
CRYPTOCAP:TOTAL3 Doing Lower lows since beginning of year.

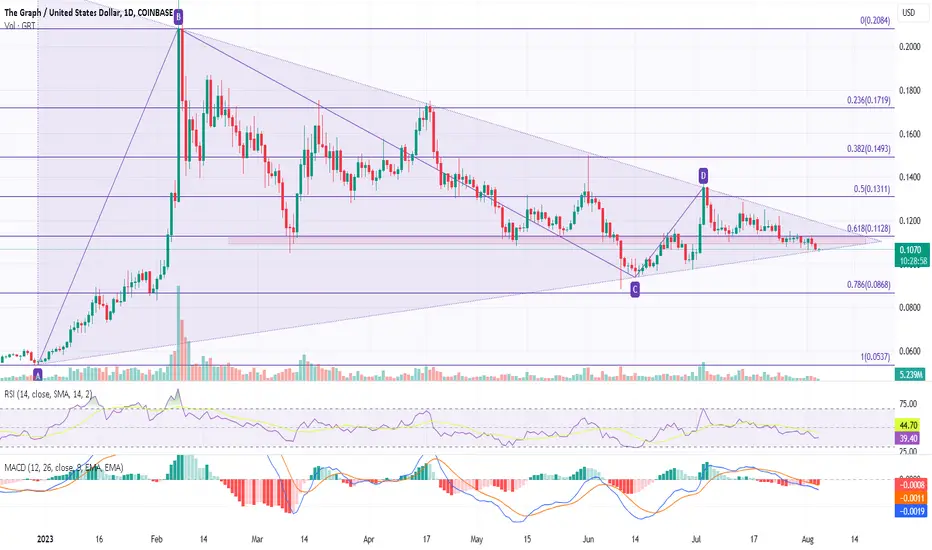
Will GRT prices break below this triangle and $0.10?GRT coin price falls 5.38% in the last three days, breaking crucial support at $0.1128.
Triangle pattern support trendline provides some relief to the downtrend.
Intraday fall of 0.94% hints at a potential bearish breakdown of the triangle pattern.
Unable to stay above the 61.80% Fibonacci level at $0.1128, GRT faces strong selling pressure and multiple bearish candles.
Falling prices and increased trading volume signal a possible bearish breakout.
RSI and MACD indicators show solid bearish signals, with RSI falling below the midline and MACD entering negative territory with growing bearish histograms.
Breakdown rally could lead to a 14.5% plunge, with next support at $0.086 (78.6% Fibonacci level).
Bullish dominance could end at the psychological mark of $0.10.
If GRT buyers hold off selling at $0.086, a bullish reversal may challenge the $0.1128 overhead resistance.
2500% + GRTJSE:GRT fills me with a great deal of enthusiasm, and I am confident that in the not too distant future, the price of GRT will climb to a new high point, surpassing all previous records.

GRT Prices Ready To Outgrow The Triangle, Aims at $0.20
GRT price action has formed a triangle pattern, suggesting a possible breakout in the near future.
The triangle breakout could propel GRT prices toward the $0.20 mark, a significant psychological level.
Following a 288% recovery in early 2023, GRT prices failed to breach the $0.20 threshold, leading to a decline. Despite the declining trend, prices found consistent support at the $0.10 level.
Current GRT prices hover around $0.1101, finding support at the 38.20% Fibonacci level. The trend nears the triangle tip, indicating a likely breakout.
Volume has been decreasing, which may indicate a potential price bounceback.
The RSI line is following a declining trend and is currently beneath the halfway mark, suggesting a bearish sentiment.
Despite a 1.61% drop in the last 24 hours, if prices manage to hold above the $0.115 support level, a bullish breakout may occur. This could take GRT prices above the $0.15 level, near the 61.8% Fibonacci level, and possibly up to $0.20.
Conversely, if a downward breakout happens, GRT prices could fall by 20%, potentially testing the 23.60% Fibonacci level at the $0.0886 mark.

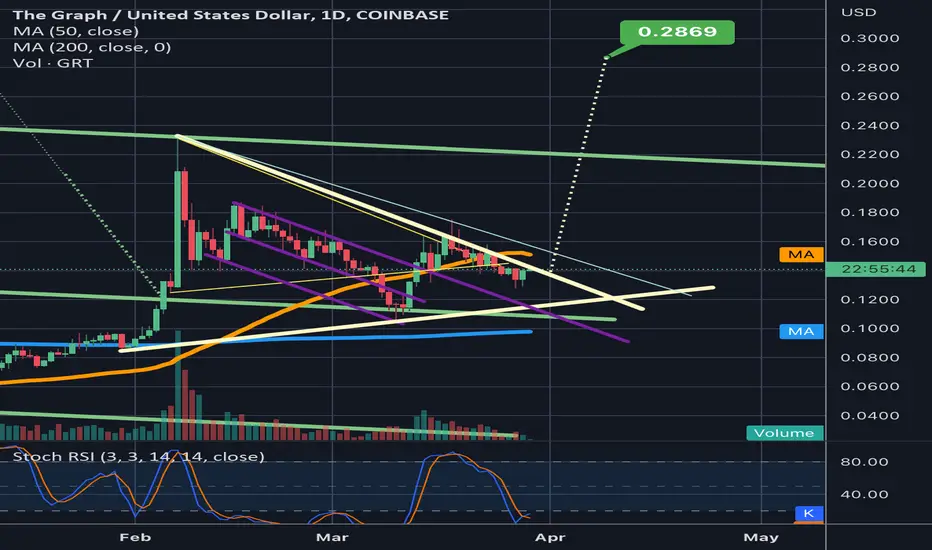
GTRUSD: Attempting a huge bullish breakoutGTRUSD hit the top of the 5 month Channel Down, crossing over both the 1D MA50 and 1D MA200. This strong push is turning the 1D technicals overbought (RSI = 69.283, MACD = 0.001, ADX = 31.945) but such conditions don't call for the traditional short.
Instead this is usually the buy entry conditions that usually emerge when cryptos break above long term bearish structures. Consequently, if the 1D candle closes over the top of the Channel Down, we will buy and aim for a parabolic rally near the 1.382 Fibonacci level (TP = 0.30000).
## If you like our free content follow our profile to get more daily ideas. ##
## Comments and likes are greatly appreciated. ##


GRTUSD (1H) - Bearish breakoutHi Traders
GRTUSD (1H Timeframe)
The market is in a downtrend and we are waiting for an entry signal to go SHORT below the 0.0998 support level. Only the upward break of 0.1046 would cancel the bearish scenario.
Trade details
Entry: 0.0998
Stop loss: 0.1046
Take profit 1: 0.0968
Take profit 2: 0.0920
Score: 8
Strategy: Bearish breakout

GRT / USDT Target, One of the big winners for the upcoming big run in 2025.
Will Sell some around $0.30

$GRT long to $1+?JSE:GRT looks great here.
As you can see from the chart, JSE:GRT has formed a large bull flag. Upon breakout to the upside, the first target to hit would be $.32. If it can get above that I think it can hit $1 or $1.46.
Let's see what happens in the coming months.

The Graph on Daily | Very Low Risk High RewardThe chart says it all on this one. The stop loss is definitely a higher percentage than I usually like to do, but the risk reward is super low.


Ready to GoGRT is another AI play that looks ready to breakout for another leg higher. Successfully retested and now coiling under down trend resistance. Need to see big volume on any breakout. If so, likely heads towards $0.30

The Graphhello everyone...
graph is out of the falling wedge... made a strong movement and currently trading above the 0.14
the next main resistance is 0.33 which is highly possible since the weekly rsi is above 50
I think the bear cycle has completely ended for this coin and bull has taken over for long run
good luck

RSI Spikes an correlating market structure.When using .768 and .236 for the upper and lower RS] bands, and then drawing a rectangle around all correlated candles, you can see how clearly the market reacts to these areas of interests in high value.
When, combined with the three primary market sessions drawn as an indicator based on Jerusalem time zone, it is clear to see how to exploit this and time your entries and exits with a moderately higher chance of accuracy than without or with traditional Fibonacci levels. I will often draw a candle around the first 15 minutes of market price in the day based on Jerusalem the timezone, (not showing on chart) thusly, giving a very accurate area of interest and high value as well.

RSI Spikes an correlating market structure.When using .768 and .236 for the upper and lower RSI bands, and then drawing a rectangle around all correlated candles, you can see how clearly the market reacts to these areas of interests in high value. When, combined with the three primary market sessions drawn as an indicator based on Jerusalem time zone, it is clear to see how to exploit this and time your entries and exits with a moderately higher chance of accuracy than without or with traditional Fibonacci levels. I will often draw a candle around the first 15 minutes of market price in the day based on Jerusalem the timezone, (not showing on chart) thusly, giving a very accurate area of interest and high value as well.

$GRT TREND CHANGEa change of trend has been confirmed on the following metrics
price above and supported by the 18 week high/low channel (one of my personal favorites)
adherence to channel fib retracement levels
long term horizontal fib shows amazing potential

GRT Triangle bigger than originally thought.After several candle close outside of the original yellow triangle, it is clear that the more valid triangle is now this bigger tan triangle. We can see the top trendline of the tan triangles trajectory angle also matches the angle of the purple descending channels as well for added confluence. While that means we haven’t yet actually broken up out of the triangle just yet, the good news is when we do the breakout target will be higher than original expected. I arbitrarily placed the breakout measured move target line here for a rough estimate. opefully it breaks out of the triangle somewhere close to this region. *not financial advice*
GRTUSDT1. H&S forming on The Graph 4 Hour
2. TP's on Screen
3. Every Pump last 2 weeks was just manipulated into a Sell Order Block

GRTUSD breaking up from symmetrical triangleShown here in yellow. If price action holds the 1 day 50ma (in orange) as solid support. The triangle should break up and take us above the horizontal green channel trendline. *not financial advice*

GRTUSD long (76 % gains) NEWGRTUSD has been correcting after making 320 % gains and currently the price remains under the downsloping reistance line.
Spot trading - Long setup:
entry: 0,1189 $
Target: 0,21 $
Good luck
