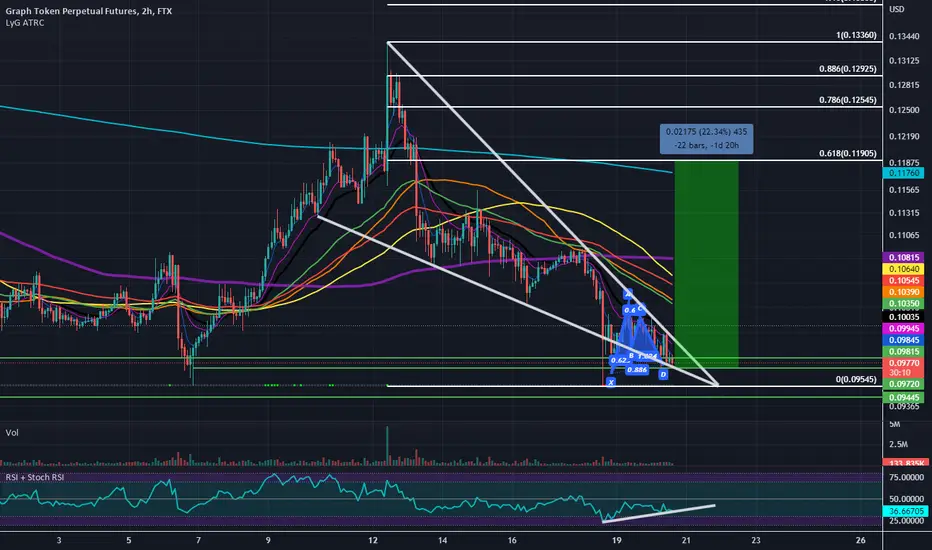
GRTUSD On the 4H MA50 again, bullish short termGRTUSD hit today the 4H MA50 (blue line), where last time had a rejection (Nov 23).
Pattern: Falling Wedge, 4H time frame.
Action: Buy target Fibonacci 0.5 and 0.618.
Sell if rejected on the top of Falling Wedge, target 0.05200 support and -0.382 Fibonacci.
Buy above the 1D MA200 (orange line).
Please like, follow and comment!!
GRTPERP trade ideas

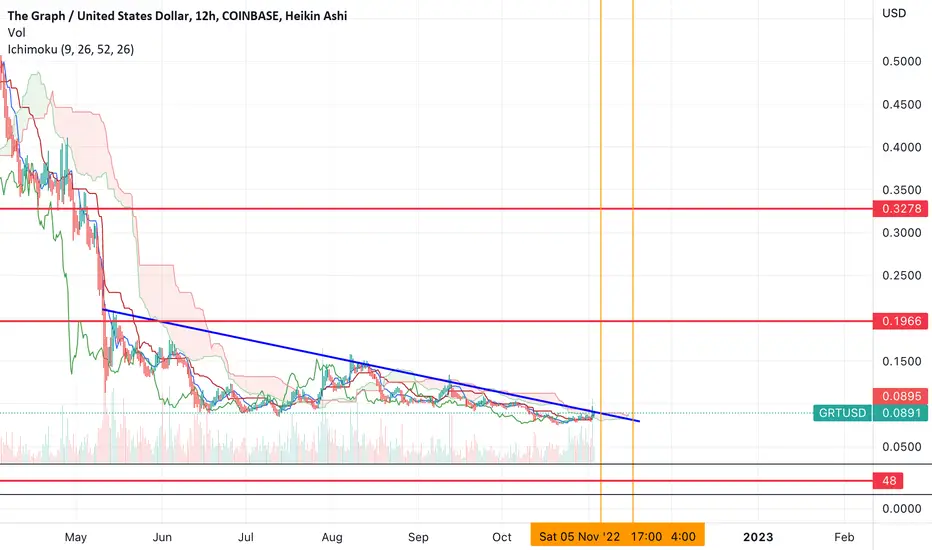
Could $GRT run to $.32 from these levels?A lot of alts are seeing exit pumps and I think the ones that have been coiled the longest will run the furthest. GRT looks like it retested the lows yesterday and is now ready to run.
I could see GRT doing a 3x from here. First level it would need to break is $.16, then $.20, and if it makes it over those two levels, I think $.32 is likely.
Let's see what happens in the coming weeks.
TheGraph Protocol- Keep things simple.
- Big projects take time but will make the safest rewards.
-------------------------------------
Medium Term Targets
-------------------------------------
TP1 : 0.5$
TP2 : before 1.8$
-------------------------------------
SL : No need
-------------------------------------
Happy Tr4Ding !

GRT RSI bullish div possible bottomHello, i just bought GRT in spot, but if you want to trade it wait for confirmation when trend line breaks.

GRT USD$Possible temporary low/ double bottom for grt, this one has been crucial maybe it will show some relief soon.

All on the GRAPH - web3Target as shown
Geometric charting
Fibs
NOT TARDING ADVICE
GRI2022
The Graph is an indexing protocol for querying networks like Ethereum and IPFS. Anyone can build and publish open APIs, called subgraphs, making data easily accessible.
Subgraphs can be composed into a global graph of all the world's public information. This data can be transformed, organized, and shared across applications for anyone to query with just a few keystrokes.
Before The Graph, teams had to develop and operate proprietary indexing servers. This required significant engineering and hardware resources and broke the important security properties required for decentralization.
thegraph.com

BEAR CYCLE ALMOST COMPLETEGet your cash ready and watch you bags fill up! This cycle is almost complete. 365 year.

GRTHELLO GUYS THIS MY IDEA 💡ABOUT GRT is nice to see strong volume area....
Where is lot of contract accumulated..
I thing that the sellers from this area will be defend this short position..
and when the price come back to this area, strong sellers will be push up the market again..
DOWNTREND + Resistance from the past + Strong volume area is my mainly reason for this short trade..
IF you like my work please like share and follow thanks
TURTLE TRADER 🐢

Falling Wedge With Bullish Divergence and Bullish Deep GartleyWe have a promising looking Falling Wedge Visible on the Hourlies with a small Deep Gartley at the Bottom. My target here will be the .618 retrace and the SL will be below the previous major low to our left.
GRT will fly north soonWe are expecting wave 2 soon, i expect this is a leading diagonal wave 1 now
stay tuned


GRTUSD GRAPH TOKEN - INVERSE H&S Spotted on the 4hr.Traders,
Spotted this inverse Head and Shoulders on the 4hr. If that neckline breaks to the upside Graph Token could finally escape this long-trending bullish descending wedge it has remained in for about one year!
Target for the 4hr trade is 11.5 cents.
LMK if you enter.
Best to you!
Stew

GRTUSD - How you like them apples?"My boy's wicked smaht."
Recent history on GRTUSD
Weekly : Price action at the historical low when the coin was first on market.
4 hour : Inverted H&S Confirmed; Neck line broke through and back-tested.
Currently on GRTUSD
Daily : Continuation Pattern (Pennant) with tightening price range
4 hour : Classic Divergence on MACD
4 hour : Bollinger Bands pinching


GRTUSD (1H) Bullish reversalHi Traders
GRTUSD (1H Timeframe)
Waiting for the upward break of 0.125 resistance level, which will complete a bullish trend reversal pattern to go LONG. Only the downward break of 0.114 would cancel the bullish scenario.
Trade details
Entry: 0.125
Stop loss: 0.114
Take profit 1: 0.131
Take profit 2: 0.141
Score: 8
Strategy: Bullish reversal


GRT: hydrogen gas station on mars is here The graph is ready to take off. I see GRT going up and do to its unique structured use cased utility as data query goes. GRT is like extracting Hydrogen from Water & creating a super Gas station on Mars as this blows past the moon.

GRTUSD: Inverted Head and Shoulders on 4 HourIf we are lucky we will see GRT atleast Rally up to the 200 SMA on the 4 Hour from here.

GRTUSD long term buySet it and forget it. Throw a buck in, and set a sell order at $1.80 and just forget about it. This setup reminds me so much of a setup in MANA in 2018 / 2019. I'm not going to miss this one. Just because the market looks bearish does not necessarily mean it will continue indefinitely.


Graph Protocol Relief RallyNear-term long positions are attractive, with reassessment necessary as inflation reporting in April approaches. Bullish continuation will be more risky in the days leading up to CPI/PPI reporting.
Following Bitcoin and the broader markets, GRT will realize near-term bullish support as the markets have shrugged of the Fed's 25 bps rate hike.
GRT will flip 20 EMA into support, then push through 100 EMA... ultimately testing 200 EMA until next round of economic reporting.
Sharply rising prices are elected to continue as there's been no substantive change to monetary policy, QE continues, corporations continue elevated pace of stock buybacks.
Inflation results for March (CPI & PPI) will be published by BLS on 4/12 & 4/13 with high likelihood of further increases from the lagging reporting.
April reports will be a pivotal as the FOMC will not meet until early May with the April inflation results published a week after the Fed meeting.
Current expectation is shockingly higher inflation with the Fed's hand being forced, either accept persistent inflation and risk a wage-price spiral or adjust approach with more hawkish action and less reliance on hollow words.
Maintaining status quo until midterm elections is likely to become untenable, recession risk is increasing.

Time to go? (Part IV)Pushing against top of channel now. What a day. How many licks will it take to get to the center of this tootsie pop? Can we blast out straight away? Maybe we fail? Any thoughts?

