GRTUSDT 4h ANALYSISGRTUSDT 12h ANALYSIS
It is currently showing resistance in the downward trend.
It is expected to rise sharply if it rises above the downward trend and retests.
GRTUSDT.PS trade ideas

GRT USDTIm not sure about it but i think that the price going to retrace up to the marked erea and after that its possible to another impulse to the upside !
pay attention :
NFA - DYOR - IMO


GRT USDT HEllo guys this my trading idea about GRT Usdt .
my idea is waiting for the pull back with confirmation and open Long .
my 1 Target 🎯 0.1143
my 2 Target 🎯 0.1233
my 3 Target 🎯 0.1270
ENTER AT YOUR OWN RISK ⚠️
TURTLE TRADER🐢

GRT/USDT BREAK OUT! READY FOR A 70% MOVE TO UPSIDE!!Hello everyone, if you like the idea, do not forget to support with a like and follow.
Welcome to this GRT/USDT trade setup.
GRT looks good in the daily time frame. Breaking out from the falling wedge-like structure. Accumulate this and hold for a big profit.
Entry range:- $0.110-$0.118
Target1:- $0.134
Target2:- $0.160
Target3:- $0.18
Target4:- $0.20
SL:- $0.102
If you like this idea then do support it with like and follow.
Also, share your views in the comment section.
Thank You!

GRT/USD - Juicy breakout in progress. 😍GRT - this thing can run if the market allows.
Downtrend appears finished in my eyes. Bullish indicators and chart/price action.
A good target 0.12$ if momentum picks up. Volume is not that great, but decent.
Bias is bullish, but watch BTC/ETH as they are about to decide where they go next.
Like and follow if you liked my idea!

GRT/USD - Breakout approaching key resistance! 🚀If you checked my past analysis, this pump was pretty much in the cards for a while.
What I did not anticipate was this re-test of the breakout with the price falling on the top of this wedge to confirm it as support.
Nevertheless, the price action is clear and GRT is well on its way towards 12 cents.
Some profit taking at 12 cents could take place so best to consider what is your timeframe for this play.
GRT could very well go much higher, the ATH was at $1.3 so about 10x from here. Bias remains bullish for now.
Like and follow if you liked my idea!

2022-07-19 _ GRTUSDT AnalysisGRTUSDT is not accumulating and soon it will break out. as it will break the it will bullish . Set the SLs as per FIB lines

GRT Support & resistance's>>>>>>>Hello EveryOne
I Have Tried My Best to Bring the best Possible outcome in this Chart.
We can see head & shoulder pattern's in the chart, must break's neckline at the first,..
In the case of remain above down trend line in Daily-T frame, and completed pullback,
We can entry long trade setup till Red Area Resistance's>>>>>>>>>
Short term support & resistance's marked on the chart.
This is not financial advise.
PLZ DYOR
With hopping success>>>>

Alt season was commingThe main Resistance break will was a huge break for alts and if it breaks 2nd resistance will surely be the alts season
Be patient lets go to the moon

GRTUSDT#GRT/USDT
As predicted, price took out the liquidity present below the support and moved up again aggressively. MACD is showing some bullish momentum, RSI is bought and EMAs are neutral. I am looking forward to entering a long position from $0.092 depending on marjet conditions once price taps into it.

#GRT/USDTAs predicted, price took out the liquidity present below the support and moved up again aggressively. MACD is showing some bullish momentum, RSI is bought and EMAs are neutral. I am looking forward to entering a long position from $0.092 depending on marjet conditions once price taps into it.


#GRTUSDT 4H Chart
As predicted, price took out the liquidity present below the support and moved up again aggressively. MACD is showing some bullish momentum, RSI is bought and EMAs are neutral. I am looking forward to entering a long position from $0.092 depending on marjet conditions once price taps into it.


GRT forming double bottom patternThe GRT is forming double bottom pattern and base on the chart ,currently bounced off from major soppurt bottom,so as we can see on the chart The price could breaks yellow trend line i will expected price more gain to 0.118 and then 0.125
And if
The price could not move above yellow line we will see move back to bottom.

Grt/usdt analysis GRT/Usdt
This is my idea. I have tried my best to bring the best possible outcome to this chart, Do not consider it FINANCIAL ADVICE.
This chart is likely to help you in making better trade decisions.
I am not a market maker I could be wrong.
Everything is on the chart.
Everything depends on the BTC movement
Thank you

GRTUSDT is testing the 4h resistancesthe price is testing the daily support on 0.09$ inside a falling wedge.
On the 4h timeframe the price is testing the dynamic resistance below the static 4h resistance.
How to approach it?
IF the price is going to have a breakout from the resistances and retest as new support, According to Plancton's strategy , we can set a nice order
–––––
Keep in mind.
🟣 Purple structure -> Monthly structure.
🔴 Red structure -> Weekly structure.
🔵 Blue structure -> Daily structure.
🟡 Yellow structure -> 4h structure.
–––––
Follow the Shrimp 🦐


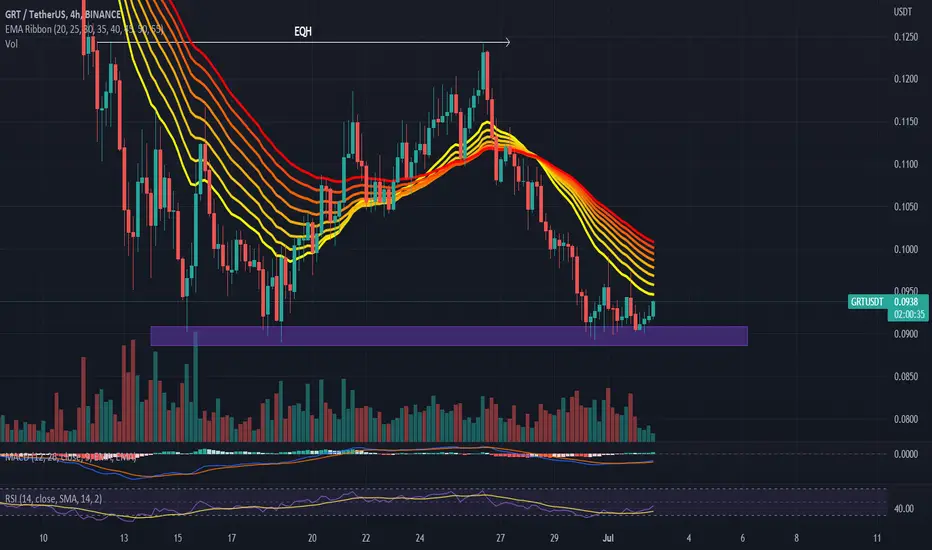
#GRTUSDT 4H Chart
Price is currently bouncing off the support area around $0.9 which has already been tested multiple times. MACD is showing some bullish momentum, RSI is neutral and EMAs are bearish. We might see a sweep of this support area as lots of liquidity is resting below it however overall price should keep moving up in order to take out the equal highs at $0.1245.
Grt analysisGRTUSDT Chart:-
Price is trading in a Downtrend.
Price is taking a correction from 0.125$
Price is also respecting a TL
Price if give a breakout of support then
Sell 0.0918$
TP:- $0.087$ ,0.767$
SL:- $0.105$
#follow it
#keep motivated
#stoploss must

#GRTUSDT THE GRAPHAttempting to plot the expected price movement of THE GRAPH based on waveform analysis and price action.. God knows

