✴️ The Graph | EW Basics With Potential Targets (0.395 & 0.555+)Here we the chart for The Graph (GRTUSDT) and I can easily spot a flat (3-3-5) correction based on Elliot Wave theory.
This tells me that a bullish impulse (5-3-5-3-5) should follow as shown on the chart.
The wave count is just for illustration purposes as the shape of the wave is quite unpredictable, the levels though are easier to predict.
So far we have the first and second waves complete and expecting the third wave which is normally the strongest in volume.
After the low was hit in November 2022 we see an increase in buy volume, this support the change of trend.
The RSI hit its lowest level ever and is now back in the green.
Namaste.
GRTUST trade ideas

GRTUSDGraphtoken
Obv and volume profile paint a bullish picture
Targets short to long term listed
That volume spike means we’ve probably bottomed and will start the reversal run

GRT T-PATTERN & S&R>>>>>>>>>>
I Have Tried My Best to Bring the best Possible outcome in this Chart.
In case GRT price's can Hit and Stablize above COTI top lin of Triangle Pattern's
We have a good opportunity for buyiying position to marked target profit in this uptrend.(red marked zon_strong supply)
PLZ do your own review and set stop first.(alway's buy in correct)
Must important level's marked on the chart.(scroll your mouse on the chart)
It's just an analyze,
Not a financial advise.
PLZ DYOR
With hopping success>>>>>>>>


GrtFor spot buying in two areas, with the specified loss limit. If you made the purchase in the first area, and you wanted to average, the second area and the second loss limit will be activated.

$grtnot started moving yet but looks promising flip yellow go for blue then white IF the god's are with us
not in this trade charted as a request but will hop on if we get the red line on monday

GRTUSD ANALYSIS I SEE small divergence in chart. maybe the second bull wave after break main trend line is weak. and in other side btc shown big divergence. now all alt-coin follow btc as a leader. as a result i think bears become powerful

GRTUSDT ♥ Da Graaaaaaph! We've got an awesome breakout from the triangle pattern leading us to an uptrend continuation set up!
Take profits at around 0.20 - 0.22 ♥
Happy Trading!

#LQR #TOBTC #GRT Strong Resistancethere a important resistance area on the for GRT , which is about 0.1798 - 0.1875
price need to Close a 6H above those level for stay remain in Buliish Otherwise first minor support is about 0.1516

Grt Looks Promising Here Grtusdt
Symmetrical triangle pattern breakout confirmed
Attempting to breakout horizontal resistance 8h time-frame
Higher time frame seems like firming descending channel
Overall incase of breakout expecting 30-40% bullish move for short term
Expecting 100-200% Bullish move in midterm
Risk under your controll do your own reaerch

🔥 GRT Double Triangle: Pending Break OutAs seen on the chart, GRT is currently trading in a short-term and long-term triangle at the same time. As of new, GTR has broken out of the yellow minor triangle.
With BTC edging up, I'd wager that we're going to move towards the purple resistance of the bigger triangle.
Depending on BTC, we can break out or reverse. Longer-term I'm anticipating a break out, targets in blue. Be patient for the break out to occur.

#GRT #Harmonic and #Liquidity Analysis#Harmonic #Analysis for #GRT #GRT/USDT
1% Risk per Every Entry
Entry 1 : 0.17026
Entry 2 : 0.17545
SL : 0.1832
TP 1 : 0.15840
TP 2 : 0.14946
TP 3 : 0.14380

GRT LONG AND SHORT TERM!Hello Traders and everyone, I am Hadi Karaali, Known as SNIPERS_FX
If you like the idea, do not forget to support with a like and follow.
WHAT'S NEXT FOR GRTUSDT
As we can see price broke above our major swing high and traded higher, so from a long-term perspective bulls took over.
So we will be looking for new longs as a trend following one.
For the bulls to kick in from a medium-term perspective we need a break above the marked upper bound, then a movement higher would be expected.
Until that price can still trade lower, and as the price will be approaching the lower support zone, we will be looking for new longs.
If you like this kind of analysis don't forget to like and follow
and as usual follow your trading plan and manage your risk.
Be patient and good luck!

GRT is on the verge of BreakoutGRT or the Graph is going to breakout soon. Now, it is squeezing in between the diagonal trendline and the 200 EMA support in daily chart. I personally think the trend has already changed as the recent furious breakout just retraced and 200 EMA support is holding it in an obvious way. This is a good spot to go for long and the R:R is pretty good. This is a text book setup. Best SL should be below the most recent pivot low below 0.1 usdt


GRT - Echo Bubble PopGRT finds itself at two intersecting resistances.
First is the June 2022 lows, and the second is the year old diagonal.
If we get a close above those two intersecting resistances, then I think it's reasonable to target ~30c.

DestinyFor a new entry, I recommend that you enter when the price breaks 0.1550, and according to the daily analysis, I hope that the ceiling of the channel will be broken and a good growth will occur.

The Graph (GRT) Breaking triangl, moving in upward channel Clearly whats going on.
GRT recently conducted a backtesting of the support supply line of this channel and may be gearing up to resume its upward movement. There is a possibility that it could make a retracement, which would result in a price of $0.62. and more!

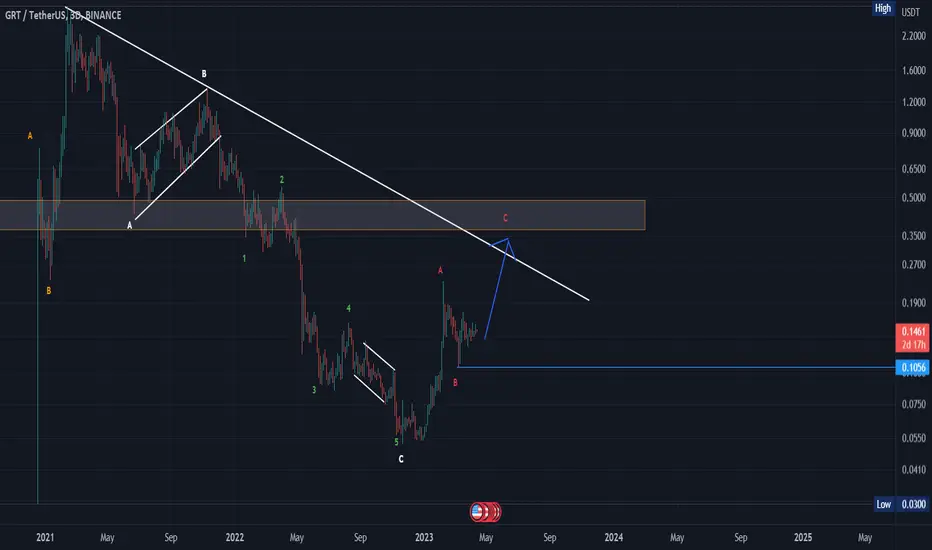
Complete the upward waveIt is possible to see the rise of a five-motive motive in the shaded area to close the C wave..
Note: The bullish pattern fails if it breaks the B area and closes below it at the B area 0.105 usdt
GRTUSDTClearly whats going on.
They do their manipulation, liquidate orders and turn the price. Dont fall for it :)
BIG LONG, no questions asked.
NOT A FINANCIAL ADVICE :)

GRT CAN MAKE A CORRECTIONHi, dear traders. how are you ? Today we have a viewpoint to SELL/SHORT the GRT symbol.
For risk management, please don't forget stop loss and capital management
When we reach the first target, save some profit and then change the stop to entry
Comment if you have any questions
Thank You

future destinyThe structure that I see is clearly an ascending structure, you should also consider that it has been suffering for a long time and it is time to ascend.
