HARDUSDT – Professional Analysis: Blue Box Resistance ZonesHARDUSDT is currently testing crucial levels, and the blue boxes are clearly acting as strong resistance areas. These levels aren’t arbitrary—they've been identified through careful analysis of price behavior and historical reaction, which is why I consistently deliver a high win rate that you can verify on my profile.
Key Insights:
Blue Boxes as Resistance: These zones have repeatedly proven to be where sellers step in, creating significant barriers for upward price movement.
Confirmation is Crucial: I never trade blindly. I wait for clear lower time frame (LTF) confirmations—if HARDUSDT rejects at these resistance levels with a clean LTF downward breakdown and confirmed by CDV signals, that is my cue for a short entry.
Adaptive Strategy: If, by chance, the price breaks above these blue boxes with strong volume and then retests them as support, I will adjust my strategy and consider a long position. I never insist on a short idea; I simply respond to what the market tells me.
How to Trade:
Short Setup:
Wait for HARDUSDT to approach the blue boxes.
Look for rejection signals on the lower time frames (5-minute, 15-minute).
Confirm with CDV and other technical indicators that the downward momentum is intact before entering a short.
Potential Long Shift:
If the resistance is broken with significant volume and a successful retest, be prepared to switch the bias to long.
This adaptive approach is what separates professional trading from mere speculation.
Why Follow This Analysis:
I operate at a level that most traders don’t reach—using a disciplined, data-driven approach that ensures every entry is validated by robust market signals. My methodology has been refined over years of experience, which is why my trading success is among the highest around.
If you’re serious about trading profitably, you need to follow strategies rooted in precision, discipline, and market-tested confirmations. Trust the process, follow the analysis, and let the market work in your favor.
Stay sharp and trade with confidence, your success depends on it.
📌I keep my charts clean and simple because I believe clarity leads to better decisions.
📌My approach is built on years of experience and a solid track record. I don’t claim to know it all but I’m confident in my ability to spot high-probability setups.
📌If you would like to learn how to use the heatmap, cumulative volume delta and volume footprint techniques that I use below to determine very accurate demand regions, you can send me a private message. I help anyone who wants it completely free of charge.
🔑I have a long list of my proven technique below:
🎯 ZENUSDT.P: Patience & Profitability | %230 Reaction from the Sniper Entry
🐶 DOGEUSDT.P: Next Move
🎨 RENDERUSDT.P: Opportunity of the Month
💎 ETHUSDT.P: Where to Retrace
🟢 BNBUSDT.P: Potential Surge
📊 BTC Dominance: Reaction Zone
🌊 WAVESUSDT.P: Demand Zone Potential
🟣 UNIUSDT.P: Long-Term Trade
🔵 XRPUSDT.P: Entry Zones
🔗 LINKUSDT.P: Follow The River
📈 BTCUSDT.P: Two Key Demand Zones
🟩 POLUSDT: Bullish Momentum
🌟 PENDLEUSDT.P: Where Opportunity Meets Precision
🔥 BTCUSDT.P: Liquidation of Highly Leveraged Longs
🌊 SOLUSDT.P: SOL's Dip - Your Opportunity
🐸 1000PEPEUSDT.P: Prime Bounce Zone Unlocked
🚀 ETHUSDT.P: Set to Explode - Don't Miss This Game Changer
🤖 IQUSDT: Smart Plan
⚡️ PONDUSDT: A Trade Not Taken Is Better Than a Losing One
💼 STMXUSDT: 2 Buying Areas
🐢 TURBOUSDT: Buy Zones and Buyer Presence
🌍 ICPUSDT.P: Massive Upside Potential | Check the Trade Update For Seeing Results
🟠 IDEXUSDT: Spot Buy Area | %26 Profit if You Trade with MSB
📌 USUALUSDT: Buyers Are Active + %70 Profit in Total
🌟 FORTHUSDT: Sniper Entry +%26 Reaction
🐳 QKCUSDT: Sniper Entry +%57 Reaction
📊 BTC.D: Retest of Key Area Highly Likely
📊 XNOUSDT %80 Reaction with a Simple Blue Box!
📊 BELUSDT Amazing %120 Reaction!
I stopped adding to the list because it's kinda tiring to add 5-10 charts in every move but you can check my profile and see that it goes on..
HARDUSDT trade ideas

HARDUSDT | Easy to TradeHARDUSDT | Clean and Predictable Price Action
Unlike some volatile assets, HARDUSDT is surprisingly easy to trade—as long as the price doesn’t start throwing absurd wicks. The key here is reacting, not predicting, and following the well-defined zones for optimal entries.
🔴 Short Opportunities – Red Box Resistance
✔️ The red box is a clear resistance area.
✔️ LTF breakdowns with CDV confirmations will be my trigger for shorts.
✔️ No need to rush—let the market show weakness first.
🔵 Long Opportunities – Blue Box Support
✔️ The blue box acts as a structured support zone.
✔️ LTF breakouts can give potential long scalping opportunities.
✔️ No bag-holding! These are not long-term setups—quick reactions, quick profits.
🔥 How to Approach This Trade:
🔹 Stick to lower time frame confirmations—data wins, emotions lose.
🔹 If price blows through key levels without structure, I stay out—there’s always another trade.
🔹 My ability to adapt is why I consistently stay ahead of the market. That’s why traders rely on my analysis.
Most traders fail because they chase, guess, and hope. I don’t. I act with precision and discipline, and that’s why my win rate speaks for itself. If you want real results, you’re in the right place. Follow closely, trade smarter.
📌I keep my charts clean and simple because I believe clarity leads to better decisions.
📌My approach is built on years of experience and a solid track record. I don’t claim to know it all but I’m confident in my ability to spot high-probability setups.
📌If you would like to learn how to use the heatmap, cumulative volume delta and volume footprint techniques that I use below to determine very accurate demand regions, you can send me a private message. I help anyone who wants it completely free of charge.
🔑I have a long list of my proven technique below:
🎯 ZENUSDT.P: Patience & Profitability | %230 Reaction from the Sniper Entry
🐶 DOGEUSDT.P: Next Move
🎨 RENDERUSDT.P: Opportunity of the Month
💎 ETHUSDT.P: Where to Retrace
🟢 BNBUSDT.P: Potential Surge
📊 BTC Dominance: Reaction Zone
🌊 WAVESUSDT.P: Demand Zone Potential
🟣 UNIUSDT.P: Long-Term Trade
🔵 XRPUSDT.P: Entry Zones
🔗 LINKUSDT.P: Follow The River
📈 BTCUSDT.P: Two Key Demand Zones
🟩 POLUSDT: Bullish Momentum
🌟 PENDLEUSDT.P: Where Opportunity Meets Precision
🔥 BTCUSDT.P: Liquidation of Highly Leveraged Longs
🌊 SOLUSDT.P: SOL's Dip - Your Opportunity
🐸 1000PEPEUSDT.P: Prime Bounce Zone Unlocked
🚀 ETHUSDT.P: Set to Explode - Don't Miss This Game Changer
🤖 IQUSDT: Smart Plan
⚡️ PONDUSDT: A Trade Not Taken Is Better Than a Losing One
💼 STMXUSDT: 2 Buying Areas
🐢 TURBOUSDT: Buy Zones and Buyer Presence
🌍 ICPUSDT.P: Massive Upside Potential | Check the Trade Update For Seeing Results
🟠 IDEXUSDT: Spot Buy Area | %26 Profit if You Trade with MSB
📌 USUALUSDT: Buyers Are Active + %70 Profit in Total
🌟 FORTHUSDT: Sniper Entry +%26 Reaction
🐳 QKCUSDT: Sniper Entry +%57 Reaction
📊 BTC.D: Retest of Key Area Highly Likely
📊 XNOUSDT %80 Reaction with a Simple Blue Box!
📊 BELUSDT Amazing %120 Reaction!
I stopped adding to the list because it's kinda tiring to add 5-10 charts in every move but you can check my profile and see that it goes on..

HARDUSDTWe can attempt to buy HARDUSDT from specified level as it make HL , also there is no bearish divergence occur indicate that it moves upward.
SL , TP mention in chart.

Hard buy signalBuy signal for HARD/USDT
Capital %5
Leverage 4x
Trade with of your own risk
Good luck.

HARDUSDT(KavaLend) Updated till 06-03-25HARDUSDT(KavaLend) Daily timeframe range. hard going hard for a while now, defended its local low instead of creating new low and today trying to get a valid close above 0.1484. which can lead it to 0.2183 if retail interest keeps up.

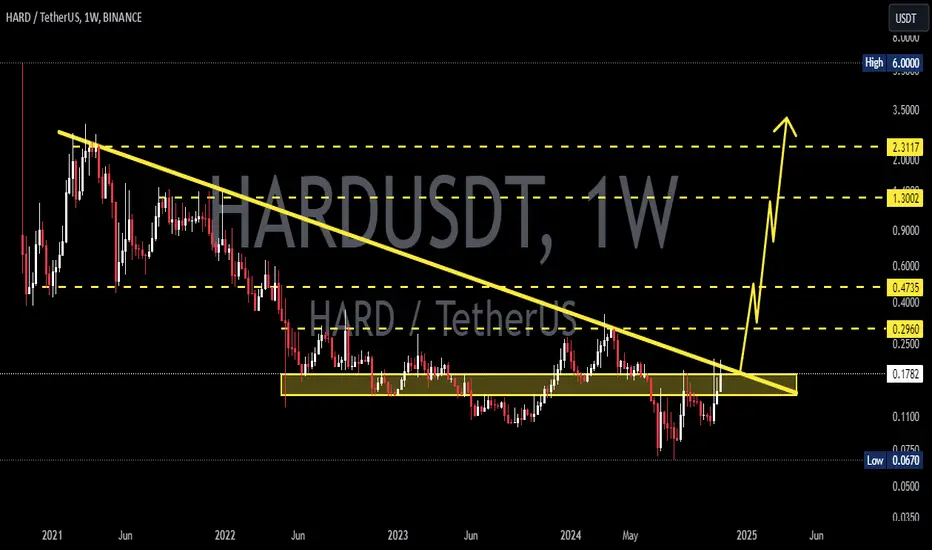
Kava Lend: Easy 987%Good Saturday my fellow trader,
Here we have a pair that has been consolidating since June 2022, for 2.5 years. This is a long consolidation phase and a long consolidation phase tends to lead to a strong bull-market.
The easy target here is 987%. Meaning, this pair can end up moving much higher once the incoming bullish cycle is over.
Even easier is a 511% target. Both are huge.
The market bottom happened in August 2024. This will be a huge one because it has a monitoring tag on Binance. It seems now that those pairs that are set to monitor on Binance tend to grow strongly on other exchanges.
There can be some volatility of course if a delisting tag gets added but the other exchanges will remain available for trading and any volatility prior to a strong bull-market will only result in an awesome buy-opportunity.
This will be one of the hidden gems; 10X potential or more.
I will continue to fish for great pairs and charts. That I can share with you.
Let's trade together, long-term.
Namaste.

HARDUSDT: Red Zones Mark the Spot for Sells! HARDUSDT: Red Zones Mark the Spot for Sells! 🔥
Here’s the deal, folks: the red boxes on HARDUSDT are where the action is. These are prime sell points , and you better believe they’re based on smart analysis, not guesswork.
Why the Red Boxes Matter:
They align with key resistance levels —zones where sellers are likely to take control.
The current market structure shows these levels could be pivotal for a short-term correction .
We’re seeing consistent volume spikes , adding even more weight to these areas.
Pro Strategy for These Zones:
Wait for Confirmation: Look for price rejections or bearish patterns—no need to rush!
Use your CDV, liquidity heatmap, and volume footprint indicators to confirm the move.
Risk Management: Place your stop-loss wisely—just above the red box. Never trade without protection!
💡 Want to sharpen your trading skills? I can teach you how to use tools like CDV, liquidity heatmaps, volume profiles, and volume footprints to dominate these markets. DM me or check my profile!
👉 Boost, comment, and follow! Let’s make HARDUSDT another great win. Success awaits! 🚀
Let me tell you, this is something special. These insights, these setups—they’re not just good; they’re game-changers. I've spent years refining my approach, and the results speak for themselves. People are always asking, "How do you spot these opportunities?" It’s simple: experience, clarity, and a focus on high-probability moves.
Want to know how I use heatmaps, cumulative volume delta, and volume footprint techniques to find demand zones with precision? I’m happy to share—just send me a message. No cost, no catch. I believe in helping people make smarter decisions.
Here are some of my recent analyses. Each one highlights key opportunities:
🎯 ZENUSDT.P: Patience & Profitability | %230 Reaction from the Sniper Entry
🐶 DOGEUSDT.P: Next Move
🎨 RENDERUSDT.P: Opportunity of the Month
💎 ETHUSDT.P: Where to Retrace
🟢 BNBUSDT.P: Potential Surge
📊 BTC Dominance: Reaction Zone
🌊 WAVESUSDT.P: Demand Zone Potential
🟣 UNIUSDT.P: Long-Term Trade
🔵 XRPUSDT.P: Entry Zones
🔗 LINKUSDT.P: Follow The River
📈 BTCUSDT.P: Two Key Demand Zones
🟩 POLUSDT: Bullish Momentum
🌟 PENDLEUSDT.P: Where Opportunity Meets Precision
🔥 BTCUSDT.P: Liquidation of Highly Leveraged Longs
🌊 SOLUSDT.P: SOL's Dip - Your Opportunity
🐸 1000PEPEUSDT.P: Prime Bounce Zone Unlocked
🚀 ETHUSDT.P: Set to Explode - Don't Miss This Game Changer
🤖 IQUSDT: Smart Plan
⚡️ PONDUSDT: A Trade Not Taken Is Better Than a Losing One
💼 STMXUSDT: 2 Buying Areas
🐢 TURBOUSDT: Buy Zones and Buyer Presence
🌍 ICPUSDT.P: Massive Upside Potential | Check the Trade Update For Seeing Results
🟠 IDEXUSDT: Spot Buy Area | %26 Profit if You Trade with MSB
📌 USUALUSDT: Buyers Are Active + %70 Profit in Total
🌟 FORTHUSDT: Sniper Entry +%26 Reaction
🐳 QKCUSDT: Sniper Entry +%57 Reaction
📊 BTC.D: Retest of Key Area Highly Likely
This list? It’s just a small piece of what I’ve been working on. There’s so much more. Go check my profile, see the results for yourself. My goal is simple: provide value and help you win. If you’ve got questions, I’ve got answers. Let’s get to work!

Hardusdt buy opportunity with x20 potentialsHARDUSDT is exhibiting a potential falling wedge pattern, signaling an imminent breakout as it approaches the critical breakout zone.
We should focus on the accumulation zone for strategic entry, as this area offers optimal opportunities to load up. Targets have been clearly outlined on the chart, ranging from short-term gains to the final setup zone.
Ensure steady accumulation and hold for the projected bullish move.

HARDUSDT 1WHARD ~ 1W
#HARD If you still have Conviction on this coin. This support block would be a very good buying place for now,. with a minimum target of 20%++

Buy Long if breakout HBARHBAR its far from ATH u can buy it for longterm and forget it and if you want to trading this my setup

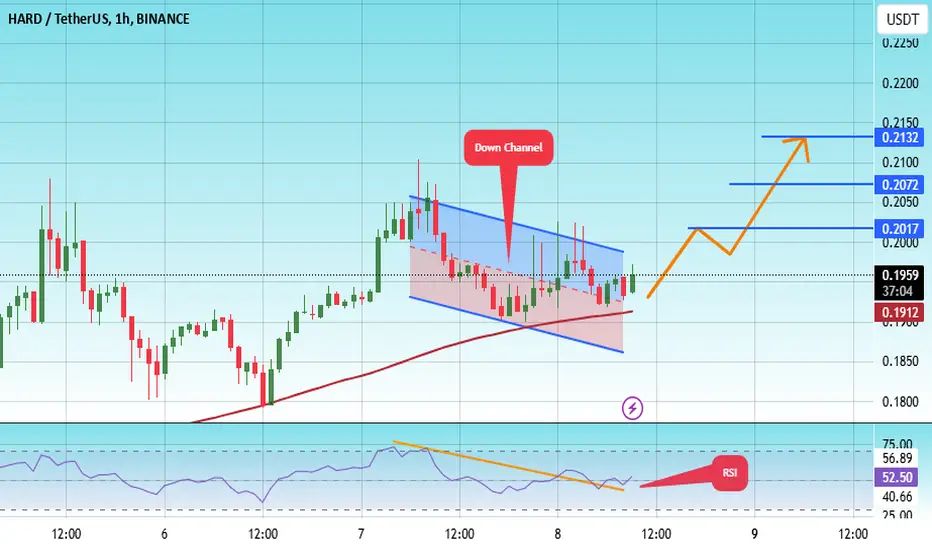
#HARD/USDT Ready to go higher#HARD
The price is moving in a descending channel on the 1-hour frame and sticking to it well
We have a bounce from the lower limit of the descending channel, this support is at 0.1880
We have a downtrend on the RSI indicator that is about to be broken, which supports the rise
We have a trend to stabilize above the moving average 100
Entry price 0.1960
First target 0.2017
Second target 0.2072
Third target 0.2132
#HARD #USDT Long Set UpChart looks interesting on 1H TF. Will be looking to long on the break of 0.1468
Entry 0.1468
Stoploss 0.1409
TP-1 0.1528
TP-2 0.1593

HARDUSDTHARD ~ 1W
#HARD If you have Conviction on the coin,. Buy gradually after breaking through this resistance line with Strong volume. buy in stages with a minimum target of 20%++
HARDUSDT possible moveHard has been consolidating in very good zone.
It could possibly make a good move

HARDUSDTWe can attempt to buy HARDUSDT from specified level as it makes HL , also 0.618 FIB level intact indicate that it moves upward .
SL , TP mention in chart.

Hard ascending broadening wedgeAscending broadening wedge currently playing out in $hard. Around 110% gain from current levels and around 80% from confirmation

HARDUSDTWe can attempt to buy HARDUSDT from specified level as it make HL , also no bearish divergence occur indicate that it moves upward.
SL , TP mention in chart.

HARDUSDT(KavaLend) Updated till 31-08-24HARDUSDT(KavaLend) Daily timeframe range. PA is trying to get out of its trouble zone. staying above 0.1230 will be more optimal here. specially depends on sellers it wont take much to push toward 0.1619 again. staying below 0.1230 will push it back to trouble zone.

HARD Strong Today Kava Lend
HARD Price is showing signs of strength - even tho is currently under Monitoring Status on binance - it has good pumpamentals

HARDUSDT.1DUpon examining the HARD/USDT chart, several pivotal technical observations can be drawn:
Technical Analysis
Resistance and Support Levels (R1, R2, S1, T):
The price action on the HARD/USDT pair has seen significant volatility with a sharp decline from the recent highs around the resistance level R2 at $0.1603.
The price is currently retesting the resistance level R1 at $0.1112. The ability or failure of the price to break and hold above this level could determine the near-term trend direction.
MACD Indicator:
The Moving Average Convergence Divergence (MACD) is in bearish territory, as indicated by the histogram values below the baseline and the MACD line below the signal line. This suggests that the downward momentum is still present.
RSI:
The Relative Strength Index (RSI) is below 50, which typically indicates a bearish sentiment. However, it is not extremely low, which might suggest that the selling pressure is not overwhelmingly strong at the moment.
Price Target (T):
The downward arrow pointing towards the support level S1 indicates a potential bearish outlook. If the price breaks below this support, further declines could be expected. However, any bounce from this level could indicate a temporary stabilization or a possible reversal.
Conclusion
The current market conditions on the HARD/USDT chart are bearish, with key resistance and support levels clearly impacting price movements. The technical indicators like MACD and RSI support a cautious approach, suggesting the prevailing downward trend might continue. Traders should watch for a decisive break above R1 for signs of a potential trend reversal. Until then, a bearish bias may be prudent, with particular attention to the support level S1 for further clues on price direction. This analysis advises maintaining vigilance and preparing for possible price movements based on these critical technical levels and indicators.

HARDUSDT.1DExamining the daily chart for HARD/USDT, I observe a marked decline in price which appears to have recently stabilized. The critical technical indicators and chart patterns provide insights that are valuable for potential trading strategies.
Technical Analysis Breakdown:
Support and Resistance Levels (S1 and R1):
The established support level at $0.06295 represents a significant area where the price has shown a tendency to stabilize. This could be a pivotal point for the asset, suggesting a possible floor where buyers come in.
The resistance at $0.1868 marks a clear upper boundary that has been tested in the past but not decisively broken through. This level is key for a potential bullish momentum shift.
Trend Indicators:
The trendline indicated by the green arrow suggests anticipation of a potential upward movement should the price find enough buying pressure to rebound from the support.
RSI (Relative Strength Index):
The RSI stands at 27.71, which is near the oversold territory (below 30). This usually indicates that the asset may be undervalued, and there might be a potential buying opportunity if other indicators align.
MACD (Moving Average Convergence Divergence):
The MACD line is below the signal line and both are trending downward, which historically suggests bearish momentum. However, the decreasing distance between the MACD and the signal line could hint at weakening bearish momentum.
Conclusion:
The HARD/USDT pair is currently at a crucial juncture. The support level holds significant importance, as a sustained price above this level could indicate accumulation and a potential reversal in trend. The oversold condition indicated by the RSI further supports this potential for a bounce back. However, the bearish trend indicated by MACD requires cautious observation for any signs of reversal before considering entry.
For potential investors or traders, closely monitoring the price action around these levels and waiting for confirmation of trend reversal through indicators like RSI divergence or a bullish MACD crossover could provide a safer entry point. As always, it is essential to consider external market factors and news that could influence price movements and ensure any trading decisions are supplemented with appropriate risk management strategies.

#HARD/USDT - Long - Potential 27.60%Strategy: Long
Exchange: BINANCE
Account: Spot
Entry mode: Market order in range
Invest: 5%
• Exit:
• ⎿ Target 2 : 0.3467 27.79%
• ⎿ Target 1 : 0.2943 8.48%
• Entry: 0.2713 ⌁ 0.2713
• ⎿ Current market price: 0.2713
• Stop: 0.2333 (-14.01%)
Technical indicators:
Trendline break, cross above 20MA, Resistance break (0.26, RSI Trendline break
• ⎿ 24h Volume: 3167093.0104
• ⎿ Satoshis: 0.2713
• ⎿ Analysis: TradingView

HARD/USDT Creating a Buzz in the Market? 👀🚀HARD Analysis💎Paradisers, shift your attention towards #HARDUSDT, which finds itself in a demand zone, signaling a prime setup for a bullish surge.
💎Currently, #KavaLend is charting a bullish course, with a trend forming near the $0.2290 support zone. This behavior has been consistent, marking the channel's support twice. Maintaining this momentum could lead us to expect a significant bullish push towards the target supply zone at $0.35.
💎However, if #HARD struggles to keep its bullish pace at the $0.2290 level, a strategy revision might be in order. In such an instance, we would consider a bullish rebound from a slightly lower demand zone at $0.189.
💎Keeping an eye on these market changes is crucial, as a fall below this critical juncture may call for a tactical shift, especially amidst potential hurdles in keeping the bullish trend alive in the #HARD market.
